


在前面的博客中,我们知道一个最简单的Eureka微服务架构,也要由3个项目组成,当项目增多的时候,Eureka是怎么维护服务的呢?如何确保其中一个服务实例不能使用了,将它排除出去呢?
由于整个演示过程还是Eureka的内容,我们首先从Spring Cloud服务管理框架Eureka简单示例(三)文章底部的源码链接拿到我们的示例代码。
客户端心跳推送与检测
Eureka分为服务器端和客户端,客户端每隔一段时间就会向服务器端发送一次讯息,向服务器说明自己还正常,让服务器端继续维护自己的服务,不要从服务列表里面把自己给剔除了。同时,设置一个让服务器端等待自己的时间,当自己的服务实例没有继续为服务器端发送心跳后,也就是从最后一次发送心跳开始计时,等待一段时间,依然没有收到讯息,服务器端就会把这个服务实例从服务列表里面移除,不再让流量涌入这个服务实例。
eureka.instance.lease-renewal-interval-in-seconds
表明客户端需要将心跳发送到服务器端,以表明它还活着。如果心跳停止的时间超过了服务器设置的等待时间,那么服务器端将会从它的服务列表中删除该实例,从而将流量排除在该实例之外。默认30s
eureka.instance.lease-expiration-duration-in-seconds
服务器端等待的时间,因为它收到了最后的心跳,然后才可以从它的视图中删除这个实例,并且不允许流量进入这个实例。将这个值设置得太长可能意味着,即使实例不存在,流量也可以被路由到实例。将这个值设置得太小可能意味着,由于临时网络故障,该实例可能会被排除在流量之外。这个值的设置至少要高于leaseRenewalIntervalInSeconds中指定的值。默认90s
我们通过修改这些配置,查看运行结果,去直观地理解这些配置。首先运行euraka-server项目com.init.springCloud包下面的ServerApp类main()方法,启动Eureka服务器端。然后,修改eureka-provider项目application.yml文件,把leaseRenewalIntervalInSeconds的时间改成5s,为了能够看到项目发送的心跳讯息,我们把Eureka的log日志打开,在控制台看输出结果。application.yml配置如下:
spring:
  application:
    name: eureka-provider

eureka:
  instance:
    leaseRenewalIntervalInSeconds: 5
  client:
    serviceUrl:
      defaultZone: http://localhost:8761/eureka/

logging:
  level:
    com.netflix: DEBUG
然后运行eureka-provider项目ProviderApp类的main()方法,项目启动成功之后,我们就能够在控制台看到打印出来的日志信息。我这里截取一段5s内的日志,为了方便观察,去掉了最前面的时间:
[{}->http://localhost:8761] total kept alive: 1, total issued: 0, total allocated: 1 out of 200
Getting free connection [{}->http://localhost:8761][null]
Released connection is reusable.
Releasing connection [{}->http://localhost:8761][null]
Pooling connection [{}->http://localhost:8761][null]; keep alive indefinitely
Notifying no-one, there are no waiting threads
Jersey HTTP PUT http://localhost:8761/eureka//apps/EUREKA-PROVIDER/DESKTOP-E3UNJK3:eureka-provider; statusCode=200
DiscoveryClient_EUREKA-PROVIDER/DESKTOP-E3UNJK3:eureka-provider - Heartbeat status: 200
浏览器访问http://localhost:8761,在Eureka的控制台也能够看见注册到服务器端的项目。
继续在eureka-provider项目的application.yml文件中添加leaseExpirationDurationInSeconds,跟leaseRenewalIntervalInSeconds并排,时间设置为10s,前面的介绍中说明了这个时间是要比leaseRenewalIntervalInSeconds大的。修改后的application.yml文件为:
spring:
  application:
    name: eureka-provider

eureka:
  instance:
    leaseRenewalIntervalInSeconds: 5
    leaseExpirationDurationInSeconds: 10
  client:
    serviceUrl:
      defaultZone: http://localhost:8761/eureka/

logging:
  level:
    com.netflix: DEBUG
由于服务器端会运行一个保护机制,虽然我们在客户端设置了10s之后就清除自己的实例,但是服务器端默认会在60s之后才去清理服务列表,并移除已经失效的服务实例。我们可以在eureka-server项目的application.yml新增配置,将服务器的自我保护机制关闭,并把自动清理的时间设置短一些。
enable-self-preservation 自我保护机制,默认开启
eviction-interval-timer-in-ms 服务器清理服务列表的定时器,默认60s,注意时间是毫秒
server:
  port: 8761

eureka:
  instance:
    hostname: localhost
  client:
    registerWithEureka: false
    fetchRegistry: false
    defaultZone: http://${eureka.instance.hostname}:${server.port}/eureka/
  server:
    enable-self-preservation: false
    eviction-interval-timer-in-ms: 10000
然后重新启动eureka-provider和eureka-server项目,访问http://localhost:8761,确定eureka-provider项目已经注册到eureka-server上面,之后,停止eureka-provider项目,等待大概10s以后,重新访问http://localhost:8761,就会看到eureka-server已经不再维护eureka-provider的服务了。
客户端服务抓取间隔
服务器端在更新了服务列表之后,客户端为了获得最新的服务列表,需要从服务器端主动抓取服务列表。
eureka.client.registry-fetch-interval-seconds
表示从“发现”服务器获取注册表信息的频率(以秒为单位)。
在eureka-consumer项目的ConsumerController类里添加一个方法,用于展示当前自己已经缓存的服务列表的信息,同时,为了展示eureka-consumer抓取服务的过程,我们同样在eureka-consumer的application.yml中开启日志,在控制台查看输出信息(为了方便查看,可以先把eureka-provider项目application.yml文件中的日志注释掉)。eureka-consumer的application.yml配置如下:
server:
  port: 8081

spring:
  application:
    name: eureka-consumer

eureka:
  client:
    registry-fetch-interval-seconds: 5
    serviceUrl:
      defaultZone: http://localhost:8761/eureka/

logging:
  level:
    com.netflix: DEBUG
ConsumerController类新加方法countService(),完整代码如下:
package com.init.springCloud;

import java.util.List;

import org.springframework.beans.factory.annotation.Autowired;
import org.springframework.cloud.client.ServiceInstance;
import org.springframework.cloud.client.discovery.DiscoveryClient;
import org.springframework.cloud.client.loadbalancer.LoadBalanced;
import org.springframework.context.annotation.Bean;
import org.springframework.context.annotation.Configuration;
import org.springframework.stereotype.Controller;
import org.springframework.web.bind.annotation.GetMapping;
import org.springframework.web.bind.annotation.ResponseBody;
import org.springframework.web.client.RestTemplate;

@Controller
@Configuration
public class ConsumerController {

	@Bean
	@LoadBalanced
	public RestTemplate getRestTemplate(){
		return new RestTemplate();
	}

	@GetMapping(value = "/router")
	@ResponseBody
	public String router(){
		RestTemplate temp = getRestTemplate();
		return temp.getForObject("http://eureka-provider/search/1", String.class);
	}

	@Autowired
	private DiscoveryClient  discoveryClient;

	@GetMapping(value = "/count")
	@ResponseBody
	public String countService(){
		List<String> services = discoveryClient.getServices();
		for (String string : services) {
			List<ServiceInstance> instances = discoveryClient.getInstances(string);
			System.out.println("服务名称:"+string+",服务数量:"+instances.size());
		}
		return "success";
	}

}之后,我们把三个项目都启动,在eureka-consumer的控制台下,可以看到服务抓取日志,这里同样去掉时间等其他信息:
Get connection: {}->http://localhost:8761, timeout = 5000
[{}->http://localhost:8761] total kept alive: 1, total issued: 0, total allocated: 1 out of 200
Getting free connection [{}->http://localhost:8761][null]
Released connection is reusable.
Releasing connection [{}->http://localhost:8761][null]
Pooling connection [{}->http://localhost:8761][null]; keep alive indefinitely
Notifying no-one, there are no waiting threads
Jersey HTTP GET http://localhost:8761/eureka//apps/delta?; statusCode=200
Got delta update with apps hashcode UP_2_
Added instance DESKTOP-E3UNJK3:eureka-provider to the existing apps in region null
Added instance DESKTOP-E3UNJK3:eureka-consumer:8081 to the existing apps in region null
The total number of instances fetched by the delta processor : 2
The total number of all instances in the client now is 2
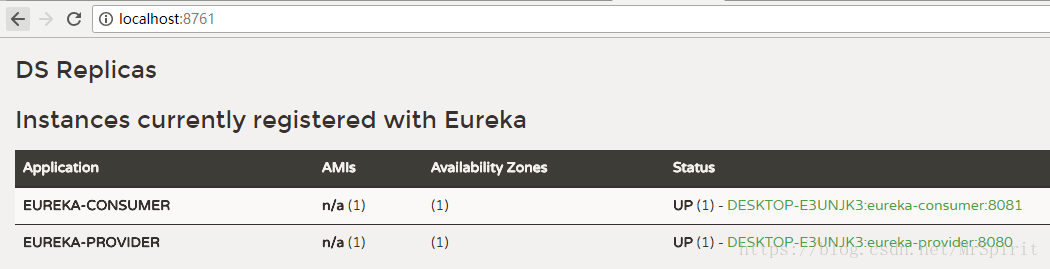
Completed cache refresh task for discovery. All Apps hash code is Local region apps hashcode: UP_2_, is fetching remote regions? false 访问http://localhost:8081/count,控制台也输出了我们统计的服务信息:
服务名称:eureka-consumer,服务数量:1
服务名称:eureka-provider,服务数量:1
使用Actuator健康端点检测客户端状态
默认情况下,Eureka使用客户端心跳来决定一个服务是否是处于“UP”状态的,只要客户端注册服务成功以后,Eureka服务器端就宣布这个服务是“UP”的,所以,如果是服务整个宕掉了,还好说,Eureka服务器能够知道这个服务挂掉了,但是倘若一个服务提供者不能进行数据库连接了,这个服务实例就是不可用的,但我们的服务器可不这么认为,因为他也无从知晓这个服务是有问题的。所以,我们这里引入Actuator,并使用它的\Health端点做健康检测。
在我们示例里面,eureka-provider是作为一个服务提供者,这里将它作为测试服务,引入Actuator的包,在eureka-provider的pom.xml中添加如下依赖:
	    <dependency>
	        <groupId>org.springframework.boot</groupId>
	        <artifactId>spring-boot-starter-actuator</artifactId>
	        <version>1.5.4.RELEASE</version>
	    </dependency>
我们在程序内部模仿数据库连接,并在控制器提供一个方法,用于修改数据库连接是否发生了故障,之后通知health端点,修改当前服务的状态。在ProviderController类添加下面的方法:
	public static Boolean isCanLinkDb = true;

	@RequestMapping(value = "/linkDb/{can}", method = RequestMethod.GET)
	public void LinkDb(@PathVariable Boolean can){
		isCanLinkDb = can;
	}
之后新建一个MyHealthIndicator类,实现HealthIndicator接口,重写Health方法,把数据库是否能连接这个状态传入,最后更改当前服务的健康状态:
package com.init.springCloud;

import org.springframework.boot.actuate.health.Health;
import org.springframework.boot.actuate.health.HealthIndicator;
import org.springframework.boot.actuate.health.Status;
import org.springframework.stereotype.Component;
/**
 * 自定义健康指示器(Spring Boot的内容)
 * @author spirit
 * @date 2018年5月3日 下午2:19:58
 * @email spirit612@sina.cn
 */
@Component
public class MyHealthIndicator implements HealthIndicator {

	@Override
	public Health health() {
		if(ProviderController.isCanLinkDb){
			return new Health.Builder(Status.UP).build();
		}else{
			return new Health.Builder(Status.DOWN).build();
		}
	}

}
这里修改了服务的状态,也是针对于eureka-provider自身来说的,我们能够通过health端点知道服务是否是正常的,那怎么能把health端点返回的服务状态告诉eureka-server呢?也就是跟Eureka服务器说明,我这个服务的数据库不能连接了,服务暂时不可以使用了,你在服务列表里面把我这个服务的状态更改到“DOWN”状态,不要继续让请求涌入我这个服务。这里我们使用Netflix里面提供的HealthCheckHandler接口来做,新建一个MyHealthCheckHandler类,实现HealthCheckHandler接口,重写getStatus()方法:
package com.init.springCloud;

import org.springframework.beans.factory.annotation.Autowired;
import org.springframework.boot.actuate.health.Status;
import org.springframework.stereotype.Component;

import com.netflix.appinfo.HealthCheckHandler;
import com.netflix.appinfo.InstanceInfo.InstanceStatus;

/**
 * 健康检查处理器
 * @author spirit
 * @date 2018年5月3日 下午2:39:45
 * @email spirit612@sina.cn
 */
@Component
public class MyHealthCheckHandler implements HealthCheckHandler {

	@Autowired
	private MyHealthIndicator myHealthIndicator;

	@Override
	public InstanceStatus getStatus(InstanceStatus instanceStatus) {
		Status status = myHealthIndicator.health().getStatus();
		if(status.equals(Status.UP)){
			return InstanceStatus.UP;
		}else{
			return InstanceStatus.DOWN;
		}
	}

}
其实,到这里,已经完成了所有的测试代码。但是,为了能让eureka-server接受到服务变更信息后,更快速地把服务列表的信息进行更改同步(多台发现服务的服务器之间会复制服务列表,进行更新),我们缩短一下更新的时间。
eureka.client.instance-info-replication-interval-seconds 表示复制实例更改的频率(以秒为单位),以复制到发现服务的服务器。默认30s。
在eureka-server的application.yml文件中添加上面的配置,把时间更改到10s:
server:
  port: 8761

eureka:
  instance:
    hostname: localhost
  client:
    registerWithEureka: false
    fetchRegistry: false
    instanceInfoReplicationIntervalSeconds: 10
    defaultZone: http://${eureka.instance.hostname}:${server.port}/eureka/
#  server:
#    enable-self-preservation: false
#    eviction-interval-timer-in-ms: 10000
为了方便测试,不影响观察,把上面两个项目中之前所做的各种配置全部注释掉,然后把三个项目全部启动。
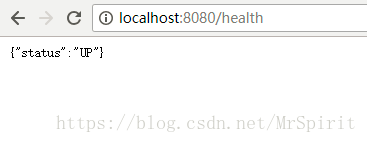
访问:http://localhost:8080/health,能看到eureka-provider项目当前的状态是“UP”
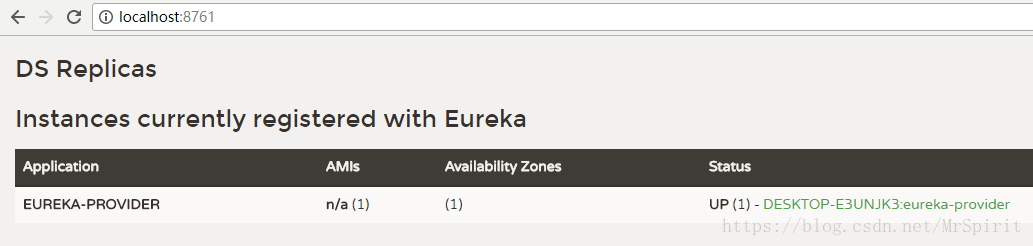
访问:http://localhost:8761,能看到eureka-provider项目的状态是“UP”:
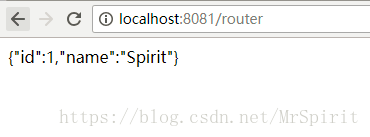
再访问:http://localhost:8081/router,通过eureka-consumer项目去调用eureka-provider的方法(不清楚过程的,可以查看之前的博客内容,也可在文章末尾下载源代码),也是能够正常返回结果:
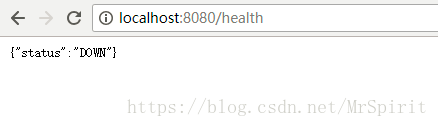
之后访问:http://localhost:8080/linkDb/false,设置eureka-provider项目的服务不可用,更改状态为“DOWN”。再次访问eureka-provider的健康端点:http://localhost:8080/health,可以看到服务状态已经更改了:
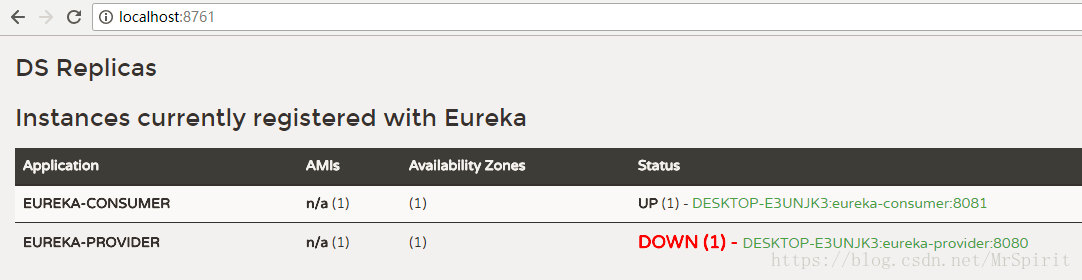
接着再次访问:http://localhost:8761,查看服务器维护的服务信息,eureka-provider的状态也被更改到“DOWN”这个不可用状态了:
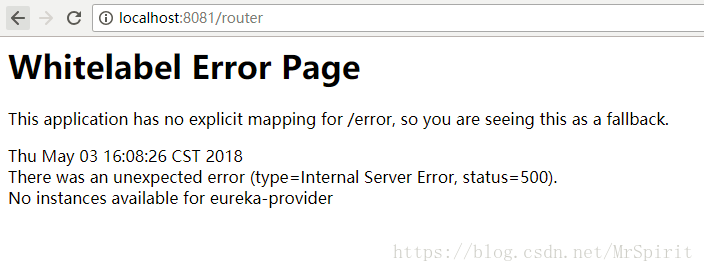
此时,eureka-consumer也是没办法再调用eureka-provider提供的服务了:
最后,大家有什么不懂的或者其他需要交流的内容,也可以进入我的QQ讨论群一起讨论:654331206
Spring Cloud系列:
Spring Cloud服务管理框架Eureka简单示例(三)


 2431
2431


 被折叠的 条评论
为什么被折叠?
被折叠的 条评论
为什么被折叠?
 到【灌水乐园】发言


