


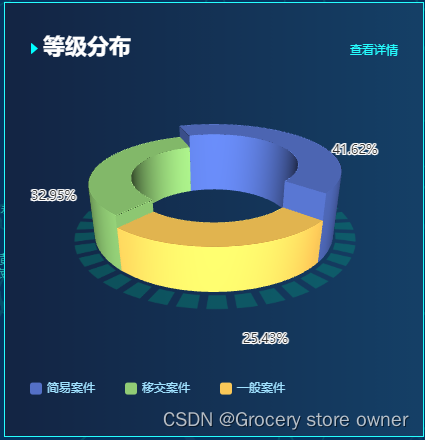
效果图
使用npm下载或cdn引入echarts,echarts-gl,
版本:“echarts”: “^5.1.2”
“echarts-gl”: “^2.0.8”
新建一个js文件pieChart.js,以便于调用
const getPie3D = (
    pieData,
    internalDiameterRatio,
    distance,
    alpha,
    pieHeight,
    opacity = 1
) => {
    const series = []
    let sumValue = 0
    let startValue = 0
    let endValue = 0
    let legendData = ['一般事故','一般事故','特大事故','轻微事故']
    let legendBfb = []
    const k = 1 - internalDiameterRatio
    pieData.sort((a, b) => {
        return b.value - a.value
    })
    // 为每一个饼图数据,生成一个 series-surface 配置
    for (let i = 0; i < pieData.length; i++) {
        sumValue += pieData[i].value
        const seriesItem = {
            name:
                typeof pieData[i].name === 'undefined'
                    ? `series${i}`
                    : pieData[i].name,
            type: 'surface',
            parametric: true,
            wireframe: {
                show: false,
            },
            pieData: pieData[i],
            pieStatus: {
                selected: false,
                hovered: false,
                k: k,
            },
            center: ['10%', '50%'],
        }
        if (typeof pieData[i].itemStyle !== 'undefined') {
            const itemStyle = {}
            itemStyle.color =
                typeof pieData[i].itemStyle.color !== 'undefined'
                    ? pieData[i].itemStyle.color
                    : opacity
            itemStyle.opacity =
                typeof pieData[i].itemStyle.opacity !== 'undefined'
                    ? pieData[i].itemStyle.opacity
                    : opacity
            seriesItem.itemStyle = itemStyle
        }
        series.push(seriesItem)
    }

    // 使用上一次遍历时,计算出的数据和 sumValue,调用 getParametricEquation 函数,
    // 向每个 series-surface 传入不同的参数方程 series-surface.parametricEquation,也就是实现每一个扇形。
    legendData = ['一般事故','一般事故','特大事故','轻微事故']
    legendBfb = []
    for (let i = 0; i < series.length; i++) {
        endValue = startValue + series[i].pieData.value
        series[i].pieData.startRatio = startValue / sumValue
        series[i].pieData.endRatio = endValue / sumValue
        series[i].parametricEquation = getParametricEquation(
            series[i].pieData.startRatio,
            series[i].pieData.endRatio,
            false,
            false,
            k,
            series[i].pieData.value
        )
        startValue = endValue
        const bfb = fomatFloat(series[i].pieData.value / sumValue, 4)
        legendData.push({
            name: series[i].name,
            value: bfb,
        })
        legendBfb.push({
            name: series[i].name,
            value: bfb,
        })
    }
    const boxHeight = getHeight3D(series, pieHeight) // 通过pieHeight设定3d饼/环的高度,单位是px
    // 准备待返回的配置项,把准备好的 legendData、series 传入。
    const option = {
        title: {
            text: '等级分布',
            // padding: [30, 0, 0, 40],
            top:'4.5%',
            left:'8.1%',
            textStyle: {
                // 文字颜色
                color: '#ffffff',
                // 字体风格,'normal','italic','oblique'
                fontStyle: 'normal',
                // 字体粗细 'normal','bold','bolder','lighter',100 | 200 | 300 | 400...
                fontWeight: 'bold',
                // 字体系列
                fontFamily: 'sans-serif',
                fontSize: '2.2rem',
            },
        },
        legend: {
            y: '85%', //延Y轴居中
            x: '5%',
            itemWidth: 12, // 设置宽度
            itemHeight: 12, // 设置高度
            textStyle: {
                color: '#ffffff',
                fontSize: 12,
            },
            data: legendData,
            orient: 'vertical',
            itemGap: 30,
            textStyle: {
                color: '#A1E2FF',
            },
            formatter: function (param) {
                const item = legendBfb.filter((item) => item.name === param)[0]
                const bfs = fomatFloat(item.value * 100, 2) + '%'
                return `${item.name}`
                // return `${item.name}  ${bfs}`
            },
        },
        labelLine: {
            show: true,
            lineStyle: {
                color: 'rgba(0,0,0,0)',
            },
        },
        label: {
            show: true,
            position: [10,10],
            formatter: '{d}%',
            fontSize: 16,
        },
        tooltip: {
            backgroundColor: '#033b77',
            borderColor: '#21f2c4',
            textStyle: {
                color: '#fff',
                fontSize: 13,
            },
            formatter: (params) => {
                // if (
                //     params.seriesName !== 'mouseoutSeries' &&
                //     params.seriesName !== 'pie2d'
                // ) {
                //     const bfb = (
                //         (option.series[params.seriesIndex].pieData.endRatio -
                //             option.series[params.seriesIndex].pieData
                //                 .startRatio) *
                //         100
                //     ).toFixed(2)
                //     return (
                //         `${params.seriesName}<br/>` +
                //         `<span style="display:inline-block;margin-right:5px;border-radius:10px;width:10px;height:10px;background-color:${params.color};"></span>` +
                //         `${bfb}%`
                //     )
                // }
            },
        },
        xAxis3D: {
            min: -1,
            max: 1,
        },
        yAxis3D: {
            min: -1,
            max: 1,
        },
        zAxis3D: {
            min: -1,
            max: 1,
        },
        grid3D: {
            show: false,
            boxHeight: boxHeight, // 圆环的高度
            viewControl: {
                // 3d效果可以放大、旋转等,请自己去查看官方配置
                alpha, // 角度
                distance, // 调整视角到主体的距离,类似调整zoom
                rotateSensitivity: 0, // 设置为0无法旋转
                zoomSensitivity: 0, // 设置为0无法缩放
                panSensitivity: 0, // 设置为0无法平移
                autoRotate: false, // 自动旋转
            },
        },
        series: series,
    }
    return option
}

/**
 * 生成扇形的曲面参数方程,用于 series-surface.parametricEquation
 */
const getParametricEquation = (
    startRatio,
    endRatio,
    isSelected,
    isHovered,
    k,
    h
) => {
    // 计算
    const midRatio = (startRatio + endRatio) / 2
    const startRadian = startRatio * Math.PI * 2
    const endRadian = endRatio * Math.PI * 2
    const midRadian = midRatio * Math.PI * 2
    // 如果只有一个扇形,则不实现选中效果。
    if (startRatio === 0 && endRatio === 1) {
        // eslint-disable-next-line no-param-reassign
        isSelected = false
    }
    // 通过扇形内径/外径的值,换算出辅助参数 k(默认值 1/3)
    // eslint-disable-next-line no-param-reassign
    k = typeof k !== 'undefined' ? k : 1 / 3
    // 计算选中效果分别在 x 轴、y 轴方向上的位移(未选中,则位移均为 0)
    const offsetX = isSelected ? Math.cos(midRadian) * 0.1 : 0
    const offsetY = isSelected ? Math.sin(midRadian) * 0.1 : 0
    // 计算高亮效果的放大比例(未高亮,则比例为 1)
    const hoverRate = isHovered ? 1.05 : 1
    // 返回曲面参数方程
    return {
        u: {
            min: -Math.PI,
            max: Math.PI * 3,
            step: Math.PI / 32,
        },
        v: {
            min: 0,
            max: Math.PI * 2,
            step: Math.PI / 20,
        },
        x: function (u, v) {
            if (u < startRadian) {
                return (
                    offsetX +
                    Math.cos(startRadian) * (1 + Math.cos(v) * k) * hoverRate
                )
            }
            if (u > endRadian) {
                return (
                    offsetX +
                    Math.cos(endRadian) * (1 + Math.cos(v) * k) * hoverRate
                )
            }
            return offsetX + Math.cos(u) * (1 + Math.cos(v) * k) * hoverRate
        },
        y: function (u, v) {
            if (u < startRadian) {
                return (
                    offsetY +
                    Math.sin(startRadian) * (1 + Math.cos(v) * k) * hoverRate
                )
            }
            if (u > endRadian) {
                return (
                    offsetY +
                    Math.sin(endRadian) * (1 + Math.cos(v) * k) * hoverRate
                )
            }
            return offsetY + Math.sin(u) * (1 + Math.cos(v) * k) * hoverRate
        },
        z: function (u, v) {
            if (u < -Math.PI * 0.5) {
                return Math.sin(u)
            }
            if (u > Math.PI * 2.5) {
                return Math.sin(u) * h * 0.1
            }
            return Math.sin(v) > 0 ? 1 * h * 0.1 : -1
        },
    }
}

/**
 * 获取3d丙图的最高扇区的高度
 */
const getHeight3D = (series, height) => {
    series.sort((a, b) => {
        return b.pieData.value - a.pieData.value
    })
    return (height * 25) / series[0].pieData.value
}

/**
 * 格式化浮点数
 */
const fomatFloat = (num, n) => {
    let f = parseFloat(num)
    if (isNaN(f)) {
        return false
    }
    f = Math.round(num * Math.pow(10, n)) / Math.pow(10, n) // n 幂
    let s = f.toString()
    let rs = s.indexOf('.')
    // 判定如果是整数,增加小数点再补0
    if (rs < 0) {
        rs = s.length
        s += '.'
    }
    while (s.length <= rs + n) {
        s += '0'
    }
    return s
}

export { getPie3D, getParametricEquation }
在html页面写一个盒子
<div style="width: 42rem;height: 43.5rem;" id="pieChartMap"></div>
使用时,需要引入pieChart.js里的getPie3D, getParametricEquation
// 图表初始化
initChart() {
this.statusChart = echarts.init(
document.getElementById('pieChartMap')
)
// 传入数据生成 option, 构建3d饼状图, 参数工具文件已经备注的很详细
this.option = getPie3D(this.optionData, 0.8, 240, 28, 26, 1)
this.statusChart.setOption(this.option)
// 是否需要label指引线,如果要就添加一个透明的2d饼状图并调整角度使得labelLine和3d的饼状图对齐,并再次setOption
this.option.series.push({
name: 'pie2d', // 自己根据场景修改
backgroundColor: 'transparent',
type: 'pie',
label: {
opacity: 1,
fontSize: 13,
lineHeight: 20,
},
startAngle: -40, // 起始角度,支持范围[0, 360]。
clockwise: false, // 饼图的扇区是否是顺时针排布。上述这两项配置主要是为了对齐3d的样式
radius: ['20%', '50%'],
center: ['50%', '50%'],
data: this.optionData,
itemStyle: {
opacity: 0, // 这里必须是0,不然2d的图会覆盖在表面
},
})
this.statusChart.setOption(this.option)
this.bindListen(this.statusChart)
},
bindListen(myChart, optionName = 'option') {
let selectedIndex = ''
let hoveredIndex = ''
// 监听点击事件,实现选中效果(单选)
myChart.on('click', (params) => {
// 从 option.series 中读取重新渲染扇形所需的参数,将是否选中取反。
const isSelected =
!this[optionName].series[params.seriesIndex].pieStatus
.selected
const isHovered =
this[optionName].series[params.seriesIndex].pieStatus
.hovered
const k =
this[optionName].series[params.seriesIndex].pieStatus.k
const startRatio =
this[optionName].series[params.seriesIndex].pieData
.startRatio
const endRatio =
this[optionName].series[params.seriesIndex].pieData.endRatio
// 如果之前选中过其他扇形,将其取消选中(对 option 更新)
if (
selectedIndex !== '' &&
selectedIndex !== params.seriesIndex
) {
this[optionName].series[selectedIndex].parametricEquation =
getParametricEquation(
this[optionName].series[selectedIndex].pieData
.startRatio,
this[optionName].series[selectedIndex].pieData
.endRatio,
false,
false,
k,
this[optionName].series[selectedIndex].pieData.value
)
this[optionName].series[
selectedIndex
].pieStatus.selected = false
}
// 对当前点击的扇形,执行选中/取消选中操作(对 option 更新)
this[optionName].series[params.seriesIndex].parametricEquation =
getParametricEquation(
startRatio,
endRatio,
isSelected,
isHovered,
k,
this[optionName].series[params.seriesIndex].pieData
.value
)
this[optionName].series[params.seriesIndex].pieStatus.selected =
isSelected
// 如果本次是选中操作,记录上次选中的扇形对应的系列号 seriesIndex
selectedIndex = isSelected ? params.seriesIndex : null
// 使用更新后的 option,渲染图表
myChart.setOption(this[optionName])
})
// 监听 mouseover,近似实现高亮(放大)效果
myChart.on('mouseover', (params) => {
// 准备重新渲染扇形所需的参数
let isSelected
let isHovered
let startRatio
let endRatio
let k
// 如果触发 mouseover 的扇形当前已高亮,则不做操作
if (hoveredIndex === params.seriesIndex) {
// 否则进行高亮及必要的取消高亮操作
} else {
// 如果当前有高亮的扇形,取消其高亮状态(对 option 更新)
if (hoveredIndex !== '') {
// 从 option.series 中读取重新渲染扇形所需的参数,将是否高亮设置为 false。
isSelected =
this[optionName].series[hoveredIndex].pieStatus
.selected
isHovered = false
startRatio =
this[optionName].series[hoveredIndex].pieData
.startRatio
endRatio =
this[optionName].series[hoveredIndex].pieData
.endRatio
k = this[optionName].series[hoveredIndex].pieStatus.k
// 对当前点击的扇形,执行取消高亮操作(对 option 更新)
this[optionName].series[
hoveredIndex
].parametricEquation = getParametricEquation(
startRatio,
endRatio,
isSelected,
isHovered,
k,
this[optionName].series[hoveredIndex].pieData.value
)
this[optionName].series[
hoveredIndex
].pieStatus.hovered = isHovered
// 将此前记录的上次选中的扇形对应的系列号 seriesIndex 清空
hoveredIndex = ''
}
// 如果触发 mouseover 的扇形不是透明圆环,将其高亮(对 option 更新)
if (
params.seriesName !== 'mouseoutSeries' &&
params.seriesName !== 'pie2d'
) {
// 从 option.series 中读取重新渲染扇形所需的参数,将是否高亮设置为 true。
isSelected =
this[optionName].series[params.seriesIndex]
.pieStatus.selected
isHovered = true
startRatio =
this[optionName].series[params.seriesIndex].pieData
.startRatio
endRatio =
this[optionName].series[params.seriesIndex].pieData
.endRatio
k =
this[optionName].series[params.seriesIndex]
.pieStatus.k
// 对当前点击的扇形,执行高亮操作(对 option 更新)
this[optionName].series[
params.seriesIndex
].parametricEquation = getParametricEquation(
startRatio,
endRatio,
isSelected,
isHovered,
k,
this[optionName].series[params.seriesIndex].pieData
.value + 60
)
this[optionName].series[
params.seriesIndex
].pieStatus.hovered = isHovered
// 记录上次高亮的扇形对应的系列号 seriesIndex
hoveredIndex = params.seriesIndex
}
// 使用更新后的 option,渲染图表
myChart.setOption(this[optionName])
}
})
// 修正取消高亮失败的 bug
myChart.on('globalout', (params) => {
// 准备重新渲染扇形所需的参数
let isSelected
let isHovered
let startRatio
let endRatio
let k
if (hoveredIndex !== '') {
// 从 option.series 中读取重新渲染扇形所需的参数,将是否高亮设置为 true。
isSelected =
this[optionName].series[hoveredIndex].pieStatus.selected
isHovered = false
k = this[optionName].series[hoveredIndex].pieStatus.k
startRatio =
this[optionName].series[hoveredIndex].pieData.startRatio
endRatio =
this[optionName].series[hoveredIndex].pieData.endRatio
// 对当前点击的扇形,执行取消高亮操作(对 option 更新)
this[optionName].series[hoveredIndex].parametricEquation =
getParametricEquation(
startRatio,
endRatio,
isSelected,
isHovered,
k,
this[optionName].series[hoveredIndex].pieData.value
)
this[optionName].series[hoveredIndex].pieStatus.hovered =
isHovered
// 将此前记录的上次选中的扇形对应的系列号 seriesIndex 清空
hoveredIndex = ''
}
// 使用更新后的 option,渲染图表
myChart.setOption(this[optionName])
})
},
在mounted里调用this.leftChart()即可
echarts社区地址:http://www.ppchart.com/#/
https://www.makeapie.cn/echarts
在此原文章更改:link


 2012
2012


 被折叠的 条评论
为什么被折叠?
被折叠的 条评论
为什么被折叠?
 到【灌水乐园】发言


