


原文:http://www.longtask.net/2018/11/15/swap-used-full/#top

背景
线上服务收到报警,报警内容:虚拟机swap区占用比例超过80%,如图:

本文着重描述排查问题的过程,在这个过程中不断的猜测–>验证–>推翻–>再猜测–>再验证–>再推翻,这个过程更有意思;
swap是什么
潜意识中,当进程需要申请内存而机器内存不够时,需要将一部分不常用的进程、数据换出到swap,从而腾出一部分物理内存空间;
看下关于Linux swap space的介绍:
Linux divides its physical RAM (random access memory) into chucks of memory called pages. Swapping is the process whereby a page of memory is copied to the preconfigured space on the hard disk, called swap space, to free up that page of memory. The combined sizes of the physical memory and the swap space is the amount of virtual memory available.
Swapping is necessary for two important reasons. First, when the system requires more memory than is physically available, the kernel swaps out less used pages and gives memory to the current application (process) that needs the memory immediately. Second, a significant number of the pages used by an application during its startup phase may only be used for initialization and then never used again. The system can swap out those pages and free the memory for other applications or even for the disk cache.
找出哪些进程占用了swap
如果说swap被占用了,说明物理内存不够,那么需要先找出哪些进程占用了swap,再去看看这些进程是什么原因导致占用swap;
线上虚拟机配置内存为8G,swap为2G,可以通过/proc/$(pid)/smaps找到哪些进程占用了swap;

通过top命令我们也可以看到是java进程占用了1.8G的swap区:

什么原因导致java进程需要申请swap
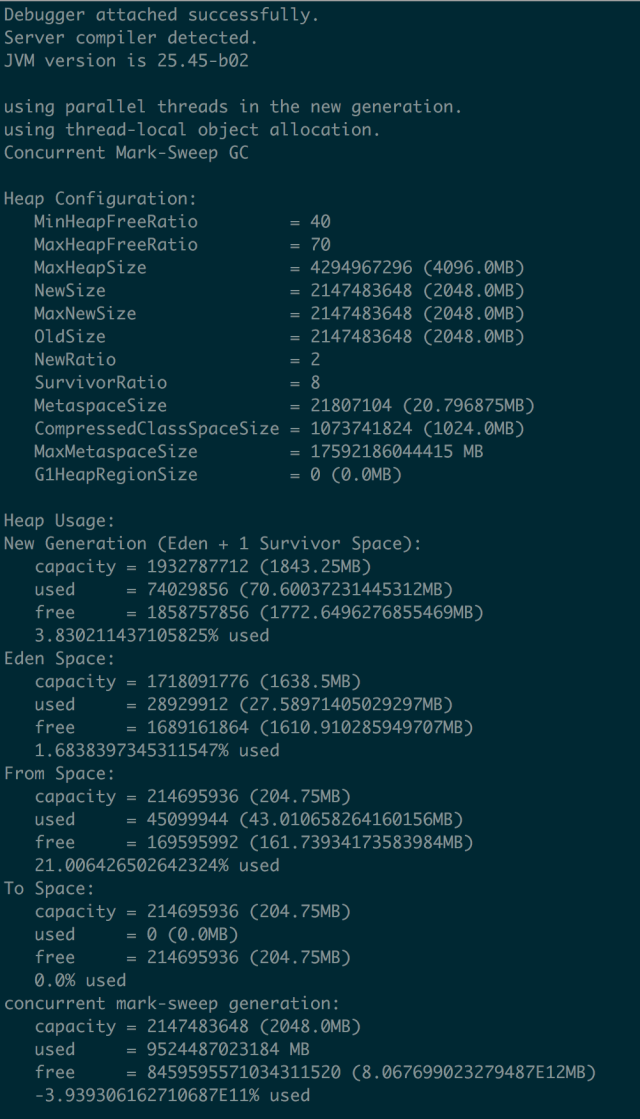
线上jdk1.8,应用启动参数配置:-Xmx4g -Xms4g -Xmn2g,metaspace用的默认;
通过线上发布记录看到,在11-01号下午发布,11-02号swap开始被占用:

所以第一个怀疑的点便是上线发布导致,此次发布包含两块内容:升级jdk1.7至jdk1.8、分单逻辑优化;首先怀疑的是逻辑优化、导致每分钟java堆内存导致大量对象被创建,但是这些对象的生命周期很短、应该会被快速回收,如果是大量对象创建导致占用内存过多,那么gc次数应该比发布前要频繁,所以再来看gc监控:


发现gc次数频率与之前相比并无明显变化,并且年轻代和年老代内存都在合理范围内;
所以真的是因为分单逻辑优化导致的吗?
Java堆分配了4G、通过jstat看到metaspace用了200M、线程栈大概占用300M(300左右个线程、每个线程1M内存),总共是4.5G左右,而top命令显示java占用的物理内存为6.5G(RES列显示的数据),另外2G是哪里占用了?堆外内存?
所以我们的思路转向到了堆外内存,看看从这个思路上是否可以找出一些线索;
这里通过google-perftools这个工具来查看java进程内存分配情况,其实接下来的排查思路类似这篇文章:JAVA使用堆外内存导致swap飙高
首先安装google-perftools,见这里,java应用启动时加上google-perftools的配置:
export LD_PRELOAD=/home/user/gperftools/lib/libtcmalloc.so
export HEAPPROFILE=/home/user/heap-gperftools/gzip
# 此配置表示进程每分配X字节内存输出一个文件,默认是1G输出一个文件
export HEAP_PROFILE_ALLOCATION_INTERVAL=4073741824
# 此配置表示进程每使用X字节内存输出一个文件,默认是100M输出一个文件,对于我这个应用来说,刚启动生成50多个文件,不便于分析问题,所以我设置的4G左右
export HEAP_PROFILE_INUSE_INTERVAL=4048576000
环境变量配置好重启java应用,此时在目录下就可以看到生成的gzip.0001.heap类的文件,来分析这些文件:
/home/sankuai/gperftools/bin/pprof –text /usr/local/java8/bin/java gzip.0001.heap
对输出的结果进行排序显示前20行:
2060.7  79.1%  79.1%   2060.7  79.1% updatewindow
0.0   0.0% 100.0%   2060.7  79.1% Java_java_util_zip_Inflater_inflateBytes
0.0   0.0% 100.0%   2060.7  79.1% inflate
0.0   0.0% 100.0%   2057.3  79.0% 0x00007f764b47ee05
0.0   0.0% 100.0%   2045.5  78.6% 0x00007f764b6c861f
5.5   0.2%  99.9%    455.3  17.5% Java_java_util_zip_Inflater_init
0.0   0.0% 100.0%    452.7  17.4% 0x00007f764b4f8eb0
449.8 17.3% 96.4%    449.8  17.3% inflateInit2_
0.0   0.0% 100.0%    427.8  16.4% 0x00007f764bb4d16b
45.8  1.8%  98.2%     45.8   1.8% init
0.0   0.0% 100.0%     45.8   1.8% _init@4210
0.0   0.0% 100.0%     45.8   1.8% __do_global_ctors_aux@12b20
0.0   0.0% 100.0%     44.8   1.7% JavaCalls::call_helper
0.0   0.0% 100.0%     43.9   1.7% start_thread
0.0   0.0% 100.0%     42.8   1.6% 0x00007f764b32e4e6
0.0   0.0% 100.0%     41.9   1.6% JavaMain
8.3   1.5%  99.6%     38.3   1.5% os::malloc
0.0   0.0% 100.0%     35.5   1.4% 0x00007f764b33598c
0.0   0.0% 100.0%     28.3   1.1% 0x00007f764b33570f
0.0   0.0% 100.0%     26.3   1.0% jni_invoke_static
可以看出Java_java_util_zip_Inflater_inflateBytes方法分配了比较多的内存,再分析其它heap文件,也都是这个方法,所以从这个方法入手继续追踪,需要找到是业务哪行代码调用了Inflater类,这里我们使用btrace这个工具,btace脚本如下;
import static com.sun.btrace.BTraceUtils.*;
import com.sun.btrace.annotations.*;

import java.nio.ByteBuffer;
import java.lang.Thread;

@BTrace
public class BtracerInflater{
   @OnMethod(
      clazz="java.util.zip.Inflater",
      //method="inflateBytes"
      method="inflate"
   )
   public static void traceCacheBlock(){
     println("Who call java.util.zip.Inflater's methods :");
     jstack();
   }
}
通过打印inflate方法的调用堆栈,找到两处调用:一处是公司的监控组件、一处是jetty启动时扫描jar包会用;
先分析公司的监控组件,监控组件会每隔1分钟去服务器拉取监控配置信息(比如路由IP地址、客户端连接超时时间、长SQL阈值配置等),而服务器返回的配置信息是xml格式,在解析xml时会用到inflate方法,于是我们通过禁用监控组件、重启应用、发现java应用所占的物理内容并没有减少,所以排除是监控组件的问题;
再来看btrace打印的jetty调用栈:
Who call java.util.zip.Inflater's methods :
java.util.zip.Inflater.inflate(Inflater.java)
java.util.zip.InflaterInputStream.read(InflaterInputStream.java:152)
java.io.FilterInputStream.read(FilterInputStream.java:133)
java.io.FilterInputStream.read(FilterInputStream.java:133)
org.objectweb.asm.ClassReader.a(Unknown Source)
org.objectweb.asm.ClassReader.<init>(Unknown Source)
org.eclipse.jetty.annotations.AnnotationParser.scanClass(AnnotationParser.java:888)
org.eclipse.jetty.annotations.AnnotationParser$2.processEntry(AnnotationParser.java:847)
org.eclipse.jetty.webapp.JarScanner.matched(JarScanner.java:161)
org.eclipse.jetty.util.PatternMatcher.matchPatterns(PatternMatcher.java:100)
org.eclipse.jetty.util.PatternMatcher.match(PatternMatcher.java:82)
org.eclipse.jetty.webapp.JarScanner.scan(JarScanner.java:84)
org.eclipse.jetty.annotations.AnnotationParser.parse(AnnotationParser.java:859)
org.eclipse.jetty.annotations.AnnotationParser.parse(AnnotationParser.java:874)
com.xxx.boot.RJRAnnotationConfiguration.parseWebInfClasses(RJRAnnotationConfiguration.java:96)
org.eclipse.jetty.annotations.AnnotationConfiguration.configure(AnnotationConfiguration.java:113)
org.eclipse.jetty.webapp.WebAppContext.configure(WebAppContext.java:468)
org.eclipse.jetty.webapp.WebAppContext.startContext(WebAppContext.java:1247)
org.eclipse.jetty.server.handler.ContextHandler.doStart(ContextHandler.java:710)
org.eclipse.jetty.webapp.WebAppContext.doStart(WebAppContext.java:494)
org.eclipse.jetty.util.component.AbstractLifeCycle.start(AbstractLifeCycle.java:64)
org.eclipse.jetty.server.handler.HandlerCollection.doStart(HandlerCollection.java:229)
org.eclipse.jetty.util.component.AbstractLifeCycle.start(AbstractLifeCycle.java:64)
org.eclipse.jetty.server.handler.HandlerWrapper.doStart(HandlerWrapper.java:95)
org.eclipse.jetty.server.Server.doStart(Server.java:280)
org.eclipse.jetty.util.component.AbstractLifeCycle.start(AbstractLifeCycle.java:64)
sun.reflect.NativeMethodAccessorImpl.invoke0(Native Method)
sun.reflect.NativeMethodAccessorImpl.invoke(NativeMethodAccessorImpl.java:62)
sun.reflect.DelegatingMethodAccessorImpl.invoke(DelegatingMethodAccessorImpl.java:43)
java.lang.reflect.Method.invoke(Method.java:497)
com.xxx.Bootstrap.main(Bootstrap.java:101)
jetty的调用场景是:为了支持Servlet规范中的注解方式(使得不再需要在web.xml文件中进行Servlet的部署描述,简化开发流程),jetty在启动时会扫描class、lib包,将使用注解方式声明的Servlet、Listener注册到jetty容器,在扫描jar包的时候调用了inflate,分配了大量的内存,此时通过关键词搜索到Memory leak while scanning annotations,这篇文章给出了两种解决方法,一种是评论处所说,禁用缓存(说是jdk1.8的bug):
Here’s a link to the java bugs database issue: http://bugs.java.com/bugdatabase/view_bug.do?bug_id=8156014
I’d like to be able to comment on it, but I can’t seem to find a link to allow me to do that.
The comments I’d like to add are:
the problem is still reproduceable as of jdk8u112
the problem seems to be fixed in jdk9: I tested jdk9ea+149 and couldn’t reproduce
I’ve tried some workarounds for jdk8: it seems the ServiceLoader impl uses the jarurlconnection caching, so it may be of some benefit to try to disable url caching (although not sure of the effects on performance).
Try creating an xml file (eg called “caches.xml”) with the following contents:
<Configure id="Server" class="org.eclipse.jetty.server.Server">

 <Set class="org.eclipse.jetty.util.resource.Resource" name="defaultUseCaches">false</Set>
 <New class="java.io.File">
   <Arg>
    <SystemProperty name="java.io.tmpdir"/>
   </Arg>
   <Call name="toURI">
     <Call id="url" name="toURL">
       <Call name="openConnection">
         <Set name="defaultUseCaches">false</Set>
       </Call>
     </Call>
   </Call>
 </New>
</Configure>
尝试之后,java进程占用的物理内存由6.5G降到了5.9G,有一定的效果,但是我们估算的java进程应该占4.5G左右,还有1.4G内存被谁占用了呢?
再尝试另外一种方法:
We were investigating a Jetty application that used much more memory than it was supposed to do (near a Gb more than the max heap size plus the max metaspace size). We found out that the extra memory was Native memory, being allocated using malloc via some library (we don’t have native code in our app). Then we used jemalloc ( http://www.canonware.com/jemalloc/) to find out which class was doing this allocation and we found out that it was java.util.zip.Inflater. Via jstack we were able to find calls to the library and the main caller was Jetty, while in the process of looking for annotations. We disable annotations for the application and the memory usage went back to normal.
既然jetty调用是因为扫描jar包中的注解,我们应用中没有通过注解声明的Servlet、Listener,是不是可以不需要扫描这一步,故而在jetty.xml中将注解扫描的方式去掉:
<!-- <Item>org.eclipse.jetty.annotations.AnnotationConfiguration</Item> -->
<!-- Item>com.xxx.boot.RJRAnnotationConfiguration</Item> -->
再重启应用,发现内存使用由6.5G降到了3.9G,并且应用运行稳定后不再占用swap,如图:

看下对比:
| 机器 | 改动 | 内存使用 | 系统稳定运行后 |
|---|---|---|---|
| 机器1 | 什么都不变 | java占用物理内存6.5G |  |
| 机器2 | 禁用jetty resource缓存 | 从6.5G降到5.9G | 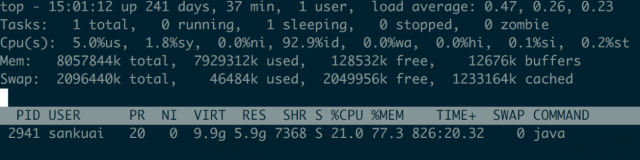 |
| 机器3 | 禁用注解扫描 | 从6.5G降到3.9G |  |
总结
总结下排查问题的大概思路:
- 确认哪些进程占用了swap;(定位到是java进程)
- 理论上java进程不应用占用6.5G物理内存,通过gperftools工具查看java进程内存分配;(排除堆内内存问题,找到java.util.zip.Inflater类分配内存较多)
- 通过btrace定位哪些地方调用了java.util.zip.Inflater类;(排除监控组件的问题、锁定jetty启动调用)
- 尝试不同解决方法;
- 最后物理内存是降了,但是这就是最优解吗?这种方法是不是一种逃避解决方案(相当于不能使用Servlet注解方式)?
- 有没有更好的解决方法?
- 如果说是jdk1.8的问题,那么其它地方用jarurlconnection cache的地方是不是都存在内存泄漏?1.7的实现和1.9的实现是什么样的?
- 其它Servlet容器会不会存在这种问题?Tomcat也实现了Servlet规范,是如何实现的?
发散
虽然最后貌似找到了一种解决方法,但是还有很多疑问,当我们做其它事情的时候,是不是也是像排查这问题这样,不断怀疑–>验证–>思考–>尝试,直至找到一个相对满意的结果,但不一定最优的结果。
像马云马老师在创业未成功时,是不是也是不断的摸索,取得一定结果了、才知道走的路是相对正确的?
那么到底是因为得到了结果才相信、还是因为相信才有的结果?


 982
982


 被折叠的 条评论
为什么被折叠?
被折叠的 条评论
为什么被折叠?
 到【灌水乐园】发言


