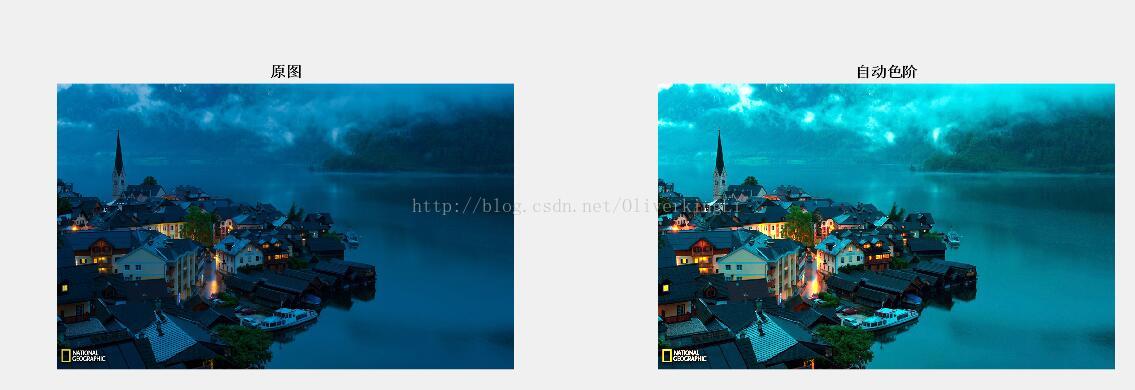
function I_out=F_color(I, percent)
%%% the tonal range of the input image is 0-1.
[row, col]=size(I);
I_sort=sort(I(:));
I_out=I;

%%% based on the clipping percentage,
%%% compute the upper and lower boundaries
if (percent==0)
    I_min=min(I_sort)
    I_max=max(I_sort)
else
    I_min=I_sort(floor(row*col*percent))
    I_max=I_sort(floor(row*col*(1-percent)))
end

for i=1:row
    for j=1:col
            if(I(i,j)<I_min)
                I_out(i,j)=I_min;
            elseif(I(i,j)>I_max)
                I_out(i,j)=1;
            else
                I_out(i,j)=(I(i,j)-I_min)*(1-I_min)/(I_max-I_min)+I_min;
            end
    end
end
function I_out=F_color(I, percent)%%% the tonal range of the input image is 0-1.[row, col]=size(I);I_sort=sort(I(:));I_out=I;%%% based on the clipping percentage, %%% compute the upper and lowe


 931
931


 被折叠的 条评论
为什么被折叠?
被折叠的 条评论
为什么被折叠?
 到【灌水乐园】发言


