


调整JVM ( v 1.3.1 ) GC
关键词:
gc:garbage collection(垃圾收集)
infant mortality:对象分配以后很快成为垃圾,就称该对象具有“infant mortality”
minor collection:较小收集
major collection:较大收集
older generation:年老代
young generation:年轻代
footprint:是一批工作进程的集合,以页和缓冲行数计量,在物理内存有限或者有很多处理器的系统里,footprint 可代表伸缩性
survivor spaces:生存空间
eden:新的对象分配的地方
throughput:是未消耗在垃圾收集的时间占总时间的百分比
简介:
Java 2平台越来越多的应用于大型的服务器应用,如web services。这类应用要求有可扩展性,并直接受益于多线程,多处理器,sockets以及内存。然而,“big iron”性能被誉为一种艺术形式,并需要特殊技术,这种技术超出改善小型系统性能所需要的技术。幸运的是,JVM和Solaris操作环境提供了线程、I/O和内存管理的有利条件。这篇文档阐述了在获取高性能的过程中所遇到的难题:GC难调。
Amdahl发现大部分的工作不能被很好地并行化:某些工作总是串行的,但是并不能从并行化获得好处。Java2平台也是这种情况。特别是,JVM 1.3.1 及以上版本没有并行GC,所以相对于并行收集的应用,在多处理器系统的GC的影响会增长。
下图显示一个完美的理想系统,除GC外,具有良好的伸缩性。最上面的线(红色),反映了在单处理器上,只花1%时间在GC上的应用情况:这可以理解为,在32个处理器上,将会损失至少20%的Throughput。到10%时,如果不考虑单处理器应用中GC所用大量时间,那么损失的Throughput将会超过75%。

这就证明了当GC花费时间比例增大的时候,在小型系统应用上所损失的Throughput可能会成为瓶颈问题。唯一的希望就是,对这个瓶颈问题的一点小改进能获得很高的性能。对于一个大型的系统来讲,调整GC则是值得的。
这篇文档描述的是Solaris(SPARC Platform Edition)操作环境中的JVM 1.3. 1 ,因为这个平台提供了当今Java2平台最具伸缩性的软硬件环境。然而,这些描述的文字同样适用于其他的平台,包括Linux,Windows,Solaris(Intel Architecture)操作环境,以达到升级硬件的最大可用程度。尽管命令行选项适用于大部分的平台,但是一些平台可能有与这里所述不同的缺省值。
分代收集:
Java 2 平台一个很强的特性之一就是屏蔽内存分配和GC的复杂性。然而,一旦GC成为瓶颈,那么就要理解所隐藏实现的细节。垃圾收集器对应用使用对象的方式作了限定,这些限定就反映在可调整参数中。这些参数可以被调整,在不牺牲抽象能力情况下获取更高的性能。
在一个运行的程序中,如果一个对象不再有任何引用,那么它将成为“垃圾”。大部分GC算法简单就是对每个可获取对象进行遍历:任何被遗弃的对象,将成为“垃圾”。这种算法所花的时间和实际活动对象的数量成比例,但对于具有大量活动数据的大型应用,就不可行了。
JVM v1.3 集许多不同的GC算法为一体,这些不同的算法是通过分代收集结合在一起的。当GC在Heap中检查每一个活动的对象时,分代收集利用大多数应用的几个属性来避免额外的工作。
这些属性中,最重要的是infant mortality(对象分配以后很快成为垃圾)。下图中蓝色区域显示了对象生命周期的典型分布。左边的峰值代表在分配之后能很快收集的对象。例如,重复对象(Iterator objects)在一个单循环期间,经常是活动的。

一些对象存活时间越长,就越向右进行分布。例如,典型的例子是,一些在初始化时就被分配并一直存活到程序退出的对象。在这两个极端之间的是一些在中间计算中所存活的对象,就是这里那个峰值右边的区域。尽管一些应用有不同的分布情况,但大多数应用都符合这个通用图形。通过关注大多数对象的infant mortality进行有效的收集是可能的。
为此,内存是分代管理的:内存池对不同代中的对象进行管理。GC是在每代中内存池满的时候进行的:如上图中竖线所示。对象分配在Eden中,那是多数初期对象变成垃圾的地方。当Eden 填满时,将会引起minor collection,在其中的存活的对象将会移动到older generation中。当older generation需要去收集的时候,那就是major collection,通常会比较慢。因为它包含了所有活动的对象。
这图显示了一个调整好的系统,在该系统中,大多数对象在第一次的垃圾收集前就销毁掉了。一个对象活动时间越长,经历GC的次数就越多,GC速度就越慢。通过让大多数对象存活不到一次收集就销毁,可使GC变得十分有效。但是这种令人满意的情况,在具有不寻常的生命周期分布的应用中或造成收集频繁的大小不合适的代中就会被破坏。
默认的GC参数对大多数小型应用都是有效的。对于许多服务器应用,它们并不是最佳参数。这就引出了这篇文档的主旨:
如果GC成为瓶颈,你可以定制代的大小。检查详细的GC输出,研究 GC 参数对性能的影响。
收集的类型:
每个分代有一个相关联的GC类型,这些类型的GC可以进行配置,产生不同的算法时间,空间,中止交易。在1.3中,JVM实现了三种不同的GC:
1, Copying(有时,称为清扫):这个收集者可以有效的在两个或多个分代中进行对象的移动。原分代变空,可以将遗留的销毁对象进行回收。然而,需要空间去操作,并拷贝所需的footprint。在 1.3.1 ,复制收集用于所有的minor collections.
2, Mark-compact:这个收集者允许分代在适当的时候进行分配,而不需要额外的内存。然后,这种紧凑的比复制方式,速度上要慢一些。在 1.3.1 中,紧凑标记的方式主要用于major collection.
3, Incremental:(有时称为序列)。只有在命令行中设置了 -Xincgc之后,这种收集方式才起作用。借助于详细的记录,递增式的GC一次只能收集older generation的一部分,在多次minor collections之后,才尝试进行major collections。然而,如果考虑所有的Throughput的话,这种方式比紧凑标记的速度还要慢。
因此,复制方式是最快的,在收集时尽量使用这种方式来收集对象。
默认情况下的分代排列如下图所示:
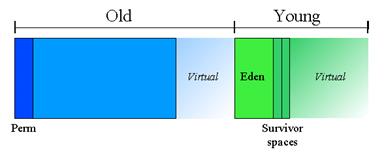
在进行初始化的时候,最大的地址空间只是事实上的设定,在实际需要的时候,才分配物理内存。全部的地址空间分成young generation和older generation。
young generation包括Eden和两个survivor spaces。对象最初分配在Eden中。其中保证一个送survivor spaces在任何时候都是空的,当垃圾收集发生时, Eden中的活的对象复制到survivor spaces,对象就在survivor spaces之间复制,直到到达最大门限值(老化),然后复制到older generation。
(其它的虚拟机,包括JVM 1.2版本 For Solaris,使用两个大小相等的空间来复制,而不是使用一个大的Eden加两个小空间)。这就是说定义young generation 参数,并不能直接可比较的。
older generation在合适的时候,使用Mark-compact方式进行收集。名为永久代选项比较特别,因为它保存包括JVM 自身的所有反映数据(reflective data),例如类以及方法。
性能指标
衡量GC性能有两个指标。Throughput是未消耗在垃圾收集的时间占总时间的百分比,Throughput包括花在分配上的时间(不需要调整分配的速度),停顿(Pauses)是应用因为垃圾收集而停止响应的时间。
用户对于垃圾收集有不同的需求,例如, 对于web服务器的主要尺度是Throughput,因为垃圾收集的停顿也许是不可容忍的,或者只是被网络延时所遮盖。 然而,对于交互式图形程序,短暂的延迟也会影响用户的体验。
一些用户对于其他一些考虑敏感,Footprint是处理的工作区,用页面和cache line 作为尺度测量.在有限的物理内存或许多处理器的系统上,footprint 可以显示伸缩性.Promptness是对象死亡和内存可用之间的时间.另一个对于分布时系统比较重要的考量标准是远程方法调用(RMI)。
一般来说,选择某个代大小时要平衡考虑各种考虑因素.例如,一个非常大的young generation也许会最大化throughput,但是以footprint,promptness为代价的。小的young generation和incremental collection可以使停顿时间的减少,但是以牺牲Throughput为代价的。
没有一种正确的方式去衡量代的大小:最好的选择是由应用使用用户需要的内存。因此,JVM 默认的GC可能并不是最好的,可以由用户使用命令去覆盖。
测量方法
Throughput和footprint是最好的标准,最好使用对于应用来说特定的手段测量。例如,一个web server的Throughput用一个客户端的来测试,同时在Solaris操作系统上,服务器的footprint可以用pmap命令来衡量。换句话说,由于GC而停顿,很容易由于JVM自己的诊断输出来得到。
命令行的参数: -verbose:gc 显示了每次收集时的打印的信息。例如,这里时从大型的服务器应用中输出结果:
[GC 325407K->83000K(776768K), 0.2300771 secs]
[GC 325816K->83372K(776768K), 0.2454258 secs]
[Full GC 267628K->83769K(776768K), 1.8479984 secs]
上面,我们看到两个minor collections和一个major collections。箭头前后的数字显示了GC前后活动对象合并大小。(在minor collections之后,这数目包括不再需要存活的对象,但是不能被回收,因为它们是活动的,或因为在older generration中还被引用)。括号里的数目是总共可获取的空间大小,它是堆的总的大小减去一个survivor spaces。
确定代的大小
很多的参数都会影响分代的大小。下面的这副图举例说明了调整JVM 1.3.1 最重要的一点。许多参数实际用比率来表示x:y, 分别用黑色部分(用x来表示),灰色部分(用y来表示)来显示。

总堆
当代满的时候,收集就发生了,throughput与可用内存的数量成反比,总可用内存是影响垃圾收集性能最重要的因素。
默认情况下,JVM在每次收集之后,增长或减少堆,来保持可用的内存和活动对象的比例。通过参数-XX:MinHeapFreeRatio=<minimum> 和 -XX:MaxHeapFreeRatio=<maximum>,这个范围被设定为一个百分率,总大小在-Xms 和 -Xmx 之间。
在Solaris上的默认参数,显示如下:
| -XX:MinFreeHeapRatio= | 40 |
| -XX:MaxHeapFreeRatio= | 70 |
| -Xms | 3584k |
| -Xmx | 64m |
大型的服务器应用经常经历两个问题。一个是启动很慢,因为初始化的堆很小,必须通过多次的major collectiosns 后调整大小。更严重的问题是默认的maximum 堆大小是对于大多数的服务器应用是不合适的。
服务器应用的设置规则是:
除非有停顿问题,否则尽量设置JVM更多的内存。默认情况下, 64M 太小了。设置-xms 和-xmx值一样大。换句话说,如果你做不好的决定,JVM是不会做补偿的。
确定去提高内存,正像你提高线程数一样,尽管收集不能平放,但是GC是不平放。
尽管GC不是并行的,但分配内存可以并行,所以在增加处理器的时候确保增加内存。
年轻代
第二个最有影响的问题是堆和年轻代。young generation越大,minor collections将会经常发生。然而,对于一个有限的堆大小,older generation越小,越会增加major collections的执行的次数。最佳的选择是由分布式应用的生命周期所决定。
默认情况下,年轻代是由NewRatio参数所决定的。例如,设置 –XX:NewRatio=3 意识是young generation和older generation的比例是1:3。换句话说,Eden的和survivor spaces组合大小是整个堆的1/4
参数NewSize和MaxNewSize设置年轻代的最小和最大值。设置这两个值相等,就固定了young generation,正像设置-xms ,-xmx相等,就固定了整个堆的大小一样。
因为young generation使用复制收集,在old generation中必须有足够大的内存大小,才能保证minor collections进行。在最坏的情况下,这个值等于Eden的大小加上非空的survivor spaces的大小。如果在old generation中没有足够的内存,major collections将会发生。对于一些小应用,这种规则是很好的,因为在old generation保留的内存具有代表性,只是虚拟上的使用,而不是实际使用。但是对于需要更大堆的应用,超过虚拟堆大小一半的Eden是没有用的:只有major collections会发生。
如果需要,参数SurvivorRatio被用来调整survivor spaces,但是对于性能这是不重要的。例如,设置 =6设置每个survivor spaces和Eden的比例是1:6;换句话说,每个survivor spaces将是young generations的1/8。(不是1/7,因为有两个survivor spaces)
如果survivor spaces太小,拷贝收集直接溢出到olde generation,如果幸存空间太大,它们将无用地空着。 每一次垃圾收集,虚拟机选择一个起始数量次数被拷贝的对象在其被以前。这个被选择的开始保持survivor spaces半空。选项XX:+PrintTenuringDistribution被用来显示这个起始,和new generation中对象的年龄。它也可以用来发现应用的对象生命分布。
这儿是Solaris操作系统上默认值:
| NewRatio | 2 (client JVM: 8) |
| NewSize | 2172k |
| MaxNewSize | 32m |
| SurvivorRatio | 25 |
那么,服务器应用规则如下:
首先决定可以提供给虚拟机的总内存,然后根据young generation的大小绘制你自己的性能曲线,找到最好的设置。
除非有停顿问题,否则尽量设置JVM更多的内存。默认情况下, 64M 太小了。
达到总堆大小的一半或少些时,增加 young generation 并不提高性能。
增加处理器的数量时,请确保增加 young generation ,因为分配可以并行。
其它的事项
对于大多数应用,permanent generation与垃圾收集器的性能无关,然而一些应用动态产生和装载许多类.如JSP页面.如有必要,用MaxPermSize增加permanent generation的大小。
一些应用通过finalization和weak/soft/phantom引用于垃圾收集器交互.这些特性在java语言界别创建性能artifacts.例子之一是依靠finalization关闭文件句柄,依赖垃圾收集管理资源(除内存外)不是好的主意。
另一些应用直接调用full垃圾收集,比如System.gc().此方法调用强制执行major收集,制约了大系统的伸缩性.外部垃圾收集对性能的影响可以通过参数 -XX:+DisableExplicitGC来测量。
最常用得显式垃圾收集时RMI分布式垃圾收集(DGC),应用使用RMI引用其他虚拟机的对象,在这些分布式应用中垃圾不能被本地所收集.所以 RMI强制执行周期性的full收集.频率可由属性控制:
java -Dsun.rmi.dgc.client.gcInterval=3600000
-Dsun.rmi.dgc.server.gcInterval=3600000 ……
指定了每小时收集一次,而不是默认的每分钟收集一次.然而,此办法也引起一些对象花费太长时间被回收。如果对于DGC 行为没有上限值的时候,可以将该属性值设置成和Long.MAX_VALUE一样大来确定显性收集的时间。
在Solaris 8 操作系统上支持可变版本的libthread,它直接和LWPs进行绑定。这就保护了最终线程。 为了达到这个目的,在启动JVM时,就需要设置LD_LIBRARY_PATH,指向/usr/lib/lwp。
相对于JVM client,Server 端软引用清除不具有攻势。通过增大这个参数值设置:-XX:SoftRefLRUPolicyMSPerMB=10000 来使清除速度变慢。默认值是1000,即1S/ 1M 。
结论
GC在高并发性的系统中将成为瓶颈。通过理解GC的工作原理,使用合适的命令参数,是能减少影响的。
大型的服务器需要更大的硬件设备。对于这些系统来讲,JVM 1.4提供包括 64 bit 寻址能力,更大的代大小及并发收集等办法,来减少marjor collectiions所引起的暂停的影响。
附SUN 原文:
Tuning Garbage Collection
with the
1.3.1
Java Virtual Machine
Introduction
The Java 2 Platform is increasingly used for large server applications such as web services. These applications demand scalability, and directly benefit from large numbers of threads, processors, sockets and memory. Yet 'big iron' performance has a reputation as an art form, requiring special expertise beyond what is needed for performance on smaller systems. Fortunately, the Java Virtual Machine (JVM)* and Solaris operating environment provide effective implementations of threads, I/O and memory management. This document addresses a common speed bump on the road to scalable high performance: poorly tuned garbage collection (GC).
Amdahl observed that most workloads cannot be perfectly parallelized; some portion is always sequential and does not benefit from parallelism. This is also true for the Java 2 Platform. In particular, JVMs up to and including version
1.3.1
do not have parallel garbage collection, so the impact of GC on a multiprocessor system grows relative to an otherwise parallel application.
The graph below models an ideal system that is perfectly scalable with the exception of GC. The top line (red) is an application spending only 1% of the time in GC on a uniprocessor; this translates into more than 20% loss in throughput at 32 processors. At 10%, not considered an outrageous amount of time in GC in uniprocessor applications, more than 75% of throughput is lost when scaling up.
This demonstrates that issues that appear lost in the noise when developing on small systems may become principal bottlenecks when scaling up. The silver lining is that small improvements in such a bottleneck can produce large gains in performance. For a sufficiently large system it becomes well worthwhile to tune garbage collection.
This document is written from the perspective of
1.3.1
JVM on the Solaris (SPARC Platform Edition) operating environment, because that platform provides the most scalable hardware/software Java 2 platform today. However, the descriptive text applies to other supported platforms, including Linux, Microsoft Windows, and the Solaris (Intel Architecture) operating environment, to the extent that scalable hardware is available. Although command line options are consistent across platforms, some platforms may have different defaults than described here.
Generations
One of Java 2 Platform's great strengths is that it shields the substantial complexity of memory allocation and garbage collection from the developer. However, once GC has become the principal bottleneck, it becomes worth understanding aspects of this hidden implementation. Garbage collectors make assumptions about the way applications use objects, and these are reflected in tunable parameters that can be adjusted for improved performance without sacrificing the power of the abstraction.
An object is garbage when it can no longer be reached from any pointer in the running program. The most straightforward garbage collection algorithms simply iterate over every reachable object; any objects left over are then known to be garbage. This approach takes time proportional to the number of living objects, which is prohibitive for large applications maintaining lots of living data.
The 1.3 JVM incorporates a number of different garbage collection algorithms that are combined using generational collection. While naive garbage collection examines every living object in the heap, generational collection exploits several empirically observed properties of most applications to avoid extra work.
The most important of these properties is infant mortality. The blue area in the diagram below is a typical distribution for the lifetimes of objects. The sharp peak at the left represents objects that can be reclaimed shortly after being allocated. Iterator objects, for example, are often alive for the duration of a single loop.
Some objects do live longer, and so the distribution stretches out to the the right. For instance, there are typically some objects allocated at initialization that live until the process exits. Between these two extremes are objects that live for the duration of some intermediate computation, seen here as the lump to the right of the infant mortality peak. Some applications have very different looking distributions, but a surprisingly large number possess this general shape. Efficient collection is made possible by focusing on the fact that a majority of objects die young.
To do this, memory is managed in generations: memory pools holding objects of different ages. Garbage collection occurs in each generation when it fills up; these collections are represented on the diagram above with vertical bars. Objects are allocated in
eden
, and because of infant mortality most objects die there. When
Eden
fills up it causes a minor collection, in which some surviving objects are moved to an older generation. When older generations need to be collected there is a major collection that is often much slower because it involves all living objects.
The diagram shows a well-tuned system in which most objects die before they survive to the first garbage collection. The longer an object survives, the more collections it will endure and the slower GC becomes. By arranging for most objects to survive less than one collection, garbage collection can be very efficient. This happy situation can be upset by applications with unusual lifetime distributions, or by poorly sized generations that cause collections to be too frequent.
The default garbage collection parameters were designed to be effective for most small applications. They aren't optimal for many server applications. This leads to the central tenet of this document:
| If GC has become a bottleneck, you may wish to customize the generation sizes. Check the verbose GC output, and then explore the sensitivity of your individual performance metric to the GC parameters. |
Types of collection
Each generation has an associated type of garbage collection that can be configured to make different algorithmic time, space and pause tradeoffs. In 1.3, the JVM implements three very different garbage collectors:
- Copying (sometimes called scavenge): this collector very efficiently moves objects between two or more generations. The source generations are left empty, allowing remaining dead objects to be reclaimed quickly. However, since it requires empty space to operate, copying requires more footprint. In 1.3.1 copying collection is used for all minor collections.
- Mark-compact: this collector allows generations to be collected in place without reserving extra memory; however, compaction is significantly slower than copying. In 1.3.1 mark-compact is used for major collections.
- Incremental (sometimes called train): this collector is used only if -Xincgc is passed on the command line. By careful bookkeeping, incremental GC collects just a portion of the old generation at a time, trying to spread the large pause of a major collection over many minor collections. However, it is even slower than mark-compact when considering overall throughput. Since copying is very fast, a tuning goal is to collect as many objects as possible by copying rather than by compaction or incremental collection.
The default arrangement of generations looks something like this.
At initialization, a maximum address space is virtually reserved but not allocated physical memory unless it is needed. The complete address space reserved for object memory can be divided into the young and old generations.
The young generation consists of
eden
plus two survivor spaces . Objects are initially allocated in
eden
. One survivor space is empty at any time, and serves as the destination of the next copying collection of any living objects in
eden
and the other survivor space. Objects are copied between survivor spaces in this way until they age enough to be tenured (copied to the old generation.)
(Other virtual machines, including the production JVM version 1.2 for the Solaris operating environment, used two equally sized spaces for copying rather than one large
eden
plus two small spaces. This means the options for sizing the young generation are not directly comparable; see the Performance FAQ for an example.)
The old generation is collected in place by mark-compact. One portion called the permanent generation is special because it holds all the reflective data of the JVM itself, such as class and method objects.
Performance considerations
There are two primary measures of garbage collection performance. Throughput is the percentage of total time not spent in garbage collection, considered over long periods of time. Throughput includes time spent in allocation (but tuning for speed of allocation is generally not needed.) Pauses are the times when an application appears unresponsive because garbage collection is going on.
Users have different requirements of garbage collection. For example, some consider the right metric for a web server to be throughput, since pauses during garbage collection may be tolerable, or simply obscured by network latencies. But for an interactive graphical program, even short pauses may upset the user experience.
Some users are sensitive to other considerations. Footprint is the working set of a process, measured in pages and cache lines. On systems with limited physical memory or many processes, footprint may dictate scalability. Promptness is the time between when an object becomes dead and when the memory becomes available, an important consideration for distributed systems including RMI.
In general, a particular generation sizing chooses a trade-off between these considerations. For example, a very large young generation may maximize throughput, but does so at the expense of footprint and promptness. Pauses can be minimized by using a small young generation and incremental collection, at the expense of throughput.
There is no one right way to size generations; the best choice is determined by the way the application uses memory as well as user requirements. For this reason the JVM's default GC choices may not be optimal, and may be overridden by the user in the form of command line options below.
Measurement
Throughput and footprint are best measured using metrics particular to the application. For example, throughput of a web server may be tested using a client load generator, while footprint of the server might be measured on the Solaris operating environment using the pmap command. On the other hand, pauses due to GC are easily estimated by inspecting the diagnostic output of the JVM itself.
The command line argument -verbose:gc prints information at every collection. For example, here is output from a large server application:
[GC 325407K->83000K(776768K), 0.2300771 secs]
[GC 325816K->83372K(776768K), 0.2454258 secs]
[Full GC 267628K->83769K(776768K), 1.8479984 secs]
Here we see two minor collections and one major one. The numbers before and after the arrow indicate the combined size of live objects before and after the GC. (After minor collections the count includes objects that aren't necessarily alive but can't be reclaimed, either because they are directly alive, or because they are within or referenced from the old generation.) The number in parenthesis is the total available space, which is the total heap minus one of the survivor spaces.
Sizing the generations
A number of parameters affect generation size. This diagram illustrates the ones most important to tuning the 1.3.1 JVM. Many parameters are actually ratios x:y, and these are depicted with black (representing x) and grey (representing y) size bars:
Total heap
Since collections occur when generations fill up, throughput is inversely proprotional to the amount of memory available. Total available memory is the most important knob affecting GC performance.
By default, the JVM grows or shrinks the heap at each collection to try to keep the proportion of free space to living objects at each collection within a specific range. This target range is set as a percentage by the parameters -XX:MinHeapFreeRatio=<minimum> and -XX:MaxHeapFreeRatio=<maximum>, and the total size is bounded below by -Xms and above by -Xmx . The default parameters for the Solaris (SPARC Platform Edition) operating environment are shown in this table:
| -XX:MinFreeHeapRatio= | 40 |
| -XX:MaxHeapFreeRatio= | 70 |
| -Xms | 3584k |
| -Xmx | 64m |
Large server apps often experience two problems with these defaults. One is slow startup, because the initial heap is small and must be resized over many major collections. A more pressing problem is that the default maximum heap size is unreasonably small for most server applications. The rules of thumb for server applications are:
| Unless you have problems with pauses, try granting as much memory as possible to the JVM. The default size (64MB) is often too small. |
The young generation
The second most influential knob is the proportion of the heap dedicated to the young generation. The bigger the young generation, the less often minor collections occur. However, for a bounded heap size a larger young generation implies a smaller old generation, which will increase the frequency of major collections. The optimal choice depends on the lifetime distribution of the application.
By default, the young generation size is controlled by NewRatio. For example, setting -XX:NewRatio=3 means that the ratio between the young and old generation is 1:3; in other words, the combined size of eden and the survivor spaces will be one fourth of the heap.
The parameters NewSize and MaxNewSize bound the young generation size below and above. Setting these equal to one another fixes the young generation, just as setting -Xms and -Xmx equal fixes the total heap size. This is useful for tuning the young generation at a finer granularity than the integral multiples allowed by NewRatio.
Because the young generation uses copying collection, enough free memory must be reserved in the old generation to ensure that a minor collection can complete. In the worst case, this reserved memory is equal to the size of
eden
plus the objects in non-empty survivor space. When there isn't enough memory available in the old generation for this worst case, a major collection will occur instead. This policy is fine for small applications, because the memory reserved in the old generation is typically only virtually committed but not actually used. But for applications needing the largest possible heap, an
eden
bigger than half the virtually committed size of the heap is useless: only major collections would occur.
If desired, the parameter SurvivorRatio can be used to tune the size of the survivor spaces, but this is often not as important to performance. For example, -XX:SurvivorRatio=6 sets the ratio between each survivor space and
eden
to be 1:6; in other words, each survivor space will be one eighth of the young generation (not one seventh, because there are two survivor spaces).
If survivor spaces are too small, copying collection overflows directly into the old generation. If survivor spaces are too large, they will be uselessly empty. At each garbage collection the JVM chooses a threshold number of times an object can be copied before it is tenured. This threshold is chosen to keep the survivors half full. (For the intrepid,
a 1.3.1
option -XX:+PrintTenuringDistribution can be used to show this threshold and the ages of objects in the new generation. It is also useful for observing the lifetime distribution of an application.)
Here are the default values for the Solaris (SPARC Platform Edition) operating environment:
| NewRatio | 2 (client JVM: 8) |
| NewSize | 2172k |
| MaxNewSize | 32m |
| SurvivorRatio | 25 |
The rules of thumb for server applications are:
| First decide the total amount of memory you can afford to give the JVM. Then graph your own performance metric against young generation sizes to find the best setting. |
Other considerations
For most applications the permanent generation is not relevant to GC performance. However, some applications dynamically generate and load many classes. For instance, some implementations of JSPs do this. If necessary, the maximum permanent generation size can be increased with MaxPermSize.
Some applications interact with garbage collection by using finalization and weak/soft/phantom references. These features can create performance artifacts at a Java-programming-language level; an example is relying on finalization to close file descriptors, which makes an external resource (descriptors) dependent on GC promptness. Relying on GC to manage resources other than memory is almost always a bad idea.
Another way apps can interact with garbage collection is by invoking GCs explicitly, such as through the System.gc() call. These calls force major collection, and inhibit scalability on large systems. The performance impact of explicit GCs can be measured using the unsupported flag -XX:+DisableExplicitGC.
One of the most commonly encountered uses of explicit GC occurs with RMI's distributed garbage collection (DGC). Applications using RMI refer to objects in other JVMs. Garbage can't be collected in these distributed applications without occasional local collection, so RMI forces periodic full collection. The frequency of these collections can be controlled with properties. For example,
java -Dsun.rmi.dgc.client.gcInterval=3600000
-Dsun.rmi.dgc.server.gcInterval=3600000 ...
specifies explicit collection once per hour instead of the default rate of once per minute. However, this may also cause some objects to take much longer to be reclaimed. These properties can be set as high as Long.MAX_VALUE to make the time between explicit collections effectively infinite, if there is no desire for an upper bound on the timeliness of DGC activity.
The Solaris 8 operating environment supports an alternate version of libthread that binds threads to LWPs directly; this may help avoid starvation of the finalization thread. To try this, set the environment variable LD_LIBRARY_PATH to include /usr/lib/lwp before launching the JVM.
Soft references are cleared less aggressively in the server JVM than the client. The rate of clearing can be slowed by increasing a parameter in this way: -XX:SoftRefLRUPolicyMSPerMB=10000. The default is value 1000, or one second per megabyte.
For large dedicated systems, there are other special options available to boost performance.
Conclusion
Garbage collection can become a bottleneck in highly parallel systems. By understanding how GC works, it is possible to use a variety of command line options to minimize that impact.
The demands of large servers are being met with larger hardware configurations that ever before. For these systems, the 1.4 line of JVMs will provide additional solutions, including a 64 bit address space for even larger generations and concurrent collection to hide the pauses associated with major collection.


 122
122


 被折叠的 条评论
为什么被折叠?
被折叠的 条评论
为什么被折叠?
 到【灌水乐园】发言


