VUE代码如下
<template>
<div id="map" ref="rootmap">
<div style="position: absolute;z-index: 9999; background: ghostwhite;display: flex;">
<div>Geometry type </div>
<select v-model="typeSelected" @change="getTypeSelected">
<option value="Point">Point</option>
<option value="LineString">LineString</option>
<option value="Polygon">Polygon</option>
<option value="Circle">Circle</option>
<option value="None">None</option>
</select>
</div>
</div>
</template>
<script>
import "ol/ol.css";
import { Map, View } from "ol";
import TileLayer from "ol/layer/Tile";
import VectorLayer from "ol/layer/Vector"
import {OSM, TileWMS,Vector} from "ol/source";
import GeoJSON from "ol/format/GeoJSON";
import {Style,Stroke} from "ol/style";
import Draw from "ol/interaction/Draw";
export default {
data() {
return {
typeSelected:'LineString',
drawLayer:null,
draw:null,
map: null
};
},
mounted() {
let osmLayer = new TileLayer({
source: new OSM()
});
this.map = new Map({
target: "map",
layers: [
osmLayer
],
view: new View({
projection: "EPSG:4326",
center: [114.064839, 22.548857],
zoom: 12
})
});
this.drawLayer = new VectorLayer({
source: new Vector(),
})
this.map.addLayer(this.drawLayer);
},
methods:{
getTypeSelected(){
this.draw && this.map.removeInteraction(this.draw);
this.addInteraction();
},
addInteraction() {
let value = this.typeSelected;
if (value !== 'None') {
this.draw = new Draw({
source: this.drawLayer.getSource(),
type: this.typeSelected,
style: new Style({
stroke: new Stroke({
color: 'blue',
width: 3
})
})
});
this.map.addInteraction(this.draw);
}
}
}
};
</script>
<style>
#map{height:100%;}
.ol-attribution,.ol-zoom { display: none;}
</style>
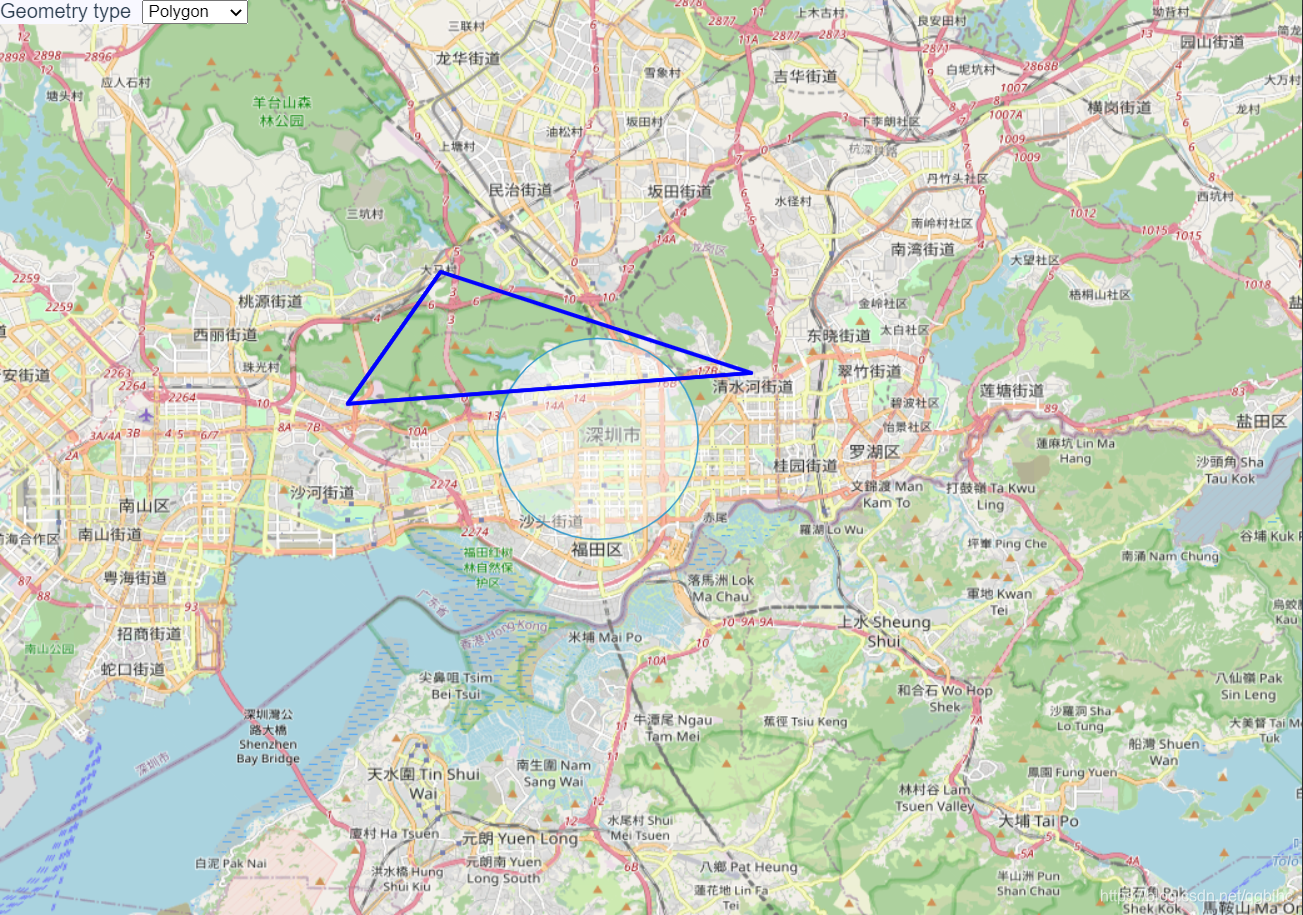
效果如下
关键代码
- 创建openlayers地图,使用OpenStreetMap的开放地图数据。
     let osmLayer = new TileLayer({
         source: new OSM()
     });
     this.map = new Map({
         target: "map",
         layers: [
             osmLayer,
         ],
         view: new View({
             projection: "EPSG:4326",    //使用这个坐标系
             center: [114.064839, 22.548857],  //深圳
             zoom: 12
         })
     });
- 添加一个绘制使用的layer,并添加到地图中
      // 添加一个绘制的线使用的layer
      this.drawLayer = new VectorLayer({
          //layer所对应的source
          source: new Vector(),

      })
      //把layer加入到地图中
      this.map.addLayer(this.drawLayer);
- 根据选择类型,进行地图交互
     addInteraction() {
         let value = this.typeSelected;
         if (value !== 'None') {
             this.draw = new Draw({
                 source: this.drawLayer.getSource(),
                 type: this.typeSelected,
                 style: new Style({
                     stroke: new Stroke({
                         color: 'blue',
                         width: 3
                     })
                 })
             });
             this.map.addInteraction(this.draw);
         }
     }
- 下拉框值的变化,修改地图交互
     getTypeSelected() {
         this.draw && this.map.removeInteraction(this.draw);
         //再根据typeSelect的值绘制新的Interaction
         this.addInteraction();
     },


 2948
2948

 被折叠的 条评论
为什么被折叠?
被折叠的 条评论
为什么被折叠?
 到【灌水乐园】发言


