


--准备测试环境数据(实验环境为MySQL 8.0.18社区版)
mysql> create table kkk(id int , name varchar(12));
Query OK, 0 rows affected (0.34 sec)

mysql> insert into kkk values(1, 'kerry');
Query OK, 1 row affected (0.01 sec)

mysql> insert into kkk values(2, 'jerry');
Query OK, 1 row affected (0.00 sec)

mysql> insert into kkk values(3, 'ken');
Query OK, 1 row affected (0.00 sec)

mysql>

mysql> create table t(a   varchar(10));
Query OK, 0 rows affected (0.47 sec)

mysql> insert into t values('test');
Query OK, 1 row affected (0.00 sec)
在一个会话窗口(连接ID=38)执行下面SQL
mysql> select connection_id() from dual;
+-----------------+
| connection_id() |
+-----------------+
|              38 |
+-----------------+
1 row in set (0.00 sec)

mysql> set session autocommit=0;
Query OK, 0 rows affected (0.00 sec)

mysql>  delete from kkk where id =1;
Query OK, 1 row affected (0.00 sec)

mysql>
在另外一个会话窗口(连接ID=39)执行下面SQL
mysql> SELECT t.trx_mysql_thread_id
    ->   ,t.trx_id
    ->       ,t.trx_state
    ->       ,t.trx_tables_in_use
    ->       ,t.trx_tables_locked
    ->       ,t.trx_query
    ->       ,t.trx_rows_locked
    ->       ,t.trx_rows_modified
    ->       ,t.trx_lock_structs
    ->       ,t.trx_started
    ->       ,t.trx_isolation_level
    ->       ,p.time
    ->       ,p.user
    ->       ,p.host
    ->       ,p.db
    ->       ,p.command
    -> FROM   information_schema.innodb_trx t
    ->        INNER JOIN information_schema.processlist p
    ->                ON t.trx_mysql_thread_id = p.id
    -> WHERE  t.trx_state = 'RUNNING'
    ->        AND p.time > 4
    ->        AND p.command = 'Sleep'\G
*************************** 1. row ***************************
trx_mysql_thread_id: 38
             trx_id: 7981581
          trx_state: RUNNING
  trx_tables_in_use: 0
  trx_tables_locked: 1
          trx_query: NULL
    trx_rows_locked: 4
  trx_rows_modified: 1
   trx_lock_structs: 2
        trx_started: 2020-12-03 15:39:37
trx_isolation_level: REPEATABLE READ
               time: 23
               user: root
               host: localhost
                 db: MyDB
            command: Sleep
1 row in set (0.00 sec)
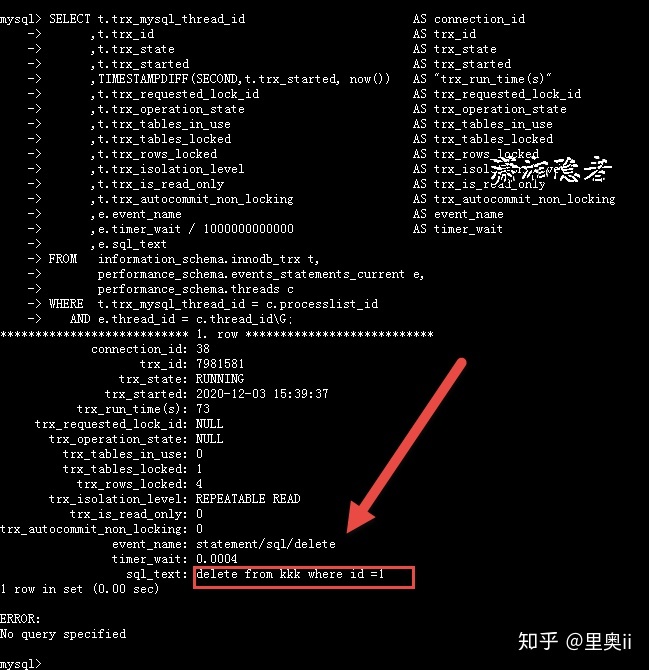
虽然上面这个SQL找不出事务执行过的SQL,其实呢,MySQL中未提交事务的最后执行的一个SQL是可以通过下面脚本准确查找出来的。如下所示:
SELECT t.trx_mysql_thread_id                        AS connection_id
      ,t.trx_id                                     AS trx_id
      ,t.trx_state                                  AS trx_state
      ,t.trx_started                                AS trx_started
      ,TIMESTAMPDIFF(SECOND,t.trx_started, now())   AS "trx_run_time(s)"
      ,t.trx_requested_lock_id                      AS trx_requested_lock_id
      ,t.trx_operation_state                        AS trx_operation_state
      ,t.trx_tables_in_use                          AS trx_tables_in_use
      ,t.trx_tables_locked                          AS trx_tables_locked
      ,t.trx_rows_locked                            AS trx_rows_locked
      ,t.trx_isolation_level                        AS trx_isolation_level
      ,t.trx_is_read_only                           AS trx_is_read_only
      ,t.trx_autocommit_non_locking                 AS trx_autocommit_non_locking
      ,e.event_name                                 AS event_name
      ,e.timer_wait / 1000000000000                 AS timer_wait
      ,e.sql_text
FROM   information_schema.innodb_trx t,
       performance_schema.events_statements_current e,
       performance_schema.threads c
WHERE  t.trx_mysql_thread_id = c.processlist_id
   AND e.thread_id = c.thread_id\G;
如下截图所示:
在会话窗口(连接ID=38)继续执行下面SQL:"select * from t;"。 如下所示
mysql> set session autocommit=0;
Query OK, 0 rows affected (0.01 sec)

mysql> delete from kkk where id =1;
Query OK, 1 row affected (0.00 sec)

mysql> select * from t;
+------+
| a    |
+------+
| test |
+------+
1 row in set (0.00 sec)

mysql>
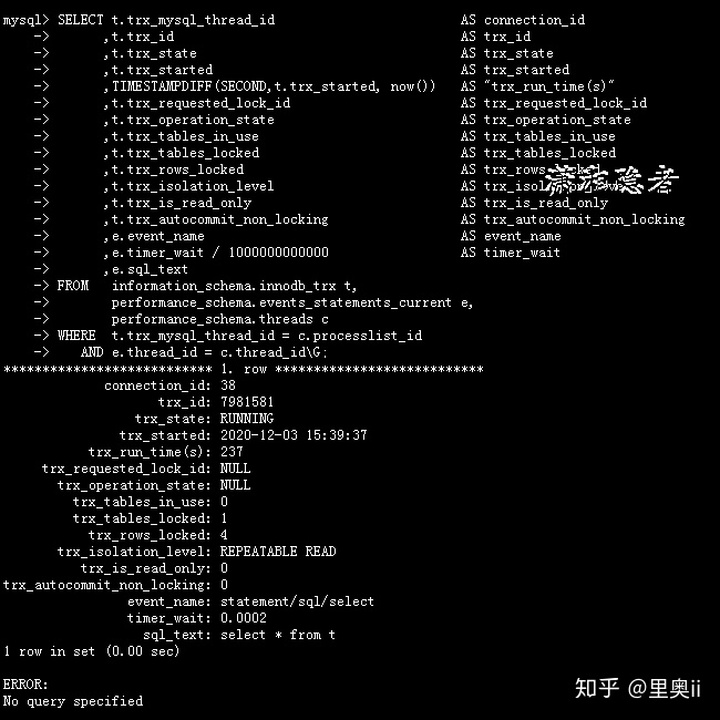
在会话窗口(连接ID=39)上继续执行下面SQL,你会发现捕获的是事务最后执行的SQL语句“select * from t”
mysql> SELECT t.trx_mysql_thread_id                        AS connection_id
    ->       ,t.trx_id                                     AS trx_id
    ->       ,t.trx_state                                  AS trx_state
    ->       ,t.trx_started                                AS trx_started
    ->       ,TIMESTAMPDIFF(SECOND,t.trx_started, now())   AS "trx_run_time(s)"
    ->       ,t.trx_requested_lock_id                      AS trx_requested_lock_id
    ->       ,t.trx_operation_state                        AS trx_operation_state
    ->       ,t.trx_tables_in_use                          AS trx_tables_in_use
    ->       ,t.trx_tables_locked                          AS trx_tables_locked
    ->       ,t.trx_rows_locked                            AS trx_rows_locked
    ->       ,t.trx_isolation_level                        AS trx_isolation_level
    ->       ,t.trx_is_read_only                           AS trx_is_read_only
    ->       ,t.trx_autocommit_non_locking                 AS trx_autocommit_non_locking
    ->       ,e.event_name                                 AS event_name
    ->       ,e.timer_wait / 1000000000000                 AS timer_wait
    ->       ,e.sql_text
    -> FROM   information_schema.innodb_trx t,
    ->        performance_schema.events_statements_current e,
    ->        performance_schema.threads c
    -> WHERE  t.trx_mysql_thread_id = c.processlist_id
    ->    AND e.thread_id = c.thread_id\G;
*************************** 1. row ***************************
             connection_id: 38
                    trx_id: 7981581
                 trx_state: RUNNING
               trx_started: 2020-12-03 15:39:37
           trx_run_time(s): 237
     trx_requested_lock_id: NULL
       trx_operation_state: NULL
         trx_tables_in_use: 0
         trx_tables_locked: 1
           trx_rows_locked: 4
       trx_isolation_level: REPEATABLE READ
          trx_is_read_only: 0
trx_autocommit_non_locking: 0
                event_name: statement/sql/select
                timer_wait: 0.0002
                  sql_text: select * from t
1 row in set (0.00 sec)

ERROR:
No query specified
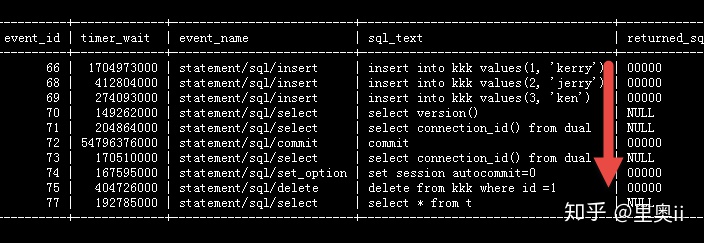
也是说上面SQL只能获取未提交事务最后执行的一个SQL语句,生产环境中,一个事务中往往不止一个SQL语句,而是多个SQL语句的集合。如果想将一个未提交事务里面所有执行过的SQL找出来怎么办呢? 其实在MySQL中还是有办法的。下面SQL语句就可以找出
SELECT ps.id
      ,trx.trx_id
      ,trx_started
      ,trx_state
      ,trx_isolation_level
      ,esh.event_id
      ,esh.timer_wait
      ,esh.event_name
      ,esh.sql_text
      ,esh.returned_sqlstate
      ,esh.mysql_errno
      ,esh.message_text
      ,esh.errors
      ,esh.warnings
FROM   information_schema.innodb_trx trx
       JOIN information_schema.processlist ps
         ON trx.trx_mysql_thread_id = ps.id
       LEFT JOIN performance_schema.threads th
              ON th.processlist_id = trx.trx_mysql_thread_id
       LEFT JOIN performance_schema.events_statements_history esh
              ON esh.thread_id = th.thread_id
WHERE  trx.trx_started < current_time - INTERVAL 2 second
   AND ps.user != 'SYSTEM_USER'
ORDER  BY esh.event_id;
或者
SELECT trx.trx_mysql_thread_id AS processlist_id
      ,sc.thread_id
      ,trx.trx_started
      ,TO_SECONDS(now())-TO_SECONDS(trx_started) AS trx_last_time
      ,pc1.user
      ,pc1.host
      ,pc1.db
      ,sc.SQL_TEXT AS current_sql_text
      ,sh.history_sql_test
FROM INFORMATION_SCHEMA.INNODB_TRX trx
INNER JOIN INFORMATION_SCHEMA.processlist pc1 ON trx.trx_mysql_thread_id=pc1.id
INNER JOIN performance_schema.threads th on th.processlist_id = trx.trx_mysql_thread_id
INNER JOIN performance_schema.events_statements_current sc ON sc.THREAD_ID = th.THREAD_ID
INNER JOIN (
                SELECT thread_id AS thread_id, GROUP_CONCAT(SQL_TEXT SEPARATOR ';') AS history_sql_test
                FROM performance_schema.events_statements_history
                GROUP BY thread_id
                ) sh ON sh.thread_id = th.thread_id
WHERE trx_mysql_thread_id != connection_id()
  AND TO_SECONDS(now())-TO_SECONDS(trx_started) >= 0 ;
但是这两个SQL有个问题:它会找出当前连接历史上所有执行过的SQL(当然前提是这些SQL还保存在performance_schema.events_statements_history表中),也就是说这个SQL,不仅查询出未提交事务所有执行过的脚本,而且会查询出很多历史SQL脚本,例如,这个会话(连接)之前事务的SQL语句,而且还有一个比较头疼的问题:这里不好区分哪些SQL对应哪些事务。需要借助其他信息来甄别。比较费时费力。如下截图所示。
因为只有information_schema.innodb_trx系统表中包含事务的开始时间(trx_started),其它系统表没有跟事务相关的时间,只能借助performance_schema.events_statements_history中的TIMER_START字段来获取事件的SQL开始执行的时间,而这个时间必然是小于或等于对应事务的开始时间(trx_started)的。所以从这个突破口来找出未提交事务的所有SQL,下面是关于TIMER_START等字段的详细介绍。
关于TIMER_START,TIMER_END,TIMER_WAIT的介绍如下:
TIMER_START,TIMER_END,TIMER_WAIT:事件的时间信息。这些值的单位是皮秒(万亿分之一秒)。 TIMER_START和TIMER_END值表示事件的开始时间和结束时间。 TIMER_WAIT是事件执行消耗的时间(持续时间) 如果事件未执行完成,则TIMER_END为当前时间,TIMER_WAIT为当前为止所经过的时间(TIMER_END - TIMER_START)。 如果监视仪器配置表setup_instruments中对应的监视器TIMED字段被设置为 NO,则不会收集该监视器的时间信息,那么对于该事件采集的信息记录中,TIMER_START,TIMER_END和TIMER_WAIT字段值均为NULL
测试、折腾了好久,终于搞出了一个几乎完美的SQL:
SELECT @dt_ts:=UNIX_TIMESTAMP(NOW());
SELECT
     @dt_timer:=MAX(sh.TIMER_START)
FROM performance_schema.threads AS t
INNER JOIN performance_schema.events_statements_history AS sh
ON t.`THREAD_ID`=sh.`THREAD_ID`
WHERE t.PROCESSLIST_ID=CONNECTION_ID();


SELECT sh.current_schema   AS database_name
   ,t.thread_id
   ,it.trx_mysql_thread_id         AS connection_id
   ,it.trx_id
   ,sh.event_id
   ,it.trx_state
   ,REPLACE(REPLACE(REPLACE(sh.`SQL_TEXT`,'\n',' '),'\r',' '),'\t',' ') AS executed_sql
   ,it.trx_started
   ,FROM_UNIXTIME(@dt_ts-CAST((@dt_timer-sh.TIMER_START)/1000000000000  AS SIGNED)) AS start_time
   ,FROM_UNIXTIME(@dt_ts-CAST((@dt_timer-sh.TIMER_END)  /1000000000000  AS SIGNED)) AS end_time
   ,(sh.TIMER_END-sh.TIMER_START)/1000000000000 AS used_seconds
   ,sh.TIMER_WAIT/1000000000000 AS wait_seconds
   ,sh.LOCK_TIME/1000000000000 AS lock_seconds
   ,sh.ROWS_AFFECTED AS affected_rows
   ,sh.ROWS_SENT AS send_rows
FROM performance_schema.threads AS t
INNER JOIN information_schema.innodb_trx it ON  it.trx_mysql_thread_id = t.processlist_id
INNER JOIN performance_schema.events_statements_history AS sh
        ON t.`THREAD_ID`=sh.`THREAD_ID`
WHERE t.PROCESSLIST_ID IN (
                SELECT
                      p.ID AS conn_id
                FROM `information_schema`.`INNODB_TRX` t
                INNER JOIN `information_schema`.`PROCESSLIST` p
                        ON t.trx_mysql_thread_id=p.id
                WHERE t.trx_state='RUNNING'
                  AND p.COMMAND='Sleep'
                  AND p.TIME>2
                )
AND sh.TIMER_START<@dt_timer
AND FROM_UNIXTIME(@dt_ts-CAST((@dt_timer-sh.TIMER_START)/1000000000000  AS SIGNED)) >=it.trx_started
ORDER BY it.trx_id ASC, sh.TIMER_START ASC;
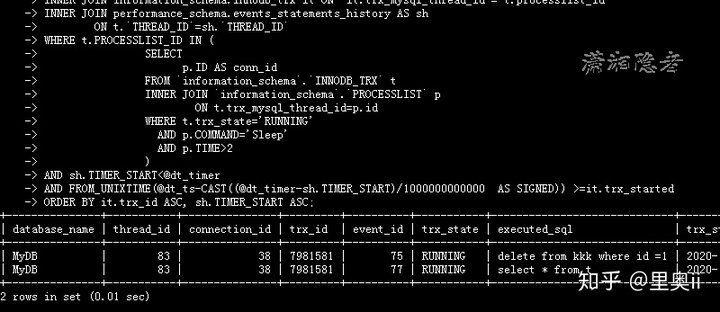
它能找出未提交事务的SQL,简单测试完全没有问题,同时构造几个未提交事务测试也OK。但是上面SQL由三个SQL组成,总感觉有点别扭,研究了一下,可以改造成下面SQL。
SELECT sh.current_schema   AS database_name
   ,t.thread_id
   ,it.trx_mysql_thread_id         AS connection_id
   ,it.trx_id
   ,sh.event_id
   ,it.trx_state
   ,REPLACE(REPLACE(REPLACE(sh.`SQL_TEXT`,'\n',' '),'\r',' '),'\t',' ') AS executed_sql
   ,it.trx_started
   ,DATE_SUB(NOW(), INTERVAL (SELECT VARIABLE_VALUE FROM performance_schema.global_status WHERE VARIABLE_NAME='UPTIME') - sh.TIMER_START*10e-13 second) AS start_time
   ,DATE_SUB(NOW(), INTERVAL (SELECT VARIABLE_VALUE FROM performance_schema.global_status WHERE VARIABLE_NAME='UPTIME') - sh.TIMER_END*10e-13 second)   AS end_time
   ,(sh.TIMER_END-sh.TIMER_START)/1000000000000 AS used_seconds
   ,sh.TIMER_WAIT/1000000000000 AS wait_seconds
   ,sh.LOCK_TIME/1000000000000 AS lock_seconds
   ,sh.ROWS_AFFECTED AS affected_rows
   ,sh.ROWS_SENT AS send_rows
FROM performance_schema.threads AS t
INNER JOIN information_schema.innodb_trx it ON  it.trx_mysql_thread_id = t.processlist_id
INNER JOIN performance_schema.events_statements_history AS sh
        ON t.`THREAD_ID`=sh.`THREAD_ID`
WHERE t.PROCESSLIST_ID IN (
                SELECT
                      p.ID AS conn_id
                FROM `information_schema`.`INNODB_TRX` t
                INNER JOIN `information_schema`.`PROCESSLIST` p
                        ON t.trx_mysql_thread_id=p.id
                WHERE t.trx_state='RUNNING'
                  AND p.COMMAND='Sleep'
                  AND p.TIME>2
                )
AND sh.TIMER_START<@dt_timer
AND DATE_SUB(NOW(), INTERVAL (SELECT VARIABLE_VALUE FROM performance_schema.global_status WHERE VARIABLE_NAME='UPTIME') - sh.TIMER_START*10e-13 second) >=it.trx_started
ORDER BY it.trx_id ASC, sh.TIMER_START ASC;
注意:performance_schema.global_status是MySQL 5.7引入的,如果数据库是MySQL 5.6的话,可以用INFORMATION_SCHEMA.GLOBAL_STATUS替换SQL中的performance_schema.global_status
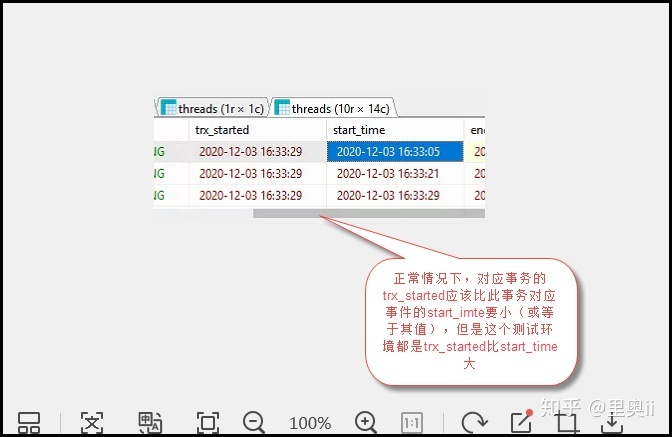
那么是否这个SQL就一定完美了呢? 网友MSSQL123反馈在一个测试环境中,发现上面这种SQL居然查不出任何数据,因为FROM_UNIXTIME(@dt_ts-CAST((@dt_timer-sh.TIMER_START)/1000000000000 AS SIGNED)) >=it.trx_started会将数据过滤掉,检查发现trx_started都大于start_time.那么为什么出现这种情况呢?
搜索相关文档,了解到TIMER_START字段值可能有波动或偏差,那么这个波动或偏差可能影响查询结果,下面内容来自http://porthos.ist.utl.pt/docs/mySQL/performance-schema.html
Modifications to the setup_timers table affect monitoring immediately. Events already in progress may use the original timer for the begin time and the new timer for the end time. To avoid unpredictable results after you make timer changes, use TRUNCATE TABLE to reset Performance Schema statistics.
The timer baseline (“time zero”) occurs at Performance Schema initialization during server startup. TIMER_START and TIMER_END values in events represent picoseconds since the baseline. TIMER_WAIT values are durations in picoseconds.
Picosecond values in events are approximate. Their accuracy is subject to the usual forms of error associated with conversion from one unit to another. If the CYCLE timer is used and the processor rate varies, there might be drift. For these reasons, it is not reasonable to look at the TIMER_START value for an event as an accurate measure of time elapsed since server startup. On the other hand, it is reasonable to use TIMER_START or TIMER_WAIT values in ORDER BY clauses to order events by start time or duration.
The choice of picoseconds in events rather than a value such as microseconds has a performance basis. One implementation goal was to show results in a uniform time unit, regardless of the timer. In an ideal world this time unit would look like a wall-clock unit and be reasonably precise; in other words, microseconds. But to convert cycles or nanoseconds to microseconds, it would be necessary to perform a division for every instrumentation. Division is expensive on many platforms. Multiplication is not expensive, so that is what is used. Therefore, the time unit is an integer multiple of the highest possible TIMER_FREQUENCY value, using a multiplier large enough to ensure that there is no major precision loss. The result is that the time unit is “picoseconds.” This precision is spurious, but the decision enables overhead to be minimized.
Before MySQL 5.7.8, while a wait, stage, statement, or transaction event is executing, the respective current-event tables display the event with TIMER_START populated, but with TIMER_END and TIMER_WAIT set to NULL
其中一段内容翻译如下:
事件中的皮秒值是近似值。它们的准确性受与从一个单位转换到另一单位相关的常见误差形式的影响。如果使用了CYCLE定时器,并且处理器速率有所变化,则可能会有偏差。由于这些原因,将事件的TIMER_START值视为自服务器启动以来经过的时间的准确度量是不合理的。另一方面,在ORDER BY子句中使用TIMER_START或TIMER_WAIT值来按开始时间或持续时间对事件进行排序是合理的。
我们往往想一击必杀的解决问题,但是由于复杂的环境和一些不可控因素,现实往往就是“没有银弹”这么残酷。如果遇到TIMER_START的波动或偏差影响查询结果,那么我必须通过文字前面的SQL找出大量SQL,然后通过其它字段或信息人工甄别哪些才是未提交事务的SQL。
参考资料:
https://stackoverflow.com/questions/25607249/mysql-performance-schema-how-to-get-event-time-from-events-statements-current-ta
http://porthos.ist.utl.pt/docs/mySQL/performance-schema.html
https://dev.mysql.com/doc/refman/5.7/en/performance-schema-timing.html
https://dev.mysql.com/doc/refman/8.0/en/performance-schema-timing.html
原作者:潇湘隐者
原文链接: MySQL如何找出未提交事务的SQL浅析
原出处:DBA闲思杂想录
侵删


 4897
4897


 被折叠的 条评论
为什么被折叠?
被折叠的 条评论
为什么被折叠?
 到【灌水乐园】发言


