


当前配置环境:
Win7 64bit
ZendStudio10.6.2(破解文件:http://download.csdn.net/download/xinzheng_wang/7643419)
Apache2.2.25(win32)
php-5.3.28 (线程安全,下载地址:http://windows.php.net/download/)
1)XDebug下载
XDebug可以到 http://xdebug.org/download.php 下载,可点击custom installation instructions通过复制粘贴phpinfo()输出的内容得到需要下载的版本。
2)打开php.ini并在文件的最后增加如下配置,同时要重新启动Apache
- [XDebug]
- ;调试功能模块儿
- ;extension=php_xdebug-2.2.5-5.3-vc9.dll
- zend_extension ="D:/PHP/php-5.3.28/ext/php_xdebug-2.2.5-5.3-vc9.dll"
- xdebug.remote_handler=dbgp
- ;开启远程调试
- xdebug.remote_enable = On
- ;远程主机
- xdebug.remote_host=localhost
- ;主机端口
- xdebug.remote_port=9000
- ;开启自动跟踪
- xdebug.auto_trace = On
- ;开启异常跟踪
- xdebug.show_exception_trace = On
- ;开启远程调试自动启动
- xdebug.remote_autostart = On
- ;收集变量
- xdebug.collect_vars = On
- ;收集返回值
- xdebug.collect_return = On
- ;收集参数
- xdebug.collect_params = On
- ;临时跟踪信息输出
- ;xdebug.trace_output_dir="d:/PHP/php-5.3.28/temp"
- ;显示局部变量
- xdebug.show_local_vars = On
- xdebug.profiler_enable = On
- ;xdebug.profiler_output_dir ="d:/PHP/php-5.3.28/temp"
- xdebug.trace_enable_trigger =On
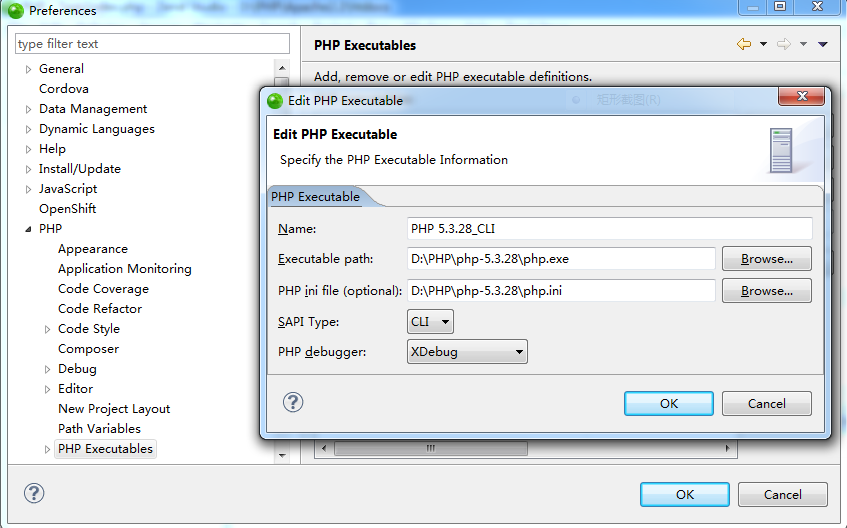
3)Window->Preferences->PHP Executable->Add如下:
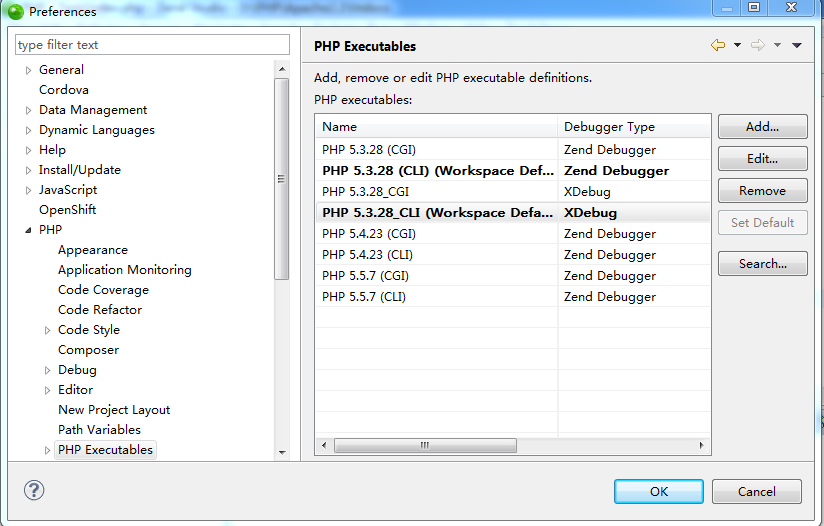
4)设为Default如下:
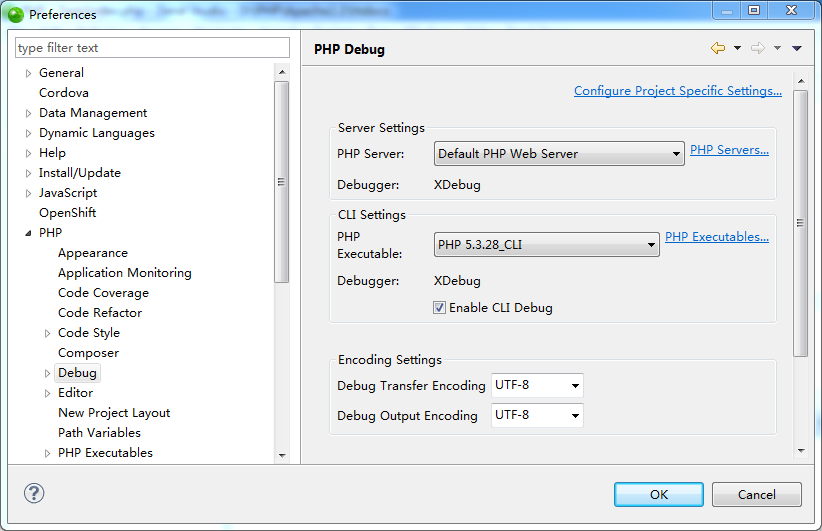
5)Debug设置如下:
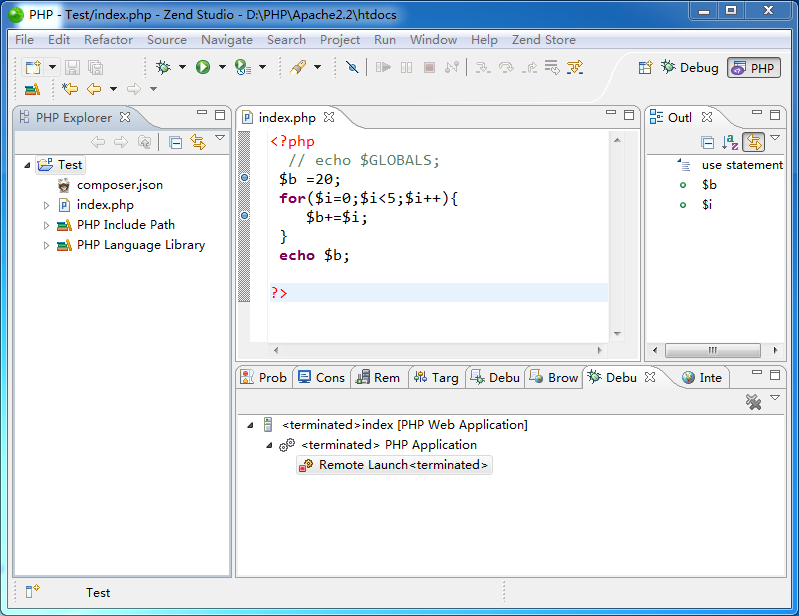
6)新Local PHP Project并增加断点如下:
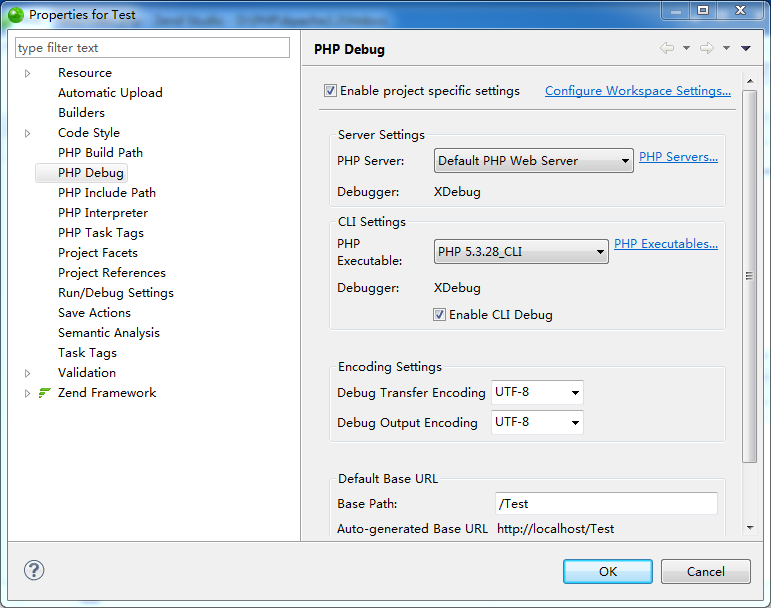
7)右键点击工程,点击菜单Properties设置如下:
8)Debug Configurations设置如下:
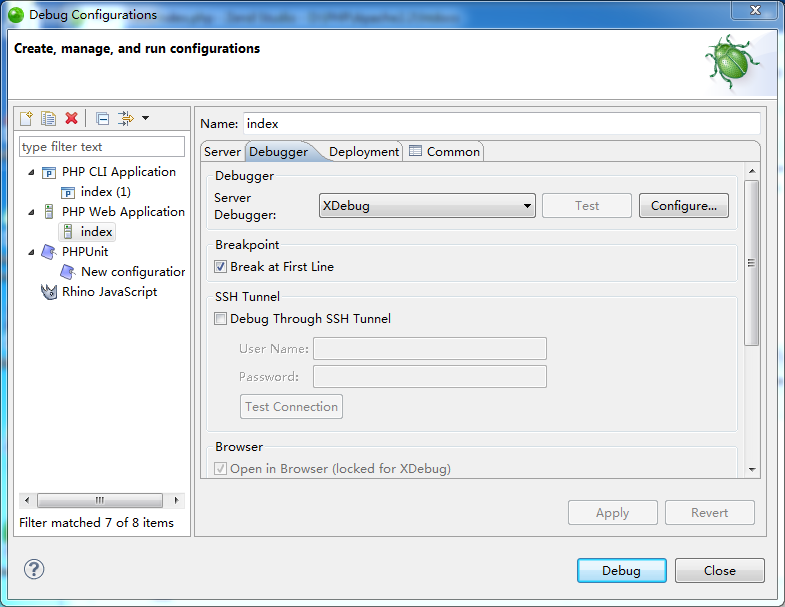
到此为止即可:Debug As PHP CLI Application和PHP Web Application进行断点调试了。


 2859
2859

 被折叠的 条评论
为什么被折叠?
被折叠的 条评论
为什么被折叠?
 到【灌水乐园】发言


