


Operators
Caffe2中的运算符类似函数。 从C ++方面,它们都是从公共接口派生的,并且按类型进行注册,这样我们可以在运行时调用不同的运算符。 运算符的接口在caffe2 / proto / caffe2.proto中定义。 基本上,它需要一堆输入,并产生一堆输出。
记住,当我们在Caffe2 Python中说“创建一个运算符”时,没有任何运行。 它所做的就是创建协议缓冲区,指定操作员应该是什么。 稍后,它将被发送到C ++后端执行。 如果您不熟悉protobuf,那么它是一个类似json的序列化工具,用于结构化数据。 在这里查找有关协议缓冲区的更多信息。
来看一个实际的例子。
# Create an operator.
op = core.CreateOperator(
    "Relu", # The type of operator that we want to run
    ["X"], # A list of input blobs by their names
    ["Y"], # A list of output blobs by their names
)
# and we are done!
正如我们提到的,创建一个op实际上是一个protobuf对象,看一下它的内容。
print ("Type of the created op is:{}".format(type(op)))
print("Content:\n")
print(str(op))
Type of the created op is: <class 'caffe2.proto.caffe2_pb2.OperatorDef'>
Content:
input: "X"
output: "Y"
name: ""
type: "Relu"OK,运行operator。首先把X放进工作区中。最简单的一种运行operator方式是workspace.RunOperatorOnce(operator)
workspace.FeedBlob("X",np.random.randn(2,3).astype(np.float32))
workspace.RunOperatorOnce(op)执行完之后,让我们看看operator是否做了正确的事情,这就是我们神经网络的激活函数(Relu)。
print("Current blobs in the workspace.{}\n".format(workspace.Blobs()))
print("X:\n{}\n".format(workspace.FetchBlob("X")))
print("Y:\n{}\n".format(workspace.FetchBlob("Y")))
print("Expected:\n{}\n".format(np.maximum(workspace.FetchBlob("X"),0)))
Current blobs in the workspace: ['X', 'Y']
X:
[[ 1.03125858 1.0038228 0.0066975 ]
[ 1.33142471 1.80271244 -0.54222912]]
Y:
[[ 1.03125858 1.0038228 0.0066975 ]
[ 1.33142471 1.80271244 0. ]]
Expected:
[[ 1.03125858 1.0038228 0.0066975 ]
[ 1.33142471 1.80271244 0. ]]如果期望输出与Y相等,则有效。
如果需要,运算符也可以选择参数。 它们被指定为键值对。 我们来看一个简单的例子,就是创建张量并用高斯随机变量填充它。
op = core.CreateOperator(
    "GaussianFill",
    [], # GaussianFill does not need any parameters.
    ["Z"],
    shape=[100, 100], # shape argument as a list of ints.
    mean=1.0,  # mean as a single float
    std=1.0, # std as a single float
)
print("Content of op:\n")
print(str(op))
Results:
Content of op:

output: "Z"
name: ""
type: "GaussianFill"
arg {
  name: "std"
  f: 1.0
}
arg {
  name: "shape"
  ints: 100
  ints: 100
}
arg {
  name: "mean"
  f: 1.0
}
运行它看是否想预期的那样。
workspace.RunOperatorOnce(op)
temp=workspace.FetchBlob("Z")
pyplot.hist(temp.flatten(),bins=50)
pyplot.title("Distribution of Z")<matplotlib.text.Text at 0x7f2bd2d51710>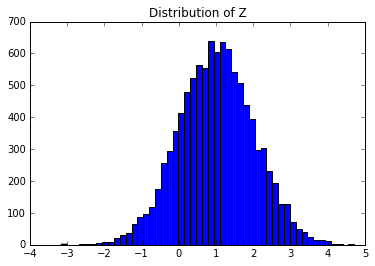
如果你看到一个钟形曲线,你真棒,嘿嘿!


 4731
4731

 被折叠的 条评论
为什么被折叠?
被折叠的 条评论
为什么被折叠?
 到【灌水乐园】发言


