前言
大家好,我是大华。
今天给大家分享一个酷炫的蛇形时间轴动画组件!
在日常开发中,我们经常需要展示时间线信息。比如:
- 公司发展历程
- 产品迭代历史
- 项目里程碑
- 个人成长轨迹
传统的静态时间轴就是一条直线加几个点,视觉上非常单调,用户很容易走神。
而今天分享的这个蛇形时间轴组件,具备以下三大优势:
视觉冲击力强:波浪形布局 + 自动播放动画
交互体验好:悬停显示详情,点击触发事件
高度可定制:支持亮暗主题、多种配置选项
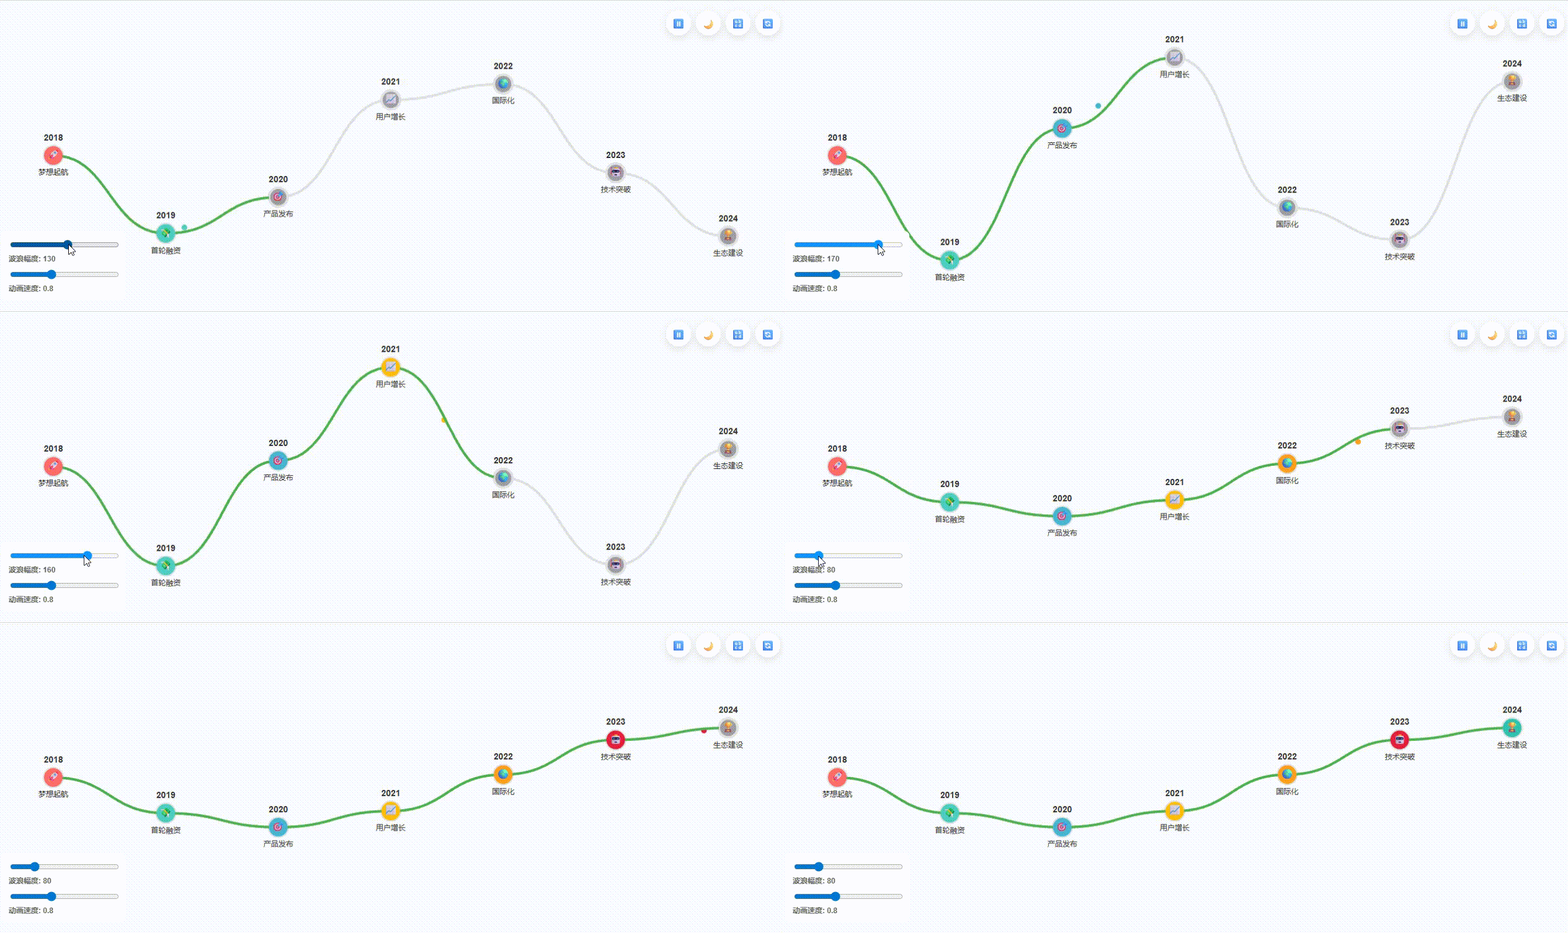
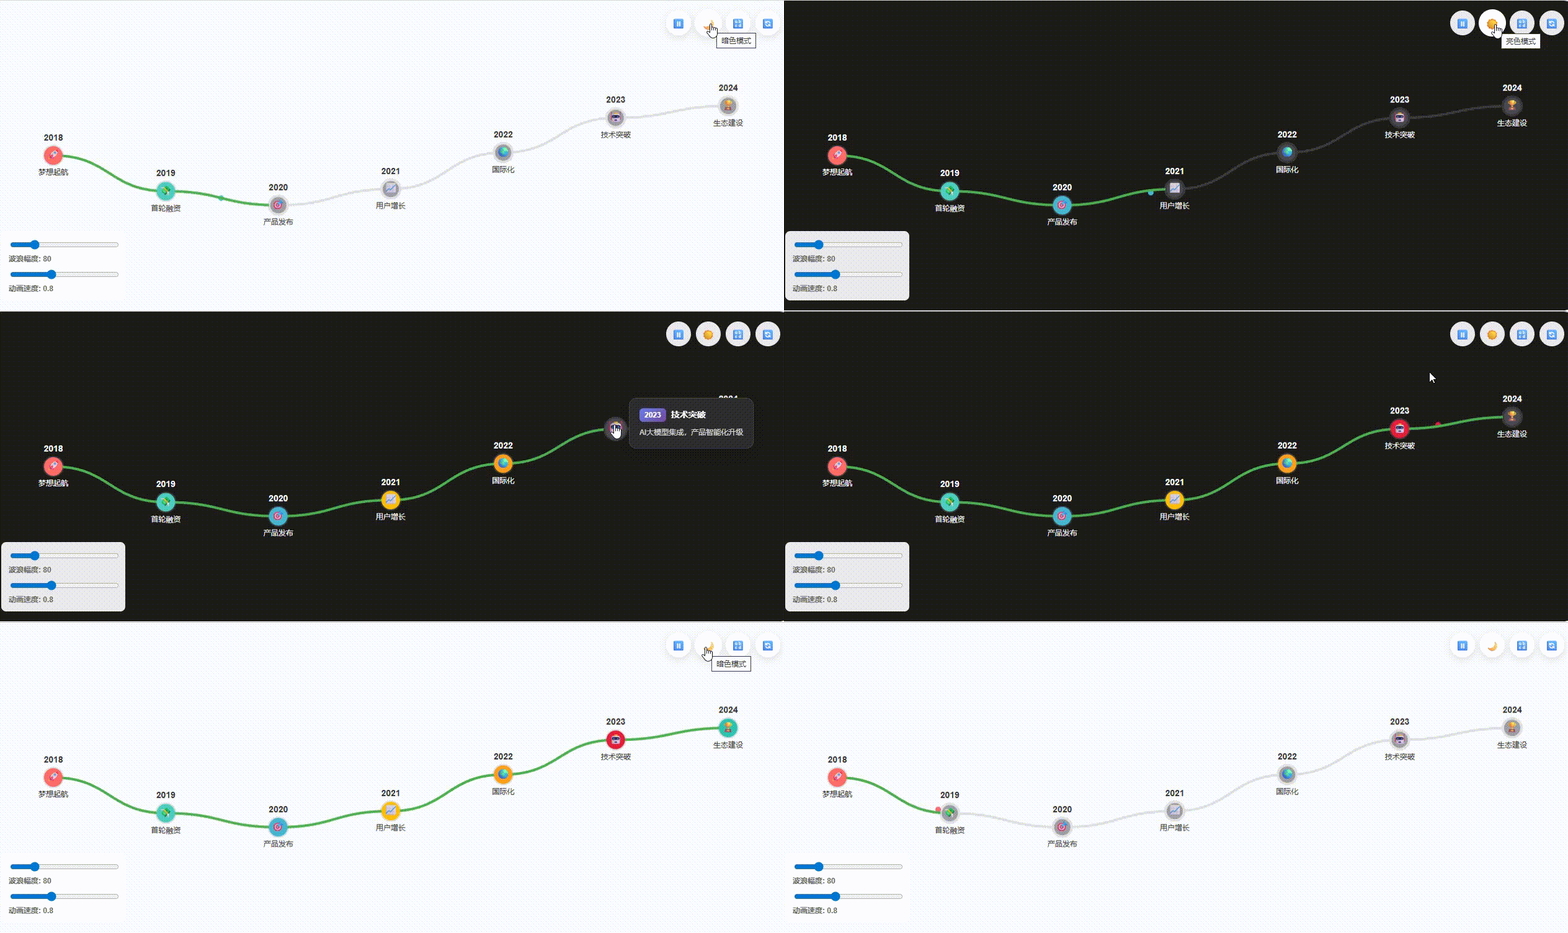
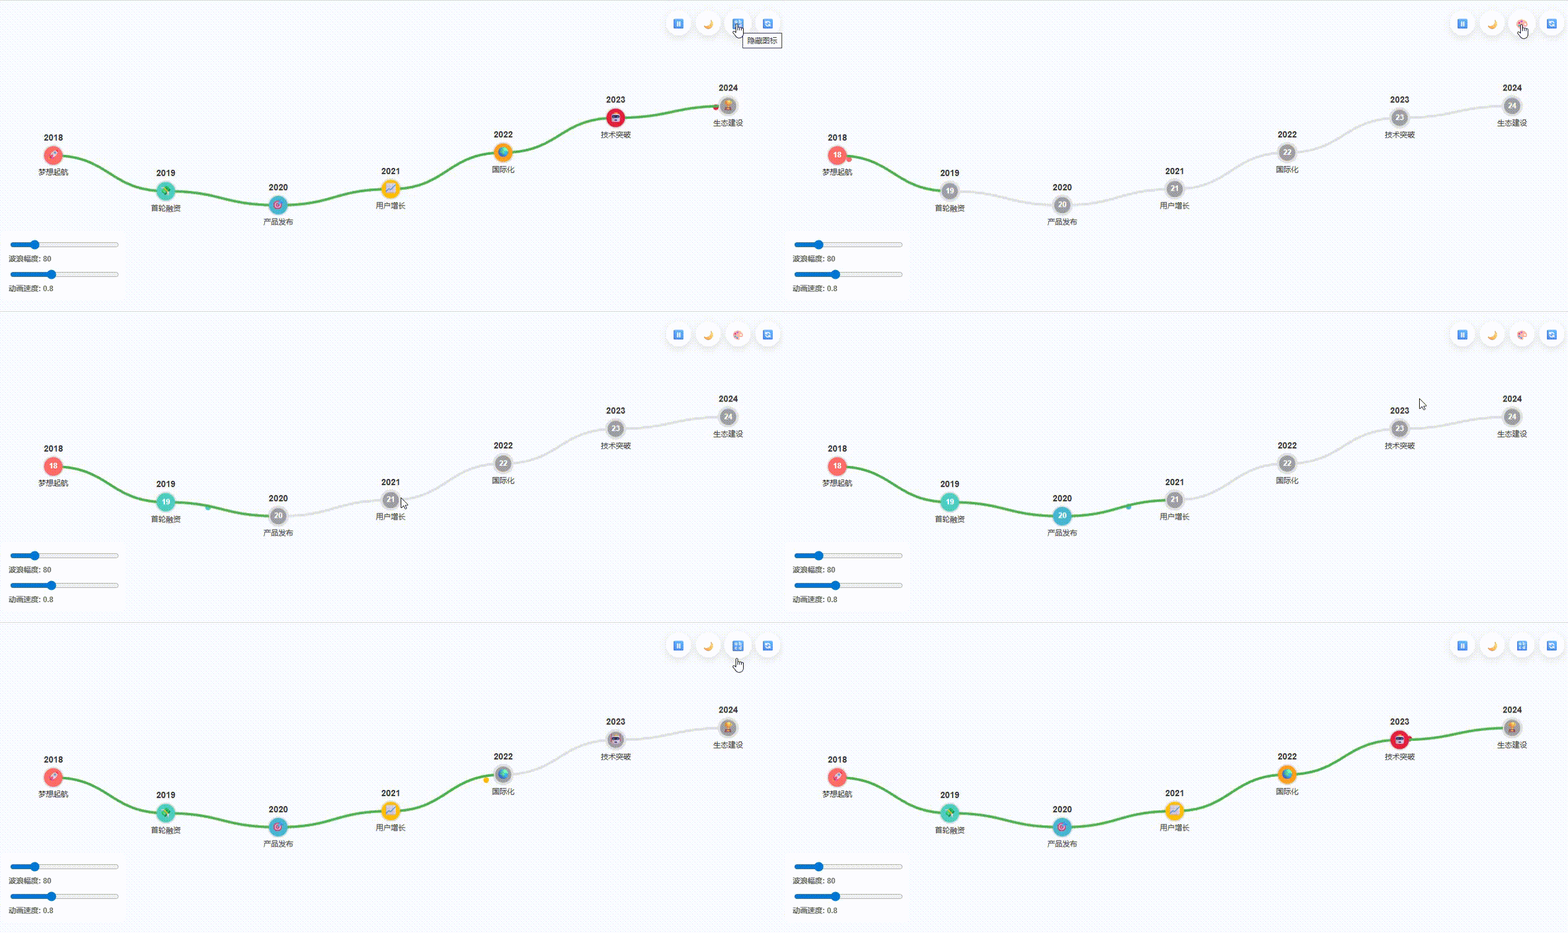
效果图:
波浪幅度的调节

主题色的切换

数字和图标的切换

一、技术架构解析
先来看看整体的组件结构:
<template>
  <div class="snake-timeline-container">
    <canvas></canvas>               <!-- 主画布 -->
    <div class="tooltip"></div>     <!-- 提示框 -->
    <div class="control-panel"></div>  <!-- 控制按钮 -->
    <div class="config-panel"></div>   <!-- 配置面板 -->
    <div class="loading-overlay"></div> <!-- 加载动画 -->
  </div>
</template>
五大模块分工明确:
| 模块 | 功能说明 |
|---|---|
canvas | 负责绘制时间轴图形(节点、连线、动画) |
tooltip | 鼠标悬停时展示节点详细信息 |
control-panel | 提供播放/暂停、快进等控制按钮 |
config-panel | 调整参数,实时预览效果 |
loading-overlay | 加载状态提示,提升用户体验 |
二、核心技术实现
1. 双缓冲绘图优化性能
如果直接在主canvas上频繁重绘性能开销会比较大。所以我们采用双缓冲技术提升渲染效率。
// 初始化离屏 canvas
offScreenCanvas.value = document.createElement('canvas');
offScreenCanvas.value.width = width;
offScreenCanvas.value.height = height;
offScreenCtx.value = offScreenCanvas.value.getContext('2d');
绘制流程:
- 静态内容(如背景、固定节点)绘制到离屏 canvas
- 动态内容(如进度动画、高亮效果)在主 canvas 上叠加
- 每帧只重绘动态部分,大幅减少计算量
优势:避免重复绘制静态内容,显著提升帧率(可达 60fps)
2. 波浪形布局算法
时间轴不再是笔直的线,而是优雅的正弦波浪形。
const y = height / 2 + Math.sin(index * amplitude / 100) * amplitude;
关键参数说明:
| 参数 | 含义 |
|---|---|
amplitude | 波浪幅度,控制上下波动的强度 |
index | 当前节点的序号 |
height/2 | 基准线位置(居中) |
效果:节点沿波浪线分布,形成“蛇形”视觉动效
3. 动画进度控制
使用时间驱动实现无缝循环动画。
const now = Date.now() * speed;
const activeIndex = Math.floor((now % 8000) / 8000 * nodes.length);
技巧点解析:
Date.now()获取当前时间戳speed控制动画播放速度(可配置)8000表示完整动画周期为 8 秒%实现循环播放,无缝衔接
用户看到的是一个自动“游动”的高亮节点,沿着时间轴前进
4. 贝塞尔曲线连接
节点之间使用三次贝塞尔曲线连接,比直线更柔和自然。
ctx.bezierCurveTo(
  cpX1, cpY1,  // 控制点1
  cpX2, cpY2,  // 控制点2
  nextNode.x, nextNode.y // 终点
);
效果:线条流畅,富有动感,增强整体视觉美感
三、深入技术细节
1. 响应式设计
适配不同屏幕尺寸,使用 ResizeObserver 监听容器变化:
resizeObserver.value = new ResizeObserver(entries => {
  initCanvas(); // 尺寸变化时重新初始化画布
});
移动端特别优化:
@media (max-width: 768px) {
  .snake-timeline-container {
    height: 400px;
  }
}
📱 保证在手机端也能清晰展示,交互友好
2. 主题切换
支持亮色 / 暗色双主题,通过计算属性动态切换:
const theme = computed(() =>
  isDarkMode.value ? darkTheme : lightTheme
);
所有颜色、描边、字体等均基于theme计算,切换主题只需修改isDarkMode状态。
适用于 PPT 演示、夜间模式等场景
3. 性能优化技巧
确保动画流畅运行在 60fps,关键优化手段:
- 静态内容缓存到离屏 canvas
- 使用
requestAnimationFrame控制帧率 - 减少不必要的重绘区域
- 利用 CSS 硬件加速(如
transform: translateZ(0))
4. 精准交互检测
鼠标悬停检测使用距离计算法:
const distance = Math.sqrt(
  Math.pow(canvasX - node.x, 2) +
  Math.pow(canvasY - node.y, 2)
);
node.isHovered = distance <= node.radius * hoverScale;
实现节点悬停识别,避免误触
四、配置项详解
组件提供丰富可配置参数,支持实时调整:
const config = ref({
  nodeRadius: 14,           // 节点半径
  lineWidth: 4,            // 连线宽度
  animationSpeed: 0.8,     // 动画速度(倍率)
  waveAmplitude: 120,      // 波浪幅度
  hoverScale: 1.3,         // 悬停放大比例
  showProgressDots: true   // 是否显示进度点
});
实时调节面板示例:
<div class="config-panel">
  <label>
    <input type="range" v-model="config.waveAmplitude" min="50" max="200">
    波浪幅度: {{ config.waveAmplitude }}
  </label>
</div>
🛠️ 开发者或运营人员可自由调整样式,无需修改代码
五、完整源代码
<template>
  <div class="snake-timeline-container" ref="containerRef">
    <canvas
      ref="canvasRef"
      @mousemove="handleMouseMove"
      @click="handleClick"
      @mouseleave="handleMouseLeave"
    ></canvas>

    <!-- 提示框 -->
    <div
      v-if="activeTooltip && showTooltip"
      class="tooltip"
      :style="tooltipStyle"
    >
      <div class="tooltip-header">
        <span class="year-badge">{{ activeTooltip.year }}</span>
        <h3>{{ activeTooltip.event }}</h3>
      </div>
      <p class="tooltip-desc">{{ activeTooltip.description }}</p>
    </div>

    <!-- 控制面板 -->
    <div class="control-panel">
      <button @click="toggleAnimation" class="control-btn" :title="isPlaying ? '暂停' : '播放'">
        {{ isPlaying ? '⏸️' : '▶️' }}
      </button>
      <button @click="toggleTheme" class="control-btn" :title="isDarkMode ? '亮色模式' : '暗色模式'">
        {{ isDarkMode ? '☀️' : '🌙' }}
      </button>
      <button @click="toggleIcons" class="control-btn" :title="showIcons ? '隐藏图标' : '显示图标'">
        {{ showIcons ? '🔡' : '🎨' }}
      </button>
      <button @click="resetAnimation" class="control-btn" title="重置动画">🔄</button>
    </div>

    <!-- 配置面板 -->
    <div class="config-panel">
      <label>
        <input type="range" v-model="config.waveAmplitude" min="50" max="200" step="10">
        波浪幅度: {{ config.waveAmplitude }}
      </label>
      <label>
        <input type="range" v-model="config.animationSpeed" min="0.1" max="2" step="0.1">
        动画速度: {{ config.animationSpeed }}
      </label>
    </div>

    <!-- 加载状态 -->
    <div v-if="isLoading" class="loading-overlay">
      <div class="loading-spinner"></div>
      <p>加载时间轴中...</p>
    </div>
  </div>
</template>

<script setup>
import { ref, onMounted, onUnmounted, watch, computed } from 'vue'

// 响应式数据
const containerRef = ref(null)
const canvasRef = ref(null)
const ctx = ref(null)
const animationFrame = ref(null)
const activeTooltip = ref(null)
const showTooltip = ref(false)
const isLoading = ref(true)
const isPlaying = ref(true)
const isDarkMode = ref(false)
const showIcons = ref(true) // 控制是否显示图标
const mouseX = ref(0)
const mouseY = ref(0)

// 配置参数
const config = ref({
  nodeRadius: 14,
  lineWidth: 4,
  animationSpeed: 0.8,
  waveAmplitude: 120,
  nodeSpacing: 0.85,
  hoverScale: 1.3,
  showProgressDots: true // 是否显示进度点
})

// 主题配置
const theme = computed(() => isDarkMode.value ? {
  background: '#1a1a1a',
  text: '#ffffff',
  nodeInactive: '#4a4a4a',
  lineInactive: '#3a3a3a',
  tooltipBg: '#2d2d2d',
  tooltipBorder: '#404040',
  nodeBorder: '#666666'
} : {
  background: '#f8f9fa',
  text: '#333333',
  nodeInactive: '#9E9E9E',
  lineInactive: '#E0E0E0',
  tooltipBg: '#ffffff',
  tooltipBorder: '#e0e0e0',
  nodeBorder: '#cccccc'
})

// 节点数据
const milestones = ref([
  {
    year: '2018',
    event: '梦想起航',
    description: '初创团队5人,在北京中关村开始了创业之旅',
    color: '#FF6B6B',
    icon: '🚀'
  },
  {
    year: '2019',
    event: '首轮融资',
    description: '获得千万级天使投资,产品研发加速',
    color: '#4ECDC4',
    icon: '💸'
  },
  {
    year: '2020',
    event: '产品发布',
    description: '首款产品正式上线,获得市场积极反馈',
    color: '#45B7D1',
    icon: '🎯'
  },
  {
    year: '2021',
    event: '用户增长',
    description: '用户数突破百万,团队扩张至50人',
    color: '#FFBE0B',
    icon: '📈'
  },
  {
    year: '2022',
    event: '国际化',
    description: '服务拓展至全球15个国家和地区',
    color: '#FF9F1C',
    icon: '🌍'
  },
  {
    year: '2023',
    event: '技术突破',
    description: 'AI大模型集成,产品智能化升级',
    color: '#E71D36',
    icon: '🤖'
  },
  {
    year: '2024',
    event: '生态建设',
    description: '构建完整的产品生态系统,服务千万用户',
    color: '#2EC4B6',
    icon: '🏆'
  }
])

// 节点类
class TimelineNode {
  constructor(x, y, data, index, total) {
    this.x = x
    this.y = y
    this.data = data
    this.index = index
    this.total = total
    this.radius = config.value.nodeRadius
    this.isActive = false
    this.isHovered = false
    this.progress = 0
    this.scale = 1
  }
}

const nodes = ref([])
const offScreenCanvas = ref(null)
const offScreenCtx = ref(null)
const resizeObserver = ref(null)

// 计算属性
const tooltipStyle = computed(() => ({
  left: mouseX.value + 20 + 'px',
  top: mouseY.value - 40 + 'px',
  opacity: showTooltip.value ? 1 : 0,
  transform: `translateY(${showTooltip.value ? 0 : '10px'})`
}))

// 初始化画布
const initCanvas = async () => {
  if (!canvasRef.value || !containerRef.value) return

  isLoading.value = true

  // 设置画布尺寸
  const { width, height } = containerRef.value.getBoundingClientRect()
  canvasRef.value.width = width
  canvasRef.value.height = height - 2

  ctx.value = canvasRef.value.getContext('2d', { alpha: false })

  // 初始化离屏canvas
  offScreenCanvas.value = document.createElement('canvas')
  offScreenCanvas.value.width = width
  offScreenCanvas.value.height = height
  offScreenCtx.value = offScreenCanvas.value.getContext('2d', { alpha: false })

  createNodes()
  cacheStaticElements()

  await new Promise(resolve => setTimeout(resolve, 300))
  isLoading.value = false

  if (isPlaying.value) {
    startAnimation()
  }
}

// 创建节点
const createNodes = () => {
  const { width, height } = canvasRef.value
  nodes.value = milestones.value.map((milestone, index) => {
    const x = 100 + (index * (width - 200) / (milestones.value.length - 1))
    const y = height / 2 + Math.sin(index * config.value.waveAmplitude / 100) * config.value.waveAmplitude

    return new TimelineNode(x, y, milestone, index, milestones.value.length)
  })
}

// 缓存静态元素
const cacheStaticElements = () => {
  if (!offScreenCtx.value) return

  const { width, height } = offScreenCanvas.value

  // 绘制背景
  offScreenCtx.value.fillStyle = theme.value.background
  offScreenCtx.value.fillRect(0, 0, width, height)

  // 绘制连接线(静态部分)
  offScreenCtx.value.strokeStyle = theme.value.lineInactive
  offScreenCtx.value.lineWidth = config.value.lineWidth
  offScreenCtx.value.lineCap = 'round'

  for (let i = 0; i < nodes.value.length - 1; i++) {
    const currentNode = nodes.value[i]
    const nextNode = nodes.value[i + 1]

    offScreenCtx.value.beginPath()
    offScreenCtx.value.moveTo(currentNode.x, currentNode.y)

    const cpX1 = currentNode.x + (nextNode.x - currentNode.x) * 0.5
    const cpY1 = currentNode.y
    const cpX2 = currentNode.x + (nextNode.x - currentNode.x) * 0.5
    const cpY2 = nextNode.y

    offScreenCtx.value.bezierCurveTo(cpX1, cpY1, cpX2, cpY2, nextNode.x, nextNode.y)
    offScreenCtx.value.stroke()
  }

  // 绘制节点背景(保持与线条样式一致)
  nodes.value.forEach(node => {
    offScreenCtx.value.beginPath()
    offScreenCtx.value.arc(node.x, node.y, node.radius + 2, 0, Math.PI * 2)
    offScreenCtx.value.fillStyle = theme.value.background
    offScreenCtx.value.fill()

    // 节点边框与线条颜色一致
    offScreenCtx.value.strokeStyle = theme.value.lineInactive
    offScreenCtx.value.lineWidth = 2
    offScreenCtx.value.stroke()
  })
}

// 绘制动态内容
const drawDynamicContent = () => {
  if (!ctx.value) return

  const { width, height } = canvasRef.value

  // 清空画布并绘制缓存内容
  ctx.value.clearRect(0, 0, width, height)
  ctx.value.drawImage(offScreenCanvas.value, 0, 0)

  // 绘制进度线条
  drawProgressLines()

  // 绘制激活的连接线
  drawActiveConnections()

  // 绘制节点(最后绘制,确保在最上层)
  drawNodes()
}

// 绘制进度线条
const drawProgressLines = () => {
  ctx.value.lineWidth = config.value.lineWidth
  ctx.value.lineCap = 'round'

  nodes.value.forEach((node, index) => {
    if (node.progress > 0 && index < nodes.value.length - 1) {
      const nextNode = nodes.value[index + 1]

      ctx.value.beginPath()
      ctx.value.moveTo(node.x, node.y)

      const cpX1 = node.x + (nextNode.x - node.x) * 0.5
      const cpY1 = node.y
      const cpX2 = node.x + (nextNode.x - node.x) * 0.5
      const cpY2 = nextNode.y

      ctx.value.bezierCurveTo(cpX1, cpY1, cpX2, cpY2, nextNode.x, nextNode.y)
      ctx.value.strokeStyle = node.data.color
      ctx.value.stroke()

      // 绘制进度点(可选)
      if (config.value.showProgressDots) {
        const progressX = node.x + (nextNode.x - node.x) * node.progress
        const progressY = node.y + (nextNode.y - node.y) * node.progress

        ctx.value.beginPath()
        ctx.value.arc(progressX, progressY, 5, 0, Math.PI * 2)
        ctx.value.fillStyle = node.data.color
        ctx.value.fill()

        // 进度点边框与线条一致
        ctx.value.strokeStyle = theme.value.background
        ctx.value.lineWidth = 1
        ctx.value.stroke()
      }
    }
  })
}

// 绘制节点
const drawNodes = () => {
  ctx.value.textAlign = 'center'
  ctx.value.textBaseline = 'middle'

  nodes.value.forEach(node => {
    const scale = node.isHovered ? config.value.hoverScale : 1

    // 绘制节点外圈(与线条样式保持一致)
    ctx.value.save()
    ctx.value.translate(node.x, node.y)
    ctx.value.scale(scale, scale)

    ctx.value.beginPath()
    ctx.value.arc(0, 0, node.radius, 0, Math.PI * 2)

    // 节点填充色
    ctx.value.fillStyle = node.isActive ? node.data.color : theme.value.nodeInactive
    ctx.value.fill()

    // 节点边框(与线条颜色一致)
    ctx.value.strokeStyle = node.isActive ? node.data.color : theme.value.lineInactive
    ctx.value.lineWidth = 2
    ctx.value.stroke()

    // 绘制图标或文字
    if (showIcons.value && node.data.icon) {
      ctx.value.fillStyle = '#ffffff'
      ctx.value.font = '16px Arial'
      ctx.value.fillText(node.data.icon, 0, 0)
    } else {
      // 不显示图标时显示年份缩写
      ctx.value.fillStyle = '#ffffff'
      ctx.value.font = 'bold 12px Arial'
      ctx.value.fillText(node.data.year.slice(2), 0, 0) // 显示后两位年份
    }

    ctx.value.restore()

    // 绘制文字标签
    if (!node.isHovered) {
      ctx.value.fillStyle = theme.value.text
      ctx.value.font = 'bold 14px Arial'
      ctx.value.fillText(node.data.year, node.x, node.y - 28)

      ctx.value.font = '12px Arial'
      ctx.value.fillText(node.data.event, node.x, node.y + 28)
    }
  })
}

// 绘制激活的连接线
const drawActiveConnections = () => {
  ctx.value.strokeStyle = '#4CAF50'
  ctx.value.lineWidth = config.value.lineWidth
  ctx.value.lineCap = 'round'

  for (let i = 0; i < nodes.value.length - 1; i++) {
    if (nodes.value[i].isActive) {
      const currentNode = nodes.value[i]
      const nextNode = nodes.value[i + 1]

      ctx.value.beginPath()
      ctx.value.moveTo(currentNode.x, currentNode.y)

      const cpX1 = currentNode.x + (nextNode.x - currentNode.x) * 0.5
      const cpY1 = currentNode.y
      const cpX2 = currentNode.x + (nextNode.x - currentNode.x) * 0.5
      const cpY2 = nextNode.y

      ctx.value.bezierCurveTo(cpX1, cpY1, cpX2, cpY2, nextNode.x, nextNode.y)
      ctx.value.stroke()
    }
  }
}

// 动画循环
const animate = () => {
  updateAnimation()
  drawDynamicContent()
  if (isPlaying.value) {
    animationFrame.value = requestAnimationFrame(animate)
  }
}

// 更新动画状态
const updateAnimation = () => {
  const now = Date.now() * config.value.animationSpeed

  nodes.value.forEach((node, index) => {
    const activeIndex = Math.floor((now % 8000) / 8000 * nodes.value.length)
    node.isActive = index <= activeIndex

    if (index < nodes.value.length - 1) {
      const globalProgress = (now % 8000) / 8000
      const segmentProgress = (globalProgress * nodes.value.length) - index
      node.progress = Math.max(0, Math.min(1, segmentProgress))
    }
  })
}

// 鼠标交互处理
const handleMouseMove = (event) => {
  if (!canvasRef.value) return

  const rect = canvasRef.value.getBoundingClientRect()
  mouseX.value = event.clientX
  mouseY.value = event.clientY
  const canvasX = event.clientX - rect.left
  const canvasY = event.clientY - rect.top

  let hoveredNode = null

  nodes.value.forEach(node => {
    const distance = Math.sqrt(Math.pow(canvasX - node.x, 2) + Math.pow(canvasY - node.y, 2))
    node.isHovered = distance <= node.radius * config.value.hoverScale

    if (node.isHovered) {
      hoveredNode = node
    }
  })

  if (hoveredNode) {
    activeTooltip.value = hoveredNode.data
    showTooltip.value = true
    canvasRef.value.style.cursor = 'pointer'
  } else {
    showTooltip.value = false
    canvasRef.value.style.cursor = 'default'
  }
}

const handleMouseLeave = () => {
  showTooltip.value = false
  nodes.value.forEach(node => {
    node.isHovered = false
  })
}

const handleClick = (event) => {
  if (!canvasRef.value) return

  const rect = canvasRef.value.getBoundingClientRect()
  const canvasX = event.clientX - rect.left
  const canvasY = event.clientY - rect.top

  const clickedNode = nodes.value.find(node => {
    const distance = Math.sqrt(Math.pow(canvasX - node.x, 2) + Math.pow(canvasY - node.y, 2))
    return distance <= node.radius * config.value.hoverScale
  })

  if (clickedNode) {
    console.log('节点点击:', clickedNode.data)
    emit('nodeClick', clickedNode.data)
  }
}

// 控制函数
const toggleAnimation = () => {
  isPlaying.value = !isPlaying.value
  if (isPlaying.value) {
    startAnimation()
  }
}

const toggleTheme = () => {
  isDarkMode.value = !isDarkMode.value
  cacheStaticElements()
  drawDynamicContent()
}

const toggleIcons = () => {
  showIcons.value = !showIcons.value
  drawDynamicContent()
}

const resetAnimation = () => {
  nodes.value.forEach(node => {
    node.isActive = false
    node.progress = 0
  })
  if (isPlaying.value) {
    startAnimation()
  }
}

const startAnimation = () => {
  if (animationFrame.value) {
    cancelAnimationFrame(animationFrame.value)
  }
  animate()
}

// 响应式处理
const setupResizeObserver = () => {
  resizeObserver.value = new ResizeObserver(entries => {
    if (!entries[0]) return
    initCanvas()
  })

  if (containerRef.value) {
    resizeObserver.value.observe(containerRef.value)
  }
}

// 生命周期
onMounted(() => {
  setupResizeObserver()
  initCanvas()
})

onUnmounted(() => {
  if (animationFrame.value) {
    cancelAnimationFrame(animationFrame.value)
  }
  if (resizeObserver.value) {
    resizeObserver.value.disconnect()
  }
})

// 监听变化
watch(isDarkMode, () => {
  cacheStaticElements()
  drawDynamicContent()
})

watch(milestones, () => {
  createNodes()
  cacheStaticElements()
  drawDynamicContent()
})

watch([() => config.value.waveAmplitude, () => config.value.animationSpeed], () => {
  createNodes()
  cacheStaticElements()
  if (isPlaying.value) {
    startAnimation()
  }
})

// 定义事件
const emit = defineEmits(['nodeClick'])
</script>

<style scoped>
.snake-timeline-container {
  position: relative;
  width: 100%;
  height: 500px;
  background: var(--background, #f8f9fa);
  border-radius: 16px;
  overflow: hidden;
  transition: background-color 0.3s ease;
}

canvas {
  display: block;
  width: 100%;
  height: 100%;
  border-radius: 16px;
}

.tooltip {
  position: fixed;
  background: v-bind('theme.tooltipBg');
  border: 1px solid v-bind('theme.tooltipBorder');
  padding: 16px;
  border-radius: 12px;
  box-shadow: 0 8px 32px rgba(0, 0, 0, 0.15);
  backdrop-filter: blur(10px);
  z-index: 1000;
  max-width: 280px;
  transition: all 0.3s ease;
  pointer-events: none;
}

.tooltip-header {
  display: flex;
  align-items: center;
  gap: 8px;
  margin-bottom: 8px;
}

.year-badge {
  background: linear-gradient(135deg, #667eea 0%, #764ba2 100%);
  color: white;
  padding: 4px 8px;
  border-radius: 6px;
  font-size: 12px;
  font-weight: bold;
}

.tooltip-header h3 {
  margin: 0;
  color: v-bind('theme.text');
  font-size: 14px;
  font-weight: 600;
}

.tooltip-desc {
  margin: 0;
  color: v-bind('theme.text');
  font-size: 12px;
  line-height: 1.5;
  opacity: 0.8;
}

.control-panel {
  position: absolute;
  top: 16px;
  right: 16px;
  display: flex;
  gap: 8px;
  z-index: 10;
}

.control-btn {
  width: 40px;
  height: 40px;
  border: none;
  border-radius: 50%;
  background: rgba(255, 255, 255, 0.9);
  backdrop-filter: blur(10px);
  cursor: pointer;
  font-size: 16px;
  transition: all 0.2s ease;
  box-shadow: 0 4px 12px rgba(0, 0, 0, 0.1);
}

.control-btn:hover {
  transform: scale(1.1);
  background: rgba(255, 255, 255, 1);
}

.config-panel {
  position: absolute;
  bottom: 16px;
  left: 16px;
  background: rgba(255, 255, 255, 0.9);
  padding: 12px;
  border-radius: 8px;
  backdrop-filter: blur(10px);
  z-index: 10;
  display: flex;
  flex-direction: column;
  gap: 8px;
  min-width: 200px;
}

.config-panel label {
  display: flex;
  flex-direction: column;
  gap: 4px;
  font-size: 12px;
  color: #666;
}

.config-panel input[type="range"] {
  width: 100%;
}

.loading-overlay {
  position: absolute;
  top: 0;
  left: 0;
  right: 0;
  bottom: 0;
  background: rgba(0, 0, 0, 0.5);
  display: flex;
  flex-direction: column;
  justify-content: center;
  align-items: center;
  color: white;
  z-index: 20;
}

.loading-spinner {
  width: 40px;
  height: 40px;
  border: 3px solid rgba(255, 255, 255, 0.3);
  border-top: 3px solid white;
  border-radius: 50%;
  animation: spin 1s linear infinite;
  margin-bottom: 16px;
}

@keyframes spin {
  0% { transform: rotate(0deg); }
  100% { transform: rotate(360deg); }
}

/* 响应式设计 */
@media (max-width: 768px) {
  .snake-timeline-container {
    height: 400px;
    border-radius: 12px;
  }

  .tooltip {
    max-width: 200px;
    font-size: 11px;
  }

  .control-panel {
    top: 8px;
    right: 8px;
  }

  .control-btn {
    width: 36px;
    height: 36px;
    font-size: 14px;
  }

  .config-panel {
    bottom: 8px;
    left: 8px;
    right: 8px;
    min-width: auto;
  }
}
</style>
六、扩展与优化方向
1. 功能扩展
- 支持垂直布局(竖向时间轴)
- 添加缩放功能(手势/滚轮控制)
- 集成图表联动(点击节点联动数据图表)
2. 性能优化
- 使用 WebGL 替代 Canvas,提升复杂动画性能
- 虚拟列表优化:仅渲染可视区域节点
- 离屏渲染进一步拆分图层,减少重绘
3. 设计优化
- 支持自定义节点图标/图片
- 更多动画效果:如“蛇头游动”、“光效扫描”
- 响应式布局增强,适配平板、折叠屏设备
总结
- 视觉效果突出:波浪布局 + 流畅动画,吸引用户注意力
- 交互体验流畅:悬停、点击、控制面板响应及时
- 高度可定制:主题、动画速度、波浪幅度等均可配置
如果你也需要展示时间线信息,不妨试试这个方案!代码已结构化,可直接集成或二次开发。
公众号:程序员刘大华,专注分享前后端开发的实战笔记。关注我,少走弯路,一起进步!
📌往期精彩
《工作 5 年没碰过分布式锁,是我太菜还是公司太稳?网友:太真实了!》
《90%的人不知道!Spring官方早已不推荐@Autowired?这3种注入方式你用对了吗?》
 Canvas实现蛇形时间轴动画


 被折叠的 条评论
为什么被折叠?


