


直方图
import numpy as np
import matplotlib.pyplot as plt
np.random.seed(19680801)
mu1, sigma1 = 100, 15
mu2, sigma2 = 80, 15
x1 = mu1 + sigma1 * np.random.randn(10000)
x2 = mu2 + sigma2 * np.random.randn(10000)
# the histogram of the data
# 50:将数据分成50组
# facecolor:颜色;alpha:透明度
# density:是密度而不是具体数值
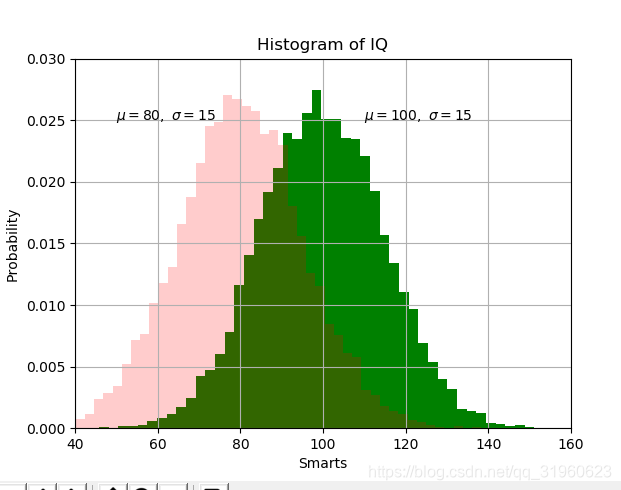
n1, bins1, patches1 = plt.hist(x1, 50, density=True, facecolor='g', alpha=1)
n2, bins2, patches2 = plt.hist(x2, 50, density=True, facecolor='r', alpha=0.2)
# n:概率值;bins:具体数值;patches:直方图对象。
plt.xlabel('Smarts')
plt.ylabel('Probability')
plt.title('Histogram of IQ')
plt.text(110, .025, r'$\mu=100,\ \sigma=15$')
plt.text(50, .025, r'$\mu=80,\ \sigma=15$')
# 设置x,y轴的具体范围
plt.axis([40, 160, 0, 0.03])
plt.grid(True)
plt.show()


 1621
1621

 被折叠的 条评论
为什么被折叠?
被折叠的 条评论
为什么被折叠?
 到【灌水乐园】发言


