


目录
1. MAVEN坐标
<dependency>
    <groupId>org.openjdk.jmh</groupId>
    <artifactId>jmh-core</artifactId>
    <version>${jmh.version}</version>
</dependency>
<dependency>
    <groupId>org.openjdk.jmh</groupId>
    <artifactId>jmh-generator-annprocess</artifactId>
    <version>${jmh.version}</version>
    <scope>provided</scope>
</dependency>
2. 使用Maven创建基准测试工程
maven命令:
mvn archetype:generate \
    -DinteractiveMode=false \
    -DarchetypeGroupId=org.openjdk.jmh \
    -DarchetypeArtifactId=jmh-java-benchmark-archetype \
    -DgroupId=me.acgkaka \
    -DartifactId=jmh-demo \
    -Dversion=1.0
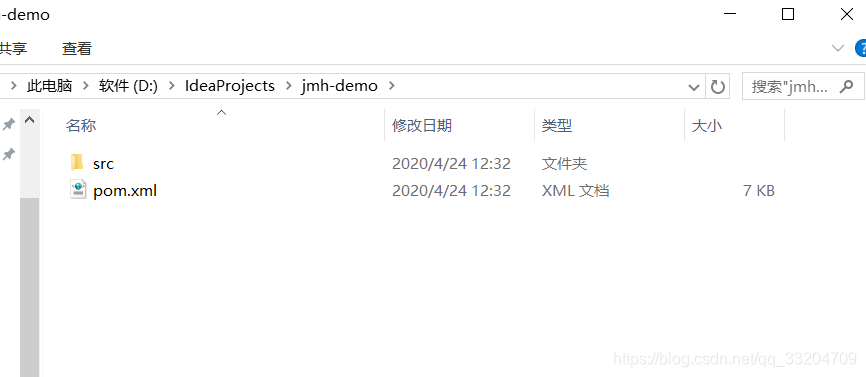
在命令行运行如下命令:
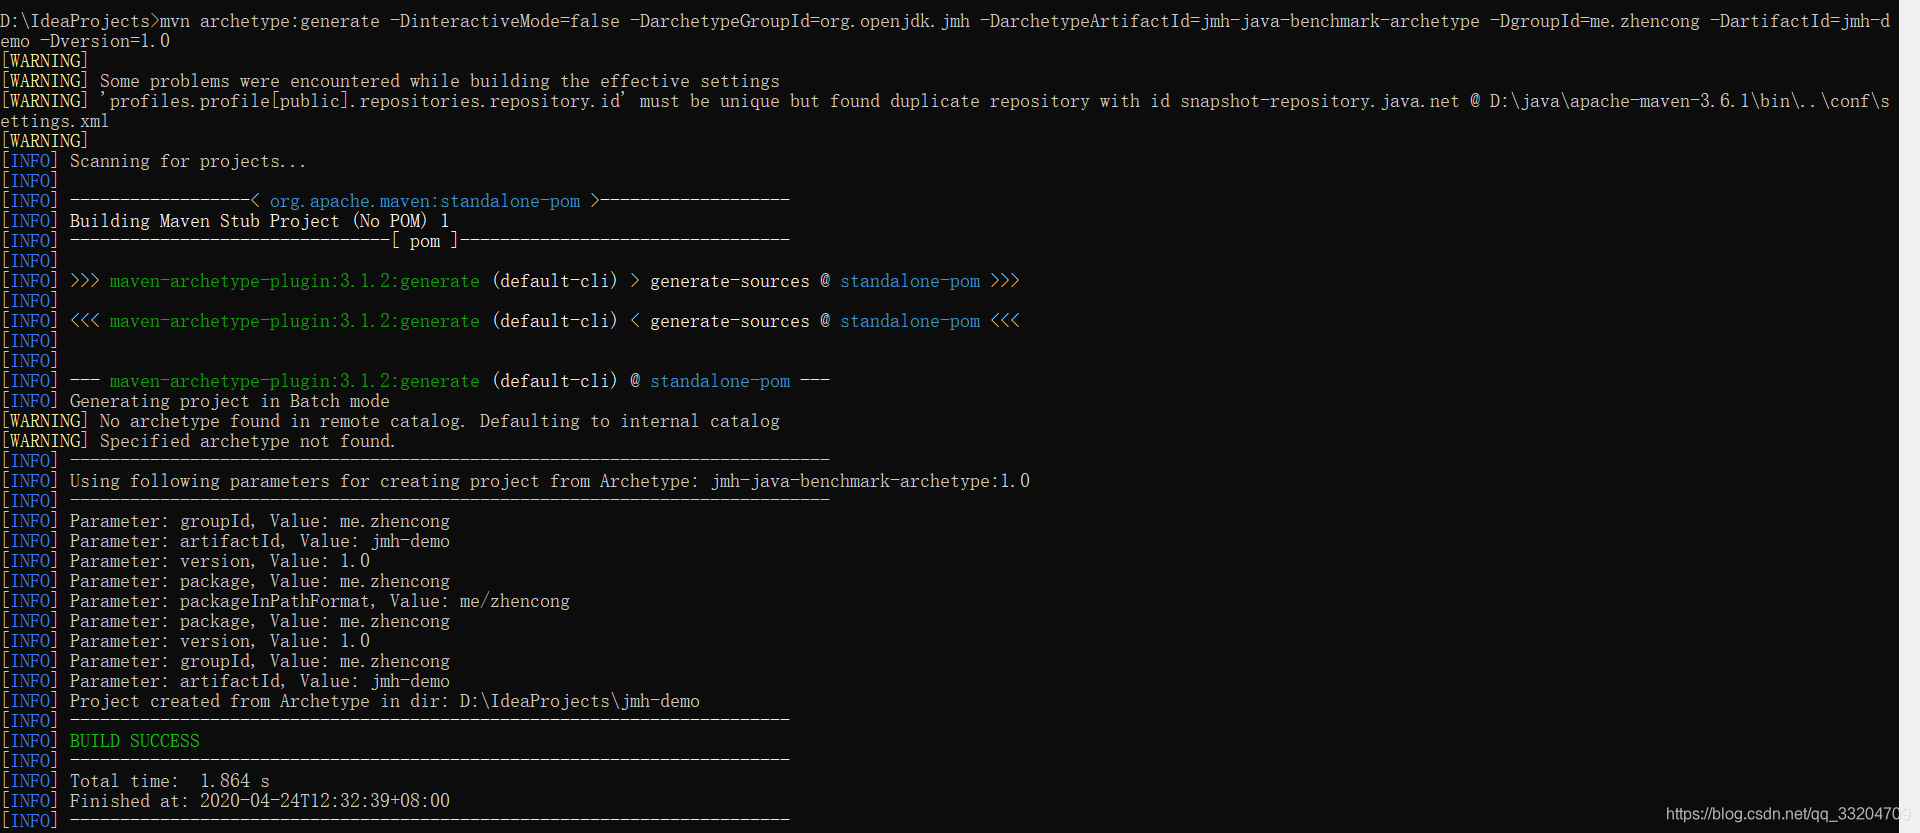
maven会生成一个用于JMH基准测试的项目文件夹:
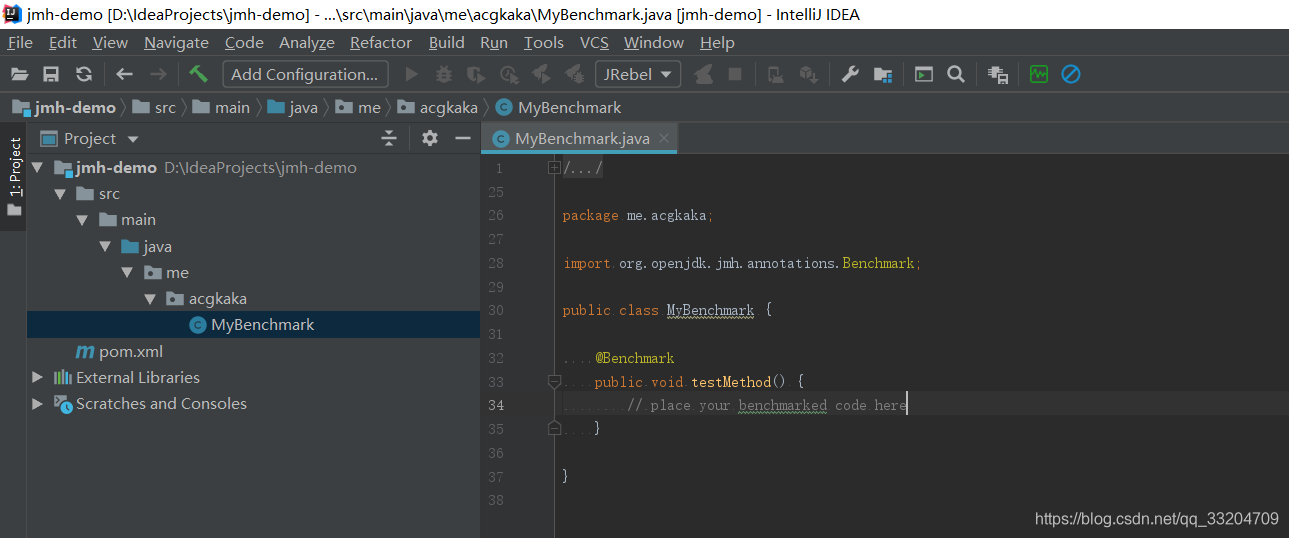
3. Hello JMH
StringBenchmark 类
import org.openjdk.jmh.annotations.*;
import org.openjdk.jmh.runner.Runner;
import org.openjdk.jmh.runner.RunnerException;
import org.openjdk.jmh.runner.options.Options;
import org.openjdk.jmh.runner.options.OptionsBuilder;

/**
 * <p> @Title StringBenchmark
 * <p> @Description 用于测试String的吞吐量
 *
 * @author ACGkaka
 * @date 2020/4/24 12:42
 */
public class StringBenchmark {

    @Benchmark
    public void testString() {
        String s = "";
        for (int i = 0; i < 10; i++) {
            s = s + i;
        }
        print(s);
    }

    @Benchmark
    public void testStringBuilder() {
        StringBuilder sb = new StringBuilder();
        for (int i = 0; i < 10; i++) {
            sb.append(i);
        }
        print(sb.toString());
    }

    private void print(String s) {}

    public static void main(String[] args) throws RunnerException {
        // 使用一个单独进程执行测试,执行2遍warmup,然后执行6遍测试
        Options opt = new OptionsBuilder()
                .include(StringBenchmark.class.getSimpleName())
                // 预热2轮
                .warmupIterations(2)
                // 度量3轮
                .measurementIterations(3)
                .mode(Mode.Throughput)
            	// 进行2次
                .forks(2)
                .build();
        new Runner(opt).run();
    }
}
执行结果:
# VM invoker: D:\java\jdk1.8.0_60\jre\bin\java.exe
# VM options: -javaagent:D:\Program Files\JetBrains\IntelliJ IDEA 2019.1.3\lib\idea_rt.jar=65080:D:\Program Files\JetBrains\IntelliJ IDEA 2019.1.3\bin -Dfile.encoding=UTF-8
# Warmup: 2 iterations, 1 s each
# Measurement: 3 iterations, 1 s each
# Threads: 1 thread, will synchronize iterations
# Benchmark mode: Throughput, ops/time
# Benchmark: me.acgkaka.StringBenchmark.testString

# Run progress: 0.00% complete, ETA 00:00:20
# Fork: 1 of 2
# Warmup Iteration   1: 4775475.344 ops/s
# Warmup Iteration   2: 8210805.724 ops/s
Iteration   1: 8559393.472 ops/s
Iteration   2: 8389436.435 ops/s
Iteration   3: 8960363.744 ops/s

# Run progress: 25.00% complete, ETA 00:00:20
# Fork: 2 of 2
# Warmup Iteration   1: 7157878.620 ops/s
# Warmup Iteration   2: 7697351.065 ops/s
Iteration   1: 8179452.640 ops/s
Iteration   2: 8396086.664 ops/s
Iteration   3: 8332731.946 ops/s


Result: 8469577.483 ±(99.9%) 756258.206 ops/s [Average]
  Statistics: (min, avg, max) = (8179452.640, 8469577.483, 8960363.744), stdev = 269688.961
  Confidence interval (99.9%): [7713319.277, 9225835.690]


# VM invoker: D:\java\jdk1.8.0_60\jre\bin\java.exe
# VM options: -javaagent:D:\Program Files\JetBrains\IntelliJ IDEA 2019.1.3\lib\idea_rt.jar=65080:D:\Program Files\JetBrains\IntelliJ IDEA 2019.1.3\bin -Dfile.encoding=UTF-8
# Warmup: 2 iterations, 1 s each
# Measurement: 3 iterations, 1 s each
# Threads: 1 thread, will synchronize iterations
# Benchmark mode: Throughput, ops/time
# Benchmark: me.acgkaka.StringBenchmark.testStringBuilder

# Run progress: 50.00% complete, ETA 00:00:13
# Fork: 1 of 2
# Warmup Iteration   1: 25414829.522 ops/s
# Warmup Iteration   2: 15524343.931 ops/s
Iteration   1: 21658035.265 ops/s
Iteration   2: 21529494.508 ops/s
Iteration   3: 20304681.066 ops/s

# Run progress: 75.00% complete, ETA 00:00:06
# Fork: 2 of 2
# Warmup Iteration   1: 24579160.651 ops/s
# Warmup Iteration   2: 18582346.257 ops/s
Iteration   1: 18010912.834 ops/s
Iteration   2: 15950104.631 ops/s
Iteration   3: 15987995.584 ops/s


Result: 18906870.648 ±(99.9%) 7362362.636 ops/s [Average]
  Statistics: (min, avg, max) = (15950104.631, 18906870.648, 21658035.265), stdev = 2625489.438
  Confidence interval (99.9%): [11544508.012, 26269233.284]


# Run complete. Total time: 00:00:27

Benchmark                                 Mode  Samples         Score  Score error  Units
m.a.StringBenchmark.testString           thrpt        6   8469577.483   756258.206  ops/s
m.a.StringBenchmark.testStringBuilder    thrpt        6  18906870.648  7362362.636  ops/s

Process finished with exit code 0
4. 基本概念
Mode
Mode 表示 JMH 进行 Benchmark 时所使用的模式。目前 JMH 共有四种模式:
Throughput: 整体吞吐量,例如“1秒内可以执行多少次调用”。AverageTime: 调用的平均时间,例如“每次调用平均耗时xxx毫秒”。SampleTime: 随机取样,最后输出取样结果的分布,例如“99%的调用在xxx毫秒以内,99.99%的调用在xxx毫秒以内”SingleShotTime: 以上模式都是默认一次 iteration 是 1s,唯有SingleShotTime是只运行一次。往往同时把 warmup 次数设为0,用于测试冷启动时的性能。
Iteration
Iteration 是 JMH 进行测试的最小单位。在大部分模式下,一次 iteration 代表的是一秒,JMH 会在这一秒内不断调用需要 benchmark 的方法,然后根据模式对其采样,计算吞吐量,计算平均执行时间等。
Warmup
Warmup 是指在实际进行 benchmark 前先进行预热的行为。为什么需要预热?因为 JVM 的 JIT 机制的存在,如果某个函数被调用多次之后,JVM 会尝试将其编译成为机器码从而提高执行速度。所以为了让 benchmark 的结果更加接近真实情况就需要进行预热。
5. 注解
现在来解释一下上面例子中使用到的注解,其实很多注解的意义完全可以望文生义 😃
@Benchmark
表示该方法是需要进行 benchmark 的对象,用法和 JUnit 的 @Test 类似。
@Mode
Mode 如之前所说,表示 JMH 进行 Benchmark 时所使用的模式。
@State
State 用于声明某个类是一个“状态”,然后接受一个 Scope 参数用来表示该状态的共享范围。因为很多 benchmark 会需要一些表示状态的类,JMH 允许你把这些类以依赖注入的方式注入到 benchmark 函数里。Scope 主要分为两种。
Thread: 该状态为每个线程独享。Benchmark: 该状态在所有线程间共享。
关于State的用法,官方的 code sample 里有比较好的例子。
@OutputTimeUnit
benchmark 结果所使用的时间单位。
6. 启动选项
解释完了注解,再来看看 JMH 在启动前设置的参数。
Options opt = new OptionsBuilder()
        .include(FirstBenchmark.class.getSimpleName())
        .forks(1)
        .warmupIterations(5)
        .measurementIterations(5)
        .build();

new Runner(opt).run();
include
benchmark 所在的类的名字,注意这里是使用正则表达式对所有类进行匹配的。
fork
进行 fork 的次数。如果 fork 数是2的话,则 JMH 会 fork 出两个进程来进行测试。
warmupIterations
预热的迭代次数。
measurementIterations
实际测量的迭代次数。
7. 第二个实例
在看过第一个完全只为示范的例子之后,再来看一个有实际意义的例子。
问题:
计算 1 ~ n 之和,比较串行算法和并行算法的效率,看 n 在大约多少时并行算法开始超越串行算法
首先定义一个表示这两种实现的接口
public interface Calculator {
    /**
     * calculate sum of an integer array
     * @param numbers
     * @return
     */
    public long sum(int[] numbers);

    /**
     * shutdown pool or reclaim any related resources
     */
    public void shutdown();
}
由于这两种算法的实现不是这篇文章的重点,而且本身并不困难,所以实际代码就不赘述了。如果真的感兴趣的话,可以看最后的附录。以下仅说明一下我所指的串行算法和并行算法的含义。
- 串行算法:使用
for-loop来计算 n 个正整数之和。 - 并行算法:将所需要计算的 n 个正整数分成 m 份,交给 m 个线程分别计算出和以后,再把它们的结果相加。
进行 benchmark 的代码如下
@BenchmarkMode(Mode.AverageTime)
@OutputTimeUnit(TimeUnit.MICROSECONDS)
@State(Scope.Benchmark)
public class SecondBenchmark {
    @Param({"10000", "100000", "1000000"})
    private int length;

    private int[] numbers;
    private Calculator singleThreadCalc;
    private Calculator multiThreadCalc;

    public static void main(String[] args) throws RunnerException {
        Options opt = new OptionsBuilder()
                .include(SecondBenchmark.class.getSimpleName())
                .forks(2)
                .warmupIterations(5)
                .measurementIterations(5)
                .build();

        new Runner(opt).run();
    }

    @Benchmark
    public long singleThreadBench() {
        return singleThreadCalc.sum(numbers);
    }

    @Benchmark
    public long multiThreadBench() {
        return multiThreadCalc.sum(numbers);
    }

    @Setup
    public void prepare() {
        numbers = IntStream.rangeClosed(1, length).toArray();
        singleThreadCalc = new SinglethreadCalculator();
        multiThreadCalc = new MultithreadCalculator(Runtime.getRuntime().availableProcessors());
    }

    @TearDown
    public void shutdown() {
        singleThreadCalc.shutdown();
        multiThreadCalc.shutdown();
    }
}
注意到这里用到了3个之前没有使用的注解。
@Param
@Param 可以用来指定某项参数的多种情况。特别适合用来测试一个函数在不同的参数输入的情况下的性能。
@Setup
@Setup 会在执行 benchmark 之前被执行,正如其名,主要用于初始化。
@TearDown
@TearDown 和 @Setup 相对的,会在所有 benchmark 执行结束以后执行,主要用于资源的回收等。
最后来猜猜看实际结果如何?并行算法在哪个问题集下能够超越串行算法?
我在自己的 mac 上跑下来的结果,总数在10000时并行算法不如串行算法,总数达到100000时并行算法开始和串行算法接近,总数达到1000000时并行算法所耗时间约是串行算法的一半左右。
参考:http://blog.dyngr.com/blog/2016/10/29/introduction-of-jmh/


 846
846


 被折叠的 条评论
为什么被折叠?
被折叠的 条评论
为什么被折叠?
 到【灌水乐园】发言


