


LeakCanary介绍
LeakCanary提供了一种很方便的方式,让我们在开发阶段测试内存泄露,我们不需要自己根据内存块来分析内存泄露的原因,我们只需要在项目中集成他,然后他就会帮我们检测内存泄露,并给出内存泄露的引用链
集成
- 在gradle中添加依赖,这种不区分debug和release
implementation 'com.squareup.leakcanary:leakcanary-android:1.5.1'
- 重写Application
public class App extends Application {

    private RefWatcher mRefWatcher;

    @Override
    public void onCreate() {
        super.onCreate();

        if (LeakCanary.isInAnalyzerProcess(this)) {
            // This process is dedicated to LeakCanary for heap analysis.
            // You should not init your app in this process.
            return;
        }

        mRefWatcher = LeakCanary.install(this);

    }


    public static RefWatcher getRefWatcher(Context context) {
        App application = (App) context.getApplicationContext();
        return application.mRefWatcher;
    }
}
- 比如我们在Activity中制造Handler发延迟消息的内存泄露
public class ActivityOne extends AppCompatActivity {

    @Override
    protected void onCreate(Bundle savedInstanceState) {
        super.onCreate(savedInstanceState);
        setContentView(R.layout.activity_one);

        new Handler().postDelayed(new Runnable() {
            @Override
            public void run() {

            }
        }, 100000);
    }


    @Override
    protected void onDestroy() {
        super.onDestroy();
    }
}
- 然后我们打开这个activity然后再关闭,桌面就会出现一个leaks的图标,然后我们打开它
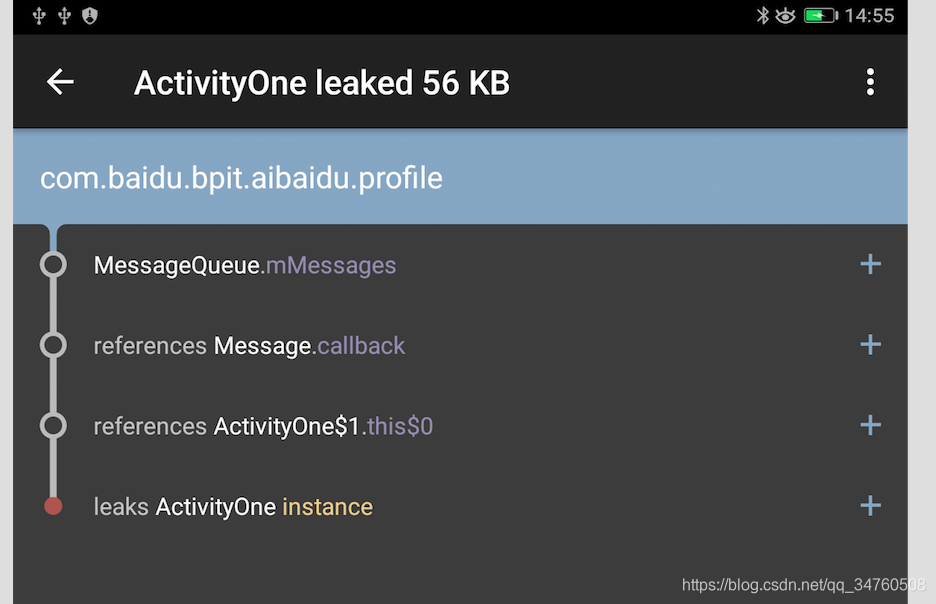
这就是基本使用,其实这种形式只能监视Activity的内存泄露,至于为什么只能监视Activity的内存泄露我们下面再分析,如果想要监视其他的内存泄露怎么办,比如要监视Fragment的内存泄露,可以这样写,主动监视想要监视的对象
public abstract class BaseFragment extends Fragment {

  @Override public void onDestroy() {
    super.onDestroy();
    RefWatcher refWatcher = App.getRefWatcher(getActivity());
    refWatcher.watch(this);
  }
}
原理概述
通过监听Activity的onDestory,手动调用GC,然后通过ReferenceQueue+WeakReference,来判断Activity对象是否被回收,然后结合dump Heap的hpof文件,通过Haha开源库分析泄露的位置
主要的知识点
-
注册Activity的生命周期的监听器
通过Application.registerActivityLifecycleCallbacks()方法注册Activity的生命周期的监听器,每一个Actvity的生命周期都会回调到这个ActivityLifecycleCallbacks上,如果一个Activity走到了onDestory,那么就意味着他就不再存在,然后检测这个Activity是否是真的被销毁 -
通过ReferenceQueue+WeakReference,来判断对象是否被回收
WeakReference创建时,可以传入一个ReferenceQueue对象,假如WeakReference中引用对象被回收,那么就会把WeakReference对象添加到ReferenceQueue中,可以通过ReferenceQueue中是否为空来判断,被引用对象是否被回收
详细介绍推荐博客:https://www.jianshu.com/p/964fbc30151a -
MessageQueue中加入一个IdleHandler来得到主线程空闲回调
这个知识点等之后写一篇Handler源码分析的时候在具体分析 -
手动调用GC后还调用了
System.runFinalization();,这个是强制调用已失去引用对象的finalize方法
在可达性算法中,不可达对象,也不是非死不可,这时他们处于“缓刑”阶段,要宣告一个对象真正死亡需要至少俩个标记阶段, 如果发现对象没有引用链,则会进行第一次标记,并进行一次筛选,筛选的条件是此对象是否有必要进行finalize()方法,当对象没有覆盖finalize(),或者finalize()已经调用过,这俩种都视为“没有必要执行” -
Apolication中可通过processName判断是否是任务执行进程
通过processName,来判断进程
  public static boolean isInServiceProcess(Context context, Class<? extends Service> serviceClass) {
    PackageManager packageManager = context.getPackageManager();
    PackageInfo packageInfo;
    try {
      packageInfo = packageManager.getPackageInfo(context.getPackageName(), GET_SERVICES);
    } catch (Exception e) {
      CanaryLog.d(e, "Could not get package info for %s", context.getPackageName());
      return false;
    }
    String mainProcess = packageInfo.applicationInfo.processName;

    ComponentName component = new ComponentName(context, serviceClass);
    ServiceInfo serviceInfo;
    try {
      serviceInfo = packageManager.getServiceInfo(component, 0);
    } catch (PackageManager.NameNotFoundException ignored) {
      // Service is disabled.
      return false;
    }

    if (serviceInfo.processName.equals(mainProcess)) {
      CanaryLog.d("Did not expect service %s to run in main process %s", serviceClass, mainProcess);
      // Technically we are in the service process, but we're not in the service dedicated process.
      return false;
    }

    int myPid = android.os.Process.myPid();
    ActivityManager activityManager =
        (ActivityManager) context.getSystemService(Context.ACTIVITY_SERVICE);
    ActivityManager.RunningAppProcessInfo myProcess = null;
    List<ActivityManager.RunningAppProcessInfo> runningProcesses =
        activityManager.getRunningAppProcesses();
    if (runningProcesses != null) {
      for (ActivityManager.RunningAppProcessInfo process : runningProcesses) {
        if (process.pid == myPid) {
          myProcess = process;
          break;
        }
      }
    }
    if (myProcess == null) {
      CanaryLog.d("Could not find running process for %d", myPid);
      return false;
    }

    return myProcess.processName.equals(serviceInfo.processName);
  }
源码分析
SDK初始化
mRefWatcher = LeakCanary.install(this);
这个是SDK向外暴露的方法,我们以此为入口进行源码的分析
 public static RefWatcher install(Application application) {
    return refWatcher(application).listenerServiceClass(DisplayLeakService.class)
        .excludedRefs(AndroidExcludedRefs.createAppDefaults().build())
        .buildAndInstall();
  }

 public static AndroidRefWatcherBuilder refWatcher(Context context) {
    return new AndroidRefWatcherBuilder(context);
  }
install方法首先初始化了一个AndroidRefWatcherBuilder类,然后通过listenerServiceClass方法设置了DisplayLeakService,这个类主要用于分析内存泄露的结果信息,然后发送通知给用户
public final class AndroidRefWatcherBuilder extends RefWatcherBuilder<AndroidRefWatcherBuilder> {

  /**
   * Sets a custom {@link AbstractAnalysisResultService} to listen to analysis results. This
   * overrides any call to {@link #heapDumpListener(HeapDump.Listener)}.
   */
  public AndroidRefWatcherBuilder listenerServiceClass(
      Class<? extends AbstractAnalysisResultService> listenerServiceClass) {
    return heapDumpListener(new ServiceHeapDumpListener(context, listenerServiceClass));
  }
  ...
  }

public class RefWatcherBuilder<T extends RefWatcherBuilder<T>> {
  ...
  /** @see HeapDump.Listener */
  public final T heapDumpListener(HeapDump.Listener heapDumpListener) {
    this.heapDumpListener = heapDumpListener;
    return self();
  }
  ...
  }
然后调用excludedRefs方法添加白名单,在AndroidExcludedRefs枚举类中定义了忽略列表信息,如果这些列表中的类发生了内存泄露,并不会显示出来,同时HeapAnalyzer计算GCRoot强引用路径,也会忽略这些类,如果你希望自己项目中某个类泄露的,但是不希望他显示,就可以把类添加到这个上面
public enum AndroidExcludedRefs {

  // ######## Android SDK Excluded refs ########

  ACTIVITY_CLIENT_RECORD__NEXT_IDLE(SDK_INT >= KITKAT && SDK_INT <= LOLLIPOP) {
    @Override void add(ExcludedRefs.Builder excluded) {
      excluded.instanceField("android.app.ActivityThread$ActivityClientRecord", "nextIdle")
          .reason("Android AOSP sometimes keeps a reference to a destroyed activity as a"
              + " nextIdle client record in the android.app.ActivityThread.mActivities map."
              + " Not sure what's going on there, input welcome.");
    }
  }
  ...
  }
最后调用了buildAndInstall方法,创建了一个RefWatcher对象并返回,这个对象是用于检测是否有对象未被回收导致的内存泄露
  /**
   * Creates a {@link RefWatcher} instance and starts watching activity references (on ICS+).
   */
  public RefWatcher buildAndInstall() {
    RefWatcher refWatcher = build();
    if (refWatcher != DISABLED) {
      LeakCanary.enableDisplayLeakActivity(context);
      ActivityRefWatcher.install((Application) context, refWatcher);
    }
    return refWatcher;
  }
因为分析泄露是在另一个进程进行的,所以判断当前启动的Application是否在分析内存泄露的进程中,如果是就直接返回DISABLED,不在进行后续初始化,如果发现是在程序主进程中,就进行初始化
LeakCanary.enableDisplayLeakActivity(context);主要作用是调用PackageManager将DisplayLeakActivity设置为可用。
 public static void enableDisplayLeakActivity(Context context) {
    setEnabled(context, DisplayLeakActivity.class, true);
  }

  public static void setEnabled(Context context, final Class<?> componentClass,
      final boolean enabled) {
    final Context appContext = context.getApplicationContext();
    executeOnFileIoThread(new Runnable() {
      @Override public void run() {
        setEnabledBlocking(appContext, componentClass, enabled);
      }
    });
  }

  public static void setEnabledBlocking(Context appContext, Class<?> componentClass,
      boolean enabled) {
    ComponentName component = new ComponentName(appContext, componentClass);
    PackageManager packageManager = appContext.getPackageManager();
    int newState = enabled ? COMPONENT_ENABLED_STATE_ENABLED : COMPONENT_ENABLED_STATE_DISABLED;
    // Blocks on IPC.
    packageManager.setComponentEnabledSetting(component, newState, DONT_KILL_APP);
  }
从配置文件看LeakCanary这几个文件都是运行在新进程的,DisplayLeakActivity默认enable=false,这样就可以一开始隐藏启动图标
<application>
    <service
        android:name=".internal.HeapAnalyzerService"
        android:process=":leakcanary"
        android:enabled="false"/>
    <service
        android:name=".DisplayLeakService"
        android:process=":leakcanary"
        android:enabled="false"/>
    <activity
        android:theme="@style/leak_canary_LeakCanary.Base"
        android:name=".internal.DisplayLeakActivity"
        android:process=":leakcanary"
        android:enabled="false"
        android:label="@string/leak_canary_display_activity_label"
        android:icon="@drawable/leak_canary_icon"
        android:taskAffinity="com.squareup.leakcanary.${applicationId}">
      <intent-filter>
        <action android:name="android.intent.action.MAIN"/>
        <category android:name="android.intent.category.LAUNCHER"/>
      </intent-filter>
    </activity>
    <activity
        android:theme="@style/leak_canary_Theme.Transparent"
        android:name=".internal.RequestStoragePermissionActivity"
        android:process=":leakcanary"
        android:taskAffinity="com.squareup.leakcanary.${applicationId}"
        android:enabled="false"
        android:excludeFromRecents="true"
        android:icon="@drawable/leak_canary_icon"
        android:label="@string/leak_canary_storage_permission_activity_label"/>
</application>
接着 ActivityRefWatcher.install((Application) context, refWatcher);这里把refWatcher当做参数传入,同时对Activity的生命周期进行了监听
  public static void install(Application application, RefWatcher refWatcher) {
    new ActivityRefWatcher(application, refWatcher).watchActivities();
  }


  public void watchActivities() {
    // Make sure you don't get installed twice.
    stopWatchingActivities();
    application.registerActivityLifecycleCallbacks(lifecycleCallbacks);
  }


 public void stopWatchingActivities() {
    application.unregisterActivityLifecycleCallbacks(lifecycleCallbacks);
  }


 private final Application.ActivityLifecycleCallbacks lifecycleCallbacks =
      new Application.ActivityLifecycleCallbacks() {
        @Override public void onActivityCreated(Activity activity, Bundle savedInstanceState) {
        }

        @Override public void onActivityStarted(Activity activity) {
        }

        @Override public void onActivityResumed(Activity activity) {
        }

        @Override public void onActivityPaused(Activity activity) {
        }

        @Override public void onActivityStopped(Activity activity) {
        }

        @Override public void onActivitySaveInstanceState(Activity activity, Bundle outState) {
        }

        @Override public void onActivityDestroyed(Activity activity) {
          ActivityRefWatcher.this.onActivityDestroyed(activity);
        }
      };


  void onActivityDestroyed(Activity activity) {
    refWatcher.watch(activity);
  }
首先就是注册Activity的生命周期的监听器lifecycleCallbacks,这个监听器可以监听项目中所有Activity的的生命周期,然后在Activity销毁调用onActivityDestroyed的时候,LeakCanary就会获取这个Activity,然后对其进行分析,看是否有内存泄露
分析内存泄露
这里分析对象是否内存泄露的是RefWatcher类,下面简单介绍一下这个类的成员变量
- WatchExecutor watchExecutor:确保任务在主线程进行,同时默认延迟5s执行任务,留时间给系统GC
- DebuggerControl debuggerControl:控制中心
- GcTrigger gcTrigger:内部调用
Runtime.getRuntime().gc(),手动触发GC - HeapDumper heapDumper:用于创建.hprof文件,用于储存head堆快照,可以知道哪些程序在大部分使用内存
- HeapDump.Listener heapdumpListener:分析结果完成后会告诉这个监听器
- ExcludedRefs excludedRefs:分析内存泄露的白名单
从上面可以看出,每当Activity销毁,就会调用RefWatcher的watch方法,去分析是否是内存泄露
 public void watch(Object watchedReference) {
    watch(watchedReference, "");
  }

  public void watch(Object watchedReference, String referenceName) {
    if (this == DISABLED) {
      return;
    }
    checkNotNull(watchedReference, "watchedReference");
    checkNotNull(referenceName, "referenceName");
    final long watchStartNanoTime = System.nanoTime();
    String key = UUID.randomUUID().toString();
    retainedKeys.add(key);
    final KeyedWeakReference reference =
        new KeyedWeakReference(watchedReference, key, referenceName, queue);

    ensureGoneAsync(watchStartNanoTime, reference);
  }
上面代码主要作用是,先生成一个随机数key放在retainedKeys容器里,用来区分对象是否被回收,创建了一个弱引用,然后把要分析的Activity对象存入,然后调用了ensureGoneAsync方法
private void ensureGoneAsync(final long watchStartNanoTime, final KeyedWeakReference reference) {
    watchExecutor.execute(new Retryable() {
      @Override public Retryable.Result run() {
        return ensureGone(reference, watchStartNanoTime);
      }
    });
  }
然后用watchExecutor去调度分析任务,这个主要是保证,在主线程进行,延迟5s,让系统有时间GC
  @SuppressWarnings("ReferenceEquality") // Explicitly checking for named null.
  Retryable.Result ensureGone(final KeyedWeakReference reference, final long watchStartNanoTime) {
    long gcStartNanoTime = System.nanoTime();
    long watchDurationMs = NANOSECONDS.toMillis(gcStartNanoTime - watchStartNanoTime);

    removeWeaklyReachableReferences();

    if (debuggerControl.isDebuggerAttached()) {
      // The debugger can create false leaks.
      return RETRY;
    }
    if (gone(reference)) {
      return DONE;
    }
    gcTrigger.runGc();
    removeWeaklyReachableReferences();
    if (!gone(reference)) {
      long startDumpHeap = System.nanoTime();
      long gcDurationMs = NANOSECONDS.toMillis(startDumpHeap - gcStartNanoTime);

      File heapDumpFile = heapDumper.dumpHeap();
      if (heapDumpFile == RETRY_LATER) {
        // Could not dump the heap.
        return RETRY;
      }
      long heapDumpDurationMs = NANOSECONDS.toMillis(System.nanoTime() - startDumpHeap);
      heapdumpListener.analyze(
          new HeapDump(heapDumpFile, reference.key, reference.name, excludedRefs, watchDurationMs,
              gcDurationMs, heapDumpDurationMs));
    }
    return DONE;
  }


  private void removeWeaklyReachableReferences() {
    // WeakReferences are enqueued as soon as the object to which they point to becomes weakly
    // reachable. This is before finalization or garbage collection has actually happened.
    KeyedWeakReference ref;
    while ((ref = (KeyedWeakReference) queue.poll()) != null) {
      retainedKeys.remove(ref.key);
    }
  }

  private boolean gone(KeyedWeakReference reference) {
    return !retainedKeys.contains(reference.key);
  }
首先通过removeWeaklyReachableReferences()方法,尝试从弱引用队列获取待分析对象,如果不为空说明被系统回收了,就把retainedKeys中的key值移除,如果被系统回收直接返回DONE,如果没有被系统回收,就手动调用 gcTrigger.runGc();手动触发系统gc,然后再次调用removeWeaklyReachableReferences()方法,如过还是为空,则判断为内存泄露
 GcTrigger DEFAULT = new GcTrigger() {
    @Override public void runGc() {
      // Code taken from AOSP FinalizationTest:
      // https://android.googlesource.com/platform/libcore/+/master/support/src/test/java/libcore/
      // java/lang/ref/FinalizationTester.java
      // System.gc() does not garbage collect every time. Runtime.gc() is
      // more likely to perfom a gc.
      Runtime.getRuntime().gc();
      enqueueReferences();
      System.runFinalization();
    }

    private void enqueueReferences() {
      // Hack. We don't have a programmatic way to wait for the reference queue daemon to move
      // references to the appropriate queues.
      try {
        Thread.sleep(100);
      } catch (InterruptedException e) {
        throw new AssertionError();
      }
    }
  };
手动触发GC后,调用enqueueReferences方法沉睡100ms,给系统GC时间, System.runFinalization();,这个是强制调用已失去引用对象的finalize方法
确定有内存泄漏后,调用heapDumper.dumpHeap();生成.hprof文件,然后回调到heapdumpListener监听,这个监听实现是ServiceHeapDumpListener类,会调analyze()方法
public final class ServiceHeapDumpListener implements HeapDump.Listener {
...
  @Override public void analyze(HeapDump heapDump) {
    checkNotNull(heapDump, "heapDump");
    HeapAnalyzerService.runAnalysis(context, heapDump, listenerServiceClass);
  }
}
HeapDump是一个modle类,里面用于储存一些分析类强引用的需要信息
HeapAnalyzerService.runAnalysis方法是发送了一个intent,启动了HeapAnalyzerService服务,这是一个intentService
 public static void runAnalysis(Context context, HeapDump heapDump,
      Class<? extends AbstractAnalysisResultService> listenerServiceClass) {
    Intent intent = new Intent(context, HeapAnalyzerService.class);
    intent.putExtra(LISTENER_CLASS_EXTRA, listenerServiceClass.getName());
    intent.putExtra(HEAPDUMP_EXTRA, heapDump);
    context.startService(intent);
  }
启动服务后,会在onHandleIntent方法启动分析,找到内存泄露的引用关系
  @Override
  protected void onHandleIntent(Intent intent) {
    if (intent == null) {
      CanaryLog.d("HeapAnalyzerService received a null intent, ignoring.");
      return;
    }
    String listenerClassName = intent.getStringExtra(LISTENER_CLASS_EXTRA);
    HeapDump heapDump = (HeapDump) intent.getSerializableExtra(HEAPDUMP_EXTRA);

    HeapAnalyzer heapAnalyzer = new HeapAnalyzer(heapDump.excludedRefs);

    AnalysisResult result = heapAnalyzer.checkForLeak(heapDump.heapDumpFile, heapDump.referenceKey);
    AbstractAnalysisResultService.sendResultToListener(this, listenerClassName, heapDump, result);
  }
找到引用关系
- 启动分析内存泄露的服务后,会实例化一个
HeapAnalyzer对象,然后调用checkForLeak方法来分析最终得到的结果, checkForLeak这里用到了Square的另一个库haha,哈哈哈哈哈,名字真的就是叫这个,开源地址:https://github.com/square/haha。- 得到结果后调用
AbstractAnalysisResultService.sendResultToListener()方法,这个方法启动了另一个服务
  public static void sendResultToListener(Context context, String listenerServiceClassName,
      HeapDump heapDump, AnalysisResult result) {
    Class<?> listenerServiceClass;
    try {
      listenerServiceClass = Class.forName(listenerServiceClassName);
    } catch (ClassNotFoundException e) {
      throw new RuntimeException(e);
    }
    Intent intent = new Intent(context, listenerServiceClass);
    intent.putExtra(HEAP_DUMP_EXTRA, heapDump);
    intent.putExtra(RESULT_EXTRA, result);
    context.startService(intent);
  }
listenerServiceClassName就是开始LeakCanary.install方法传入的DisplayLeakService,它本身也是一个intentService
@Override
protected final void onHandleIntent(Intent intent) {
    HeapDump heapDump = (HeapDump) intent.getSerializableExtra(HEAP_DUMP_EXTRA);
    AnalysisResult result = (AnalysisResult) intent.getSerializableExtra(RESULT_EXTRA);
    try {
      onHeapAnalyzed(heapDump, result);
    } finally {
      //noinspection ResultOfMethodCallIgnored
      heapDump.heapDumpFile.delete();
    }
  }
然后调用自身的onHeapAnalyzed方法
protected final void onHeapAnalyzed(HeapDump heapDump, AnalysisResult result) {
    String leakInfo = LeakCanary.leakInfo(this, heapDump, result, true);
    CanaryLog.d("%s", new Object[]{leakInfo});
    boolean resultSaved = false;
    boolean shouldSaveResult = result.leakFound || result.failure != null;
    if(shouldSaveResult) {
        heapDump = this.renameHeapdump(heapDump);
        resultSaved = this.saveResult(heapDump, result);
    }

    PendingIntent pendingIntent;
    String contentTitle;
    String contentText;

    // 设置消息通知的 pendingIntent/contentTitle/contentText
    ...

    int notificationId1 = (int)(SystemClock.uptimeMillis() / 1000L);
    LeakCanaryInternals.showNotification(this, contentTitle, contentText, pendingIntent, notificationId1);
    this.afterDefaultHandling(heapDump, result, leakInfo);
}
这个方法首先判断是否需要把信息存到本地,如果需要就存到本地,然后设置消息通知的基本信息,最后通过LeakCanaryInternals.showNotification方法调用系统的系统通知栏,告诉用户有内存泄露
至此LeakCanary的检测内存泄露源码,已经分析完了
参考:https://blog.csdn.net/xiaohanluo/article/details/78196755
https://juejin.im/post/5ab8d3d46fb9a028ca52f813


 1万+
1万+


 被折叠的 条评论
为什么被折叠?
被折叠的 条评论
为什么被折叠?
 到【灌水乐园】发言


