


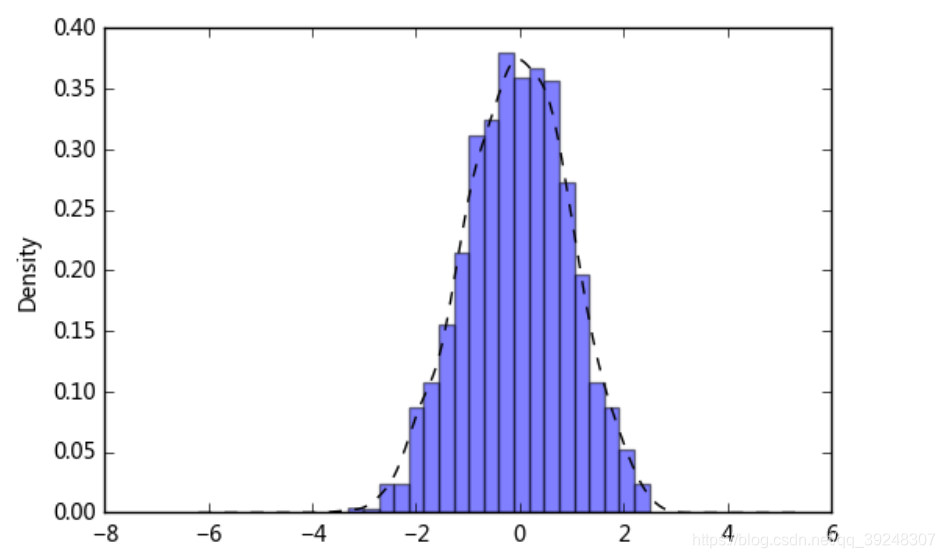
1.直方图+密度图
s = pd.Series(np.random.randn(1000))
s.hist(bins = 20,
       histtype = 'bar',
       align = 'mid',
       orientation = 'vertical',
       alpha=0.5,
       normed =True)
# bin:箱子的宽度
# normed 标准化,配合密度图
# histtype 风格,bar,barstacked,step,stepfilled
# orientation 水平还是垂直{‘horizontal’, ‘vertical’}
# align : {‘left’, ‘mid’, ‘right’}, optional(对齐方式)

s.plot(kind='kde',style='k--')
# 密度图
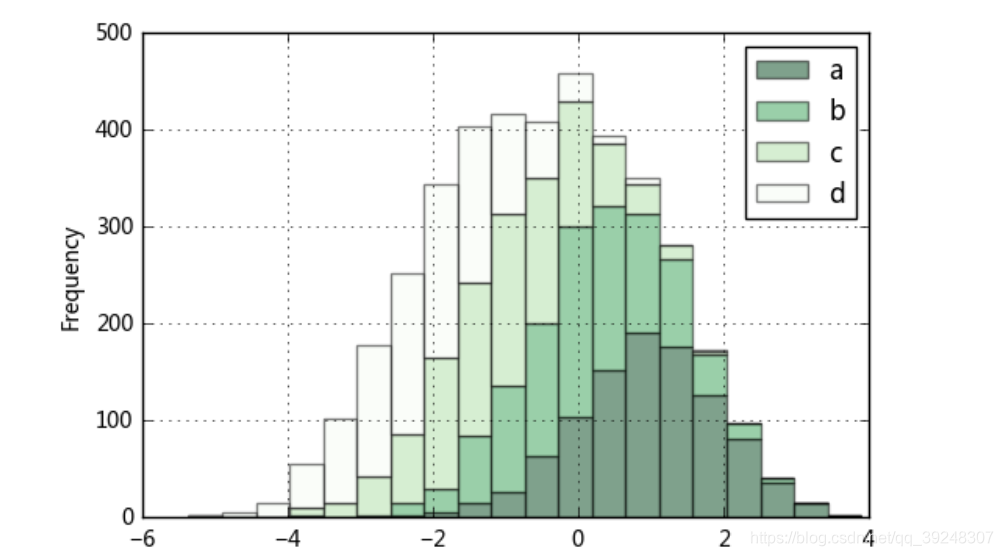
2.堆叠直方图:plt.plot.hixt(stacked=True)
plt.figure(num=1)
df = pd.DataFrame({'a': np.random.randn(1000) + 1, 'b': np.random.randn(1000),
'c': np.random.randn(1000) - 1, 'd': np.random.randn(1000)-2},
columns=['a', 'b', 'c','d'])
df.plot.hist(stacked=True,
bins=20,
colormap='Greens_r',
alpha=0.5,
grid=True)
# 使用DataFrame.plot.hist()和Series.plot.hist()方法绘制
# stacked:是否堆叠
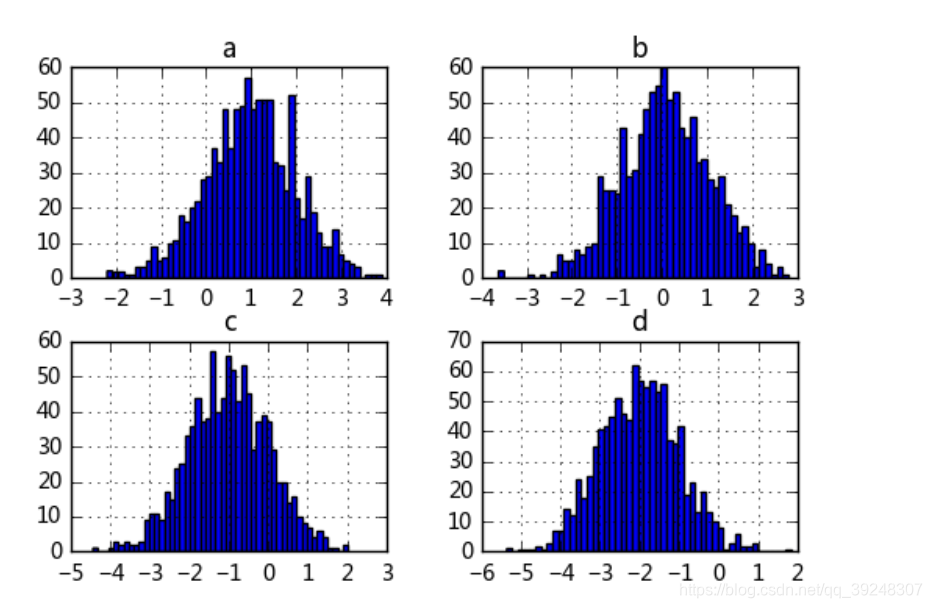
df.hist(bins=50)
# 生成多个直方图


 1832
1832


 被折叠的 条评论
为什么被折叠?
被折叠的 条评论
为什么被折叠?
 到【灌水乐园】发言


