


GeoServer + shp + Vue +OpenLayers使用
一 GeoServer安装
官网:http://geoserver.org/
安装选择war包,可直接部署至Tomcat webapps目录下
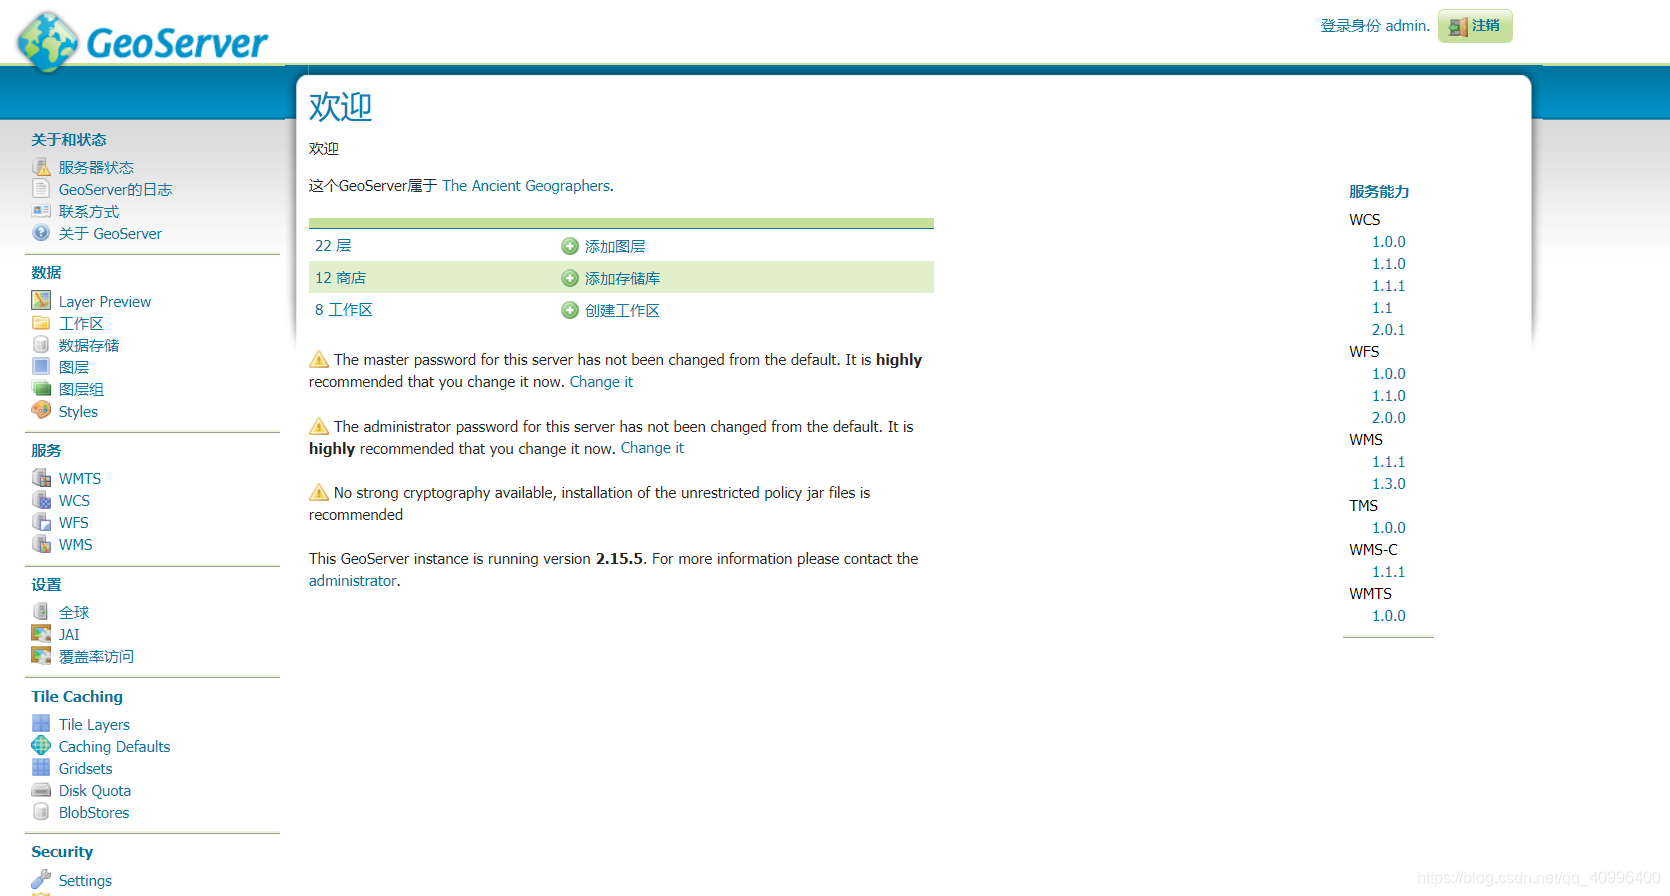
URL为http://ip:port/geoserver
默认账号为admin,密码为geoserver
登陆完成界面为:
二 发布shp文件
2.1 新建工作区
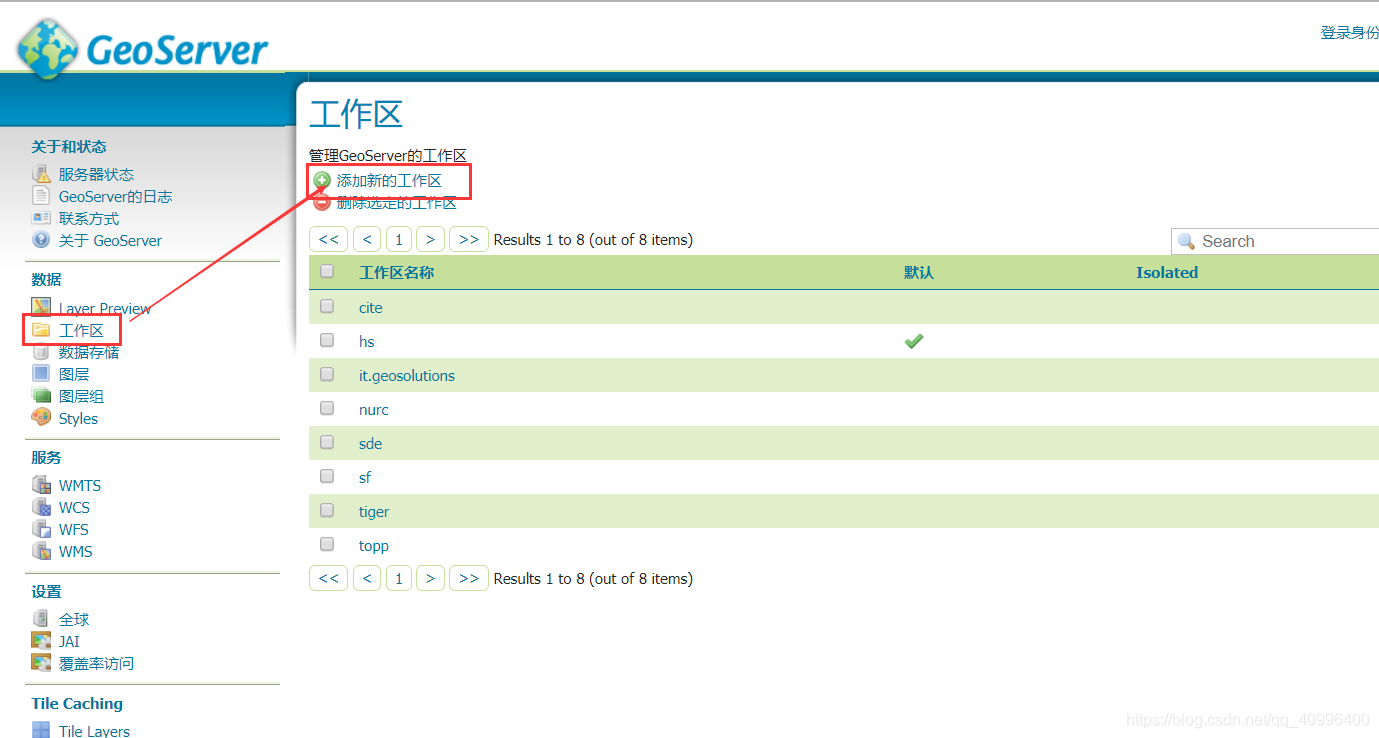
点击添加新的工作区按钮,进入页面:
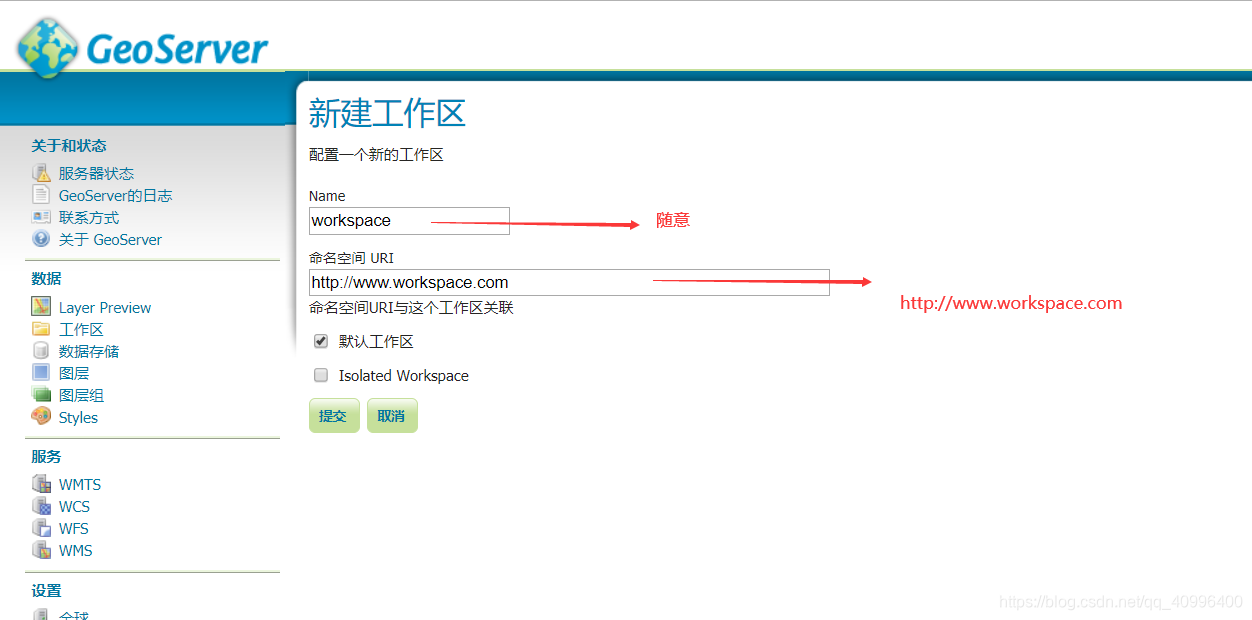
按图上设置即可。
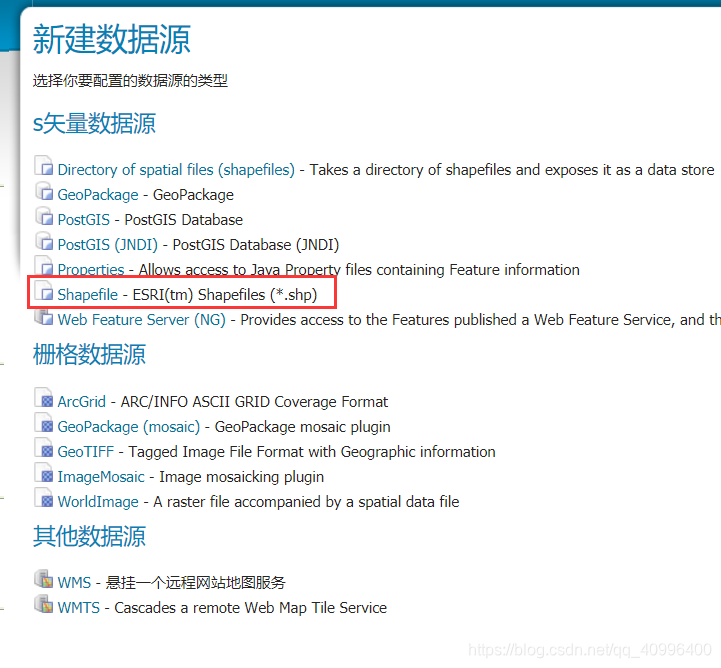
2.2 发布shp数据
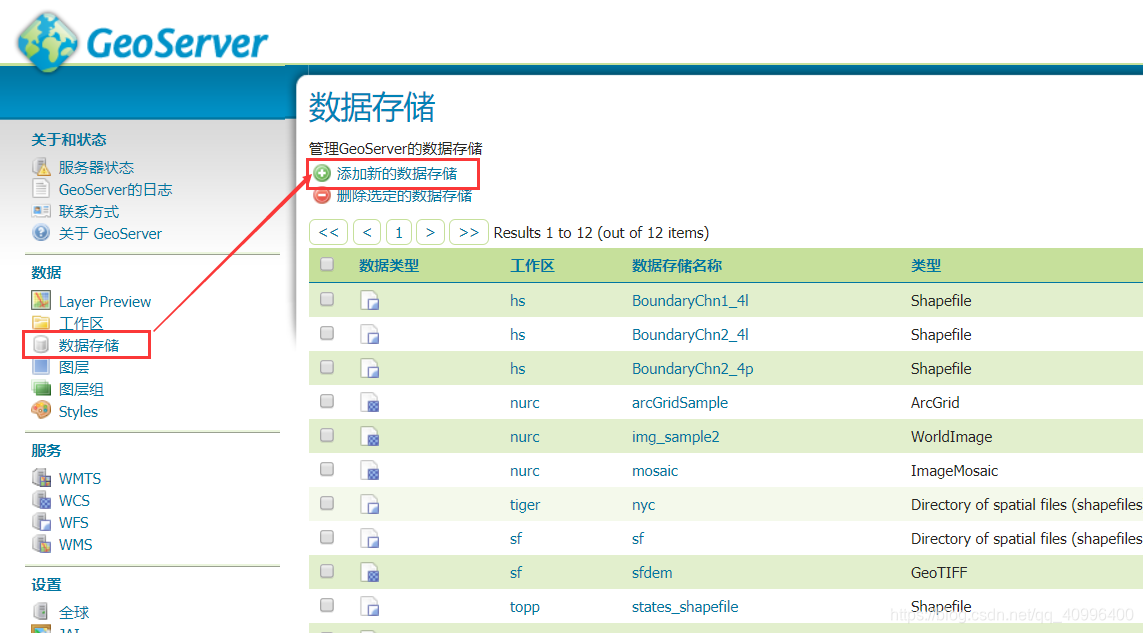
点击添加新的数据存储按钮,进入页面,选择shapefile。
然后按下图进行配置即可,请注意shp文件应该在geoserver所在电脑上,这个意思是如果使用远程服务器,应该首先将shp数据传输到远程服务器才能读取到。
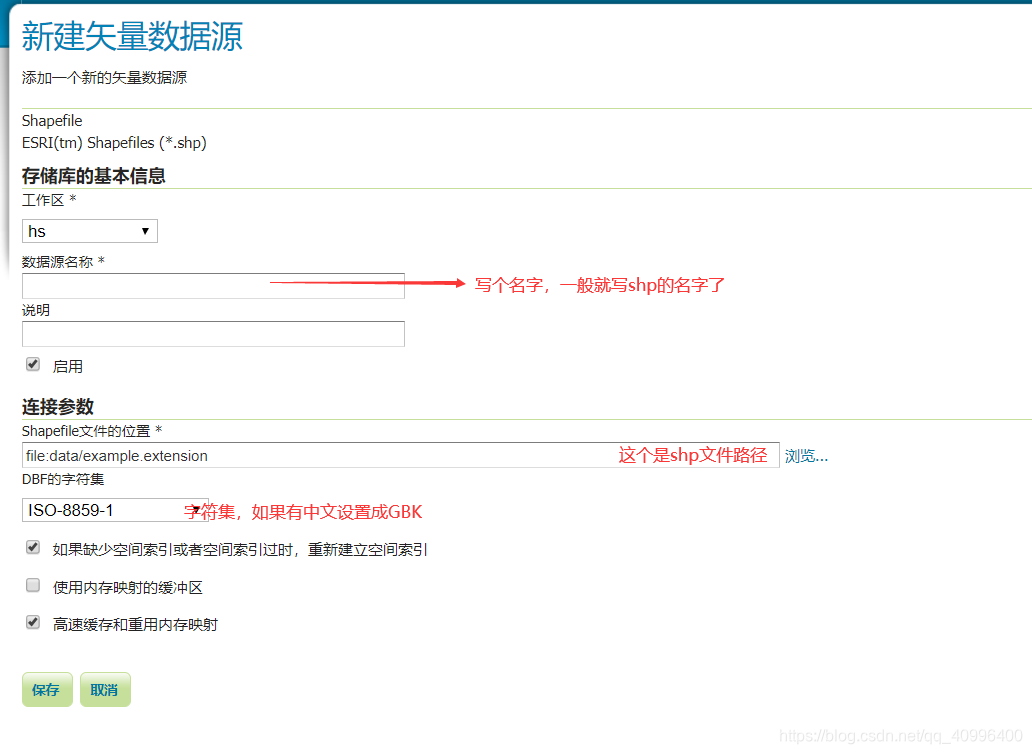
保存之后会跳转至以下页面:
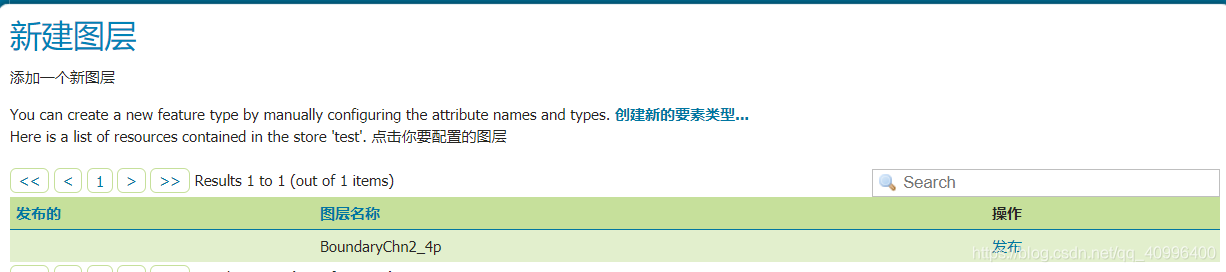
点击发布,进入下面的页面:
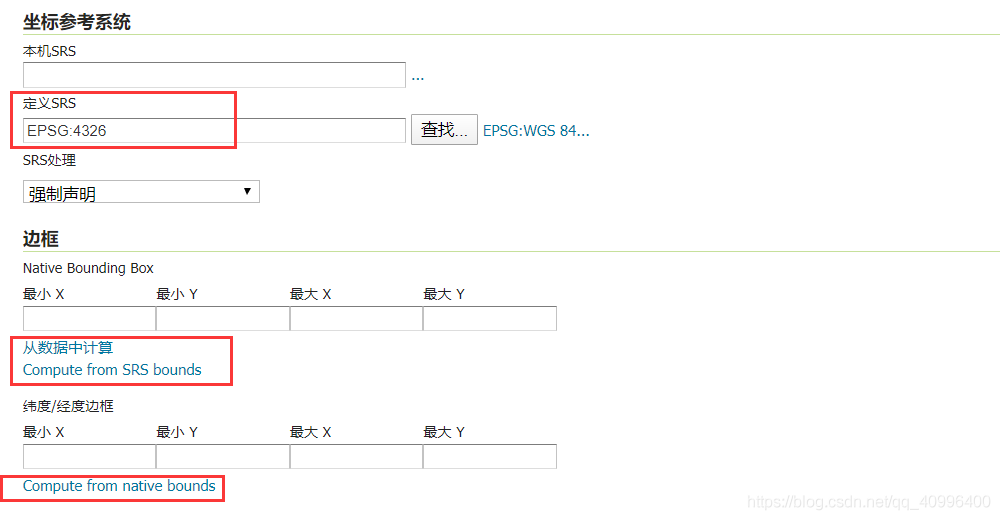
设置SRS为EPSG:4326,点击边框下的按钮,计算得出边界。
保存即可。
三 使用OpenLayers显示图像
本次实验使用vue进行开发,首先安装OpenLayers:
npm install ol
显示图像需要用到的很重要的参数是发布图像的URL,点击Layer Preview按钮,可进行数据图像预览,从而得到URL:
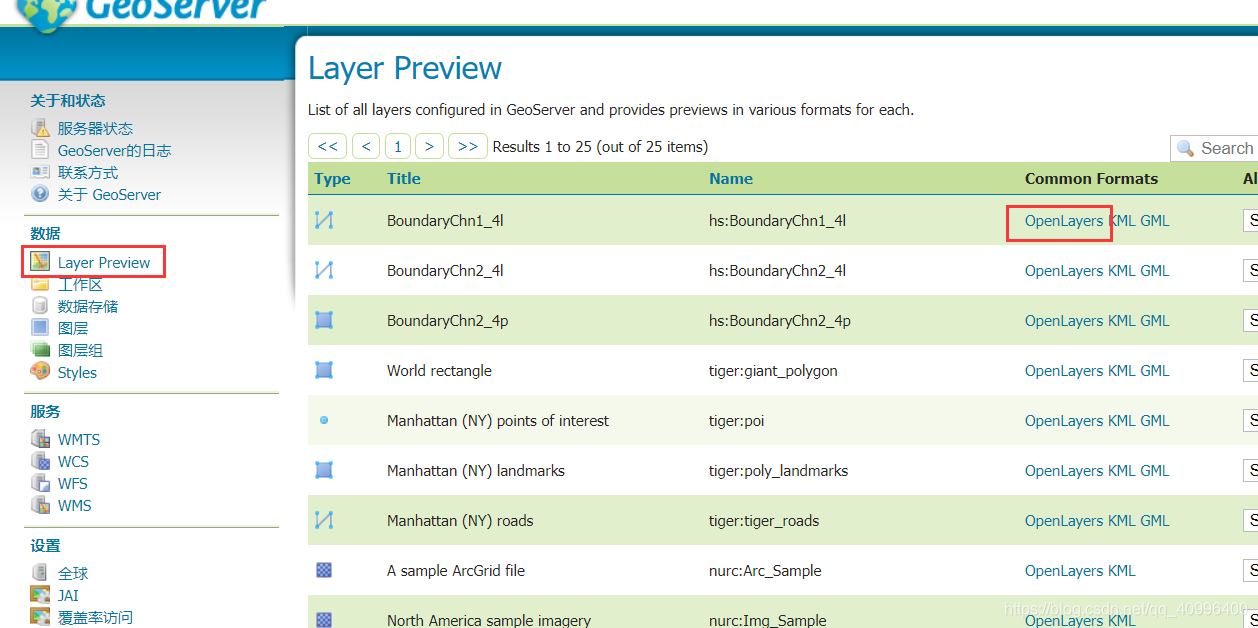
http://ip:port/geoserver/hs/wms?service=WMS&version=1.1.0&request=GetMap&layers=hs%3ABoundaryChn1_4l&bbox=73.44696044921875%2C3.408477306365967%2C135.08583068847656%2C53.557926177978516&width=768&height=624&srs=EPSG%3A4326&format=application/openlayers
这就很明白了,URL为:http://ip:port/geoserver/hs/wms。
还需要指定layers属性,指定bounds边界。
使用OpenLayers显示图像比较容易,官网文档中说的很明确了,下面贴出全部代码:
<template>
  <div id="map" ref="rootMap" class="map"></div>
</template>

<script>
import "ol/ol.css";
import Map from "ol/Map";
import View from "ol/View";
import TileLayer from "ol/layer/Tile";
import TileWMS from "ol/source/TileWMS";

export default {
  data() {
    return {
      map: null
    };
  },
  methods: {
    init() {
      var layers = [
        new TileLayer({
          extent: [// 边界
            73.44696044921875,
            3.408477306365967,
            135.08583068847656,
            53.557926177978516
          ],
          source: new TileWMS({
            url: "http://ip:port/geoserver/hs/wms",
            // Layers需要指定要显示的图层名
            params: { LAYERS: "hs:BoundaryChn1_4l", TILED: true },
           	// serverType明显为geoserver
            serverType: "geoserver",
            // Countries have transparency, so do not fade tiles:
            transition: 0
          })
        })
      ];
      this.map = new Map({
        layers: layers,
        target: "map",
        view: new View({
          projection: "EPSG:4326",
          center: [115, 39],
          zoom: 4
        })
      });
    }
  },
  mounted() {
    this.init();
  }
};
</script>

<style scoped>
.map {
  height: 100%;
}
</style>
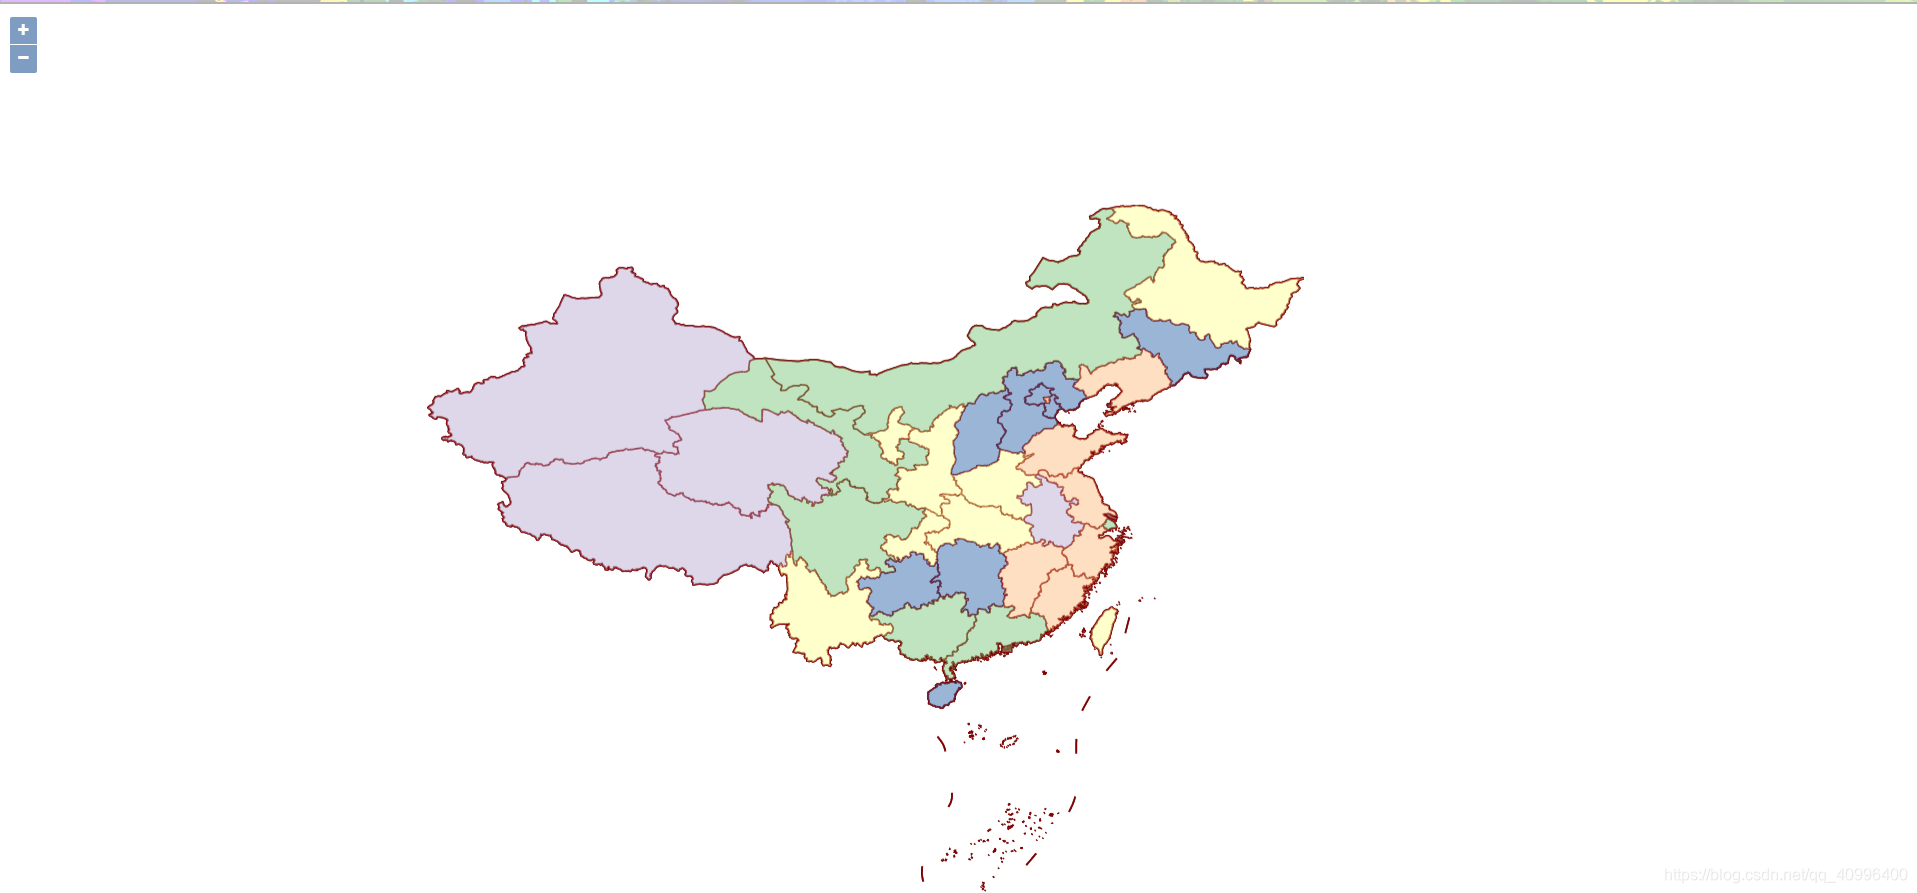
展示结果:


 1341
1341


 被折叠的 条评论
为什么被折叠?
被折叠的 条评论
为什么被折叠?
 到【灌水乐园】发言


