


 此博客展示了如何使用R语言的pacman、raster和rgdal包来处理NEON Landsat数据。作者首先设置工作目录,然后列出并加载指定路径下的NDVI文件,创建一个堆栈,并查看其坐标参考系统和分辨率。接着,绘制了NDVI时间序列图,并创建了每个NDVI栅格的直方图。最后,展示了一些特定日期的RGB图像,并通过循环遍历所有RGB图像进行显示。
library(pacman)
p_load(raster, rgdal)
wd <- "G:/Rdata/neon_data/NEONDSLandsatNDVI/NEON-DS-Landsat-NDVI/"
setwd(wd)

#create list of NDVI file paths
#assign path to object = cleaner code
NDVI_HARV_path <- paste0(wd, "HARV/2011/NDVI")
all_NDVI_HARV <- list.files(NDVI_HARV_path,
                            full.names = T,
                            pattern = ".tif$")
all_NDVI_HARV
# [1] "G:/Rdata/neon_data/NEONDSLandsatNDVI/NEON-DS-Landsat-NDVI/HARV/2011/NDVI/005_HARV_ndvi_crop.tif"
# [2] "G:/Rdata/neon_data/NEONDSLandsatNDVI/NEON-DS-Landsat-NDVI/HARV/2011/NDVI/037_HARV_ndvi_crop.tif"
# [3] "G:/Rdata/neon_data/NEONDSLandsatNDVI/NEON-DS-Landsat-NDVI/HARV/2011/NDVI/085_HARV_ndvi_crop.tif"
# [4] "G:/Rdata/neon_data/NEONDSLandsatNDVI/NEON-DS-Landsat-NDVI/HARV/2011/NDVI/133_HARV_ndvi_crop.tif"
# [5] "G:/Rdata/neon_data/NEONDSLandsatNDVI/NEON-DS-Landsat-NDVI/HARV/2011/NDVI/181_HARV_ndvi_crop.tif"
# [6] "G:/Rdata/neon_data/NEONDSLandsatNDVI/NEON-DS-Landsat-NDVI/HARV/2011/NDVI/197_HARV_ndvi_crop.tif"
# [7] "G:/Rdata/neon_data/NEONDSLandsatNDVI/NEON-DS-Landsat-NDVI/HARV/2011/NDVI/213_HARV_ndvi_crop.tif"
# [8] "G:/Rdata/neon_data/NEONDSLandsatNDVI/NEON-DS-Landsat-NDVI/HARV/2011/NDVI/229_HARV_ndvi_crop.tif"
# [9] "G:/Rdata/neon_data/NEONDSLandsatNDVI/NEON-DS-Landsat-NDVI/HARV/2011/NDVI/245_HARV_ndvi_crop.tif"
# [10] "G:/Rdata/neon_data/NEONDSLandsatNDVI/NEON-DS-Landsat-NDVI/HARV/2011/NDVI/261_HARV_ndvi_crop.tif"
# [11] "G:/Rdata/neon_data/NEONDSLandsatNDVI/NEON-DS-Landsat-NDVI/HARV/2011/NDVI/277_HARV_ndvi_crop.tif"
# [12] "G:/Rdata/neon_data/NEONDSLandsatNDVI/NEON-DS-Landsat-NDVI/HARV/2011/NDVI/293_HARV_ndvi_crop.tif"
# [13] "G:/Rdata/neon_data/NEONDSLandsatNDVI/NEON-DS-Landsat-NDVI/HARV/2011/NDVI/309_HARV_ndvi_crop.tif"

NDVI_HARV_stack <- stack(all_NDVI_HARV)
object.size(NDVI_HARV_stack)
# 193304 bytes

#view crs of raster
crs(NDVI_HARV_stack)
# CRS arguments:
  # +proj=utm +zone=19 +ellps=WGS84 +units=m +no_defs

res(NDVI_HARV_stack)
# Plotting Time Series Data
plot(NDVI_HARV_stack,
     zlim = c(1500,10000),
     nc = 4  #每行图的个数
     )

NDVI_HARV_stack <- NDVI_HARV_stack/10000
plot(NDVI_HARV_stack,
     zlim = c(.15,1),
     nc = 4)

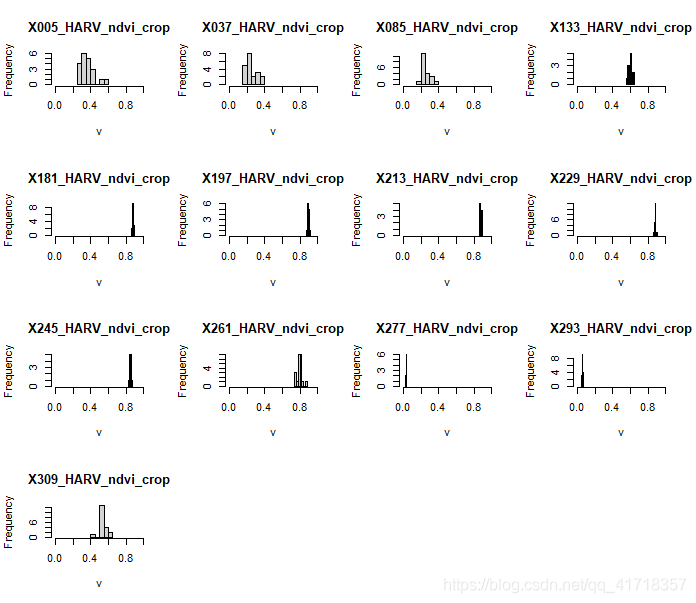
#create histogram of each raster
hist(NDVI_HARV_stack,
     xlim = c(0, 1))
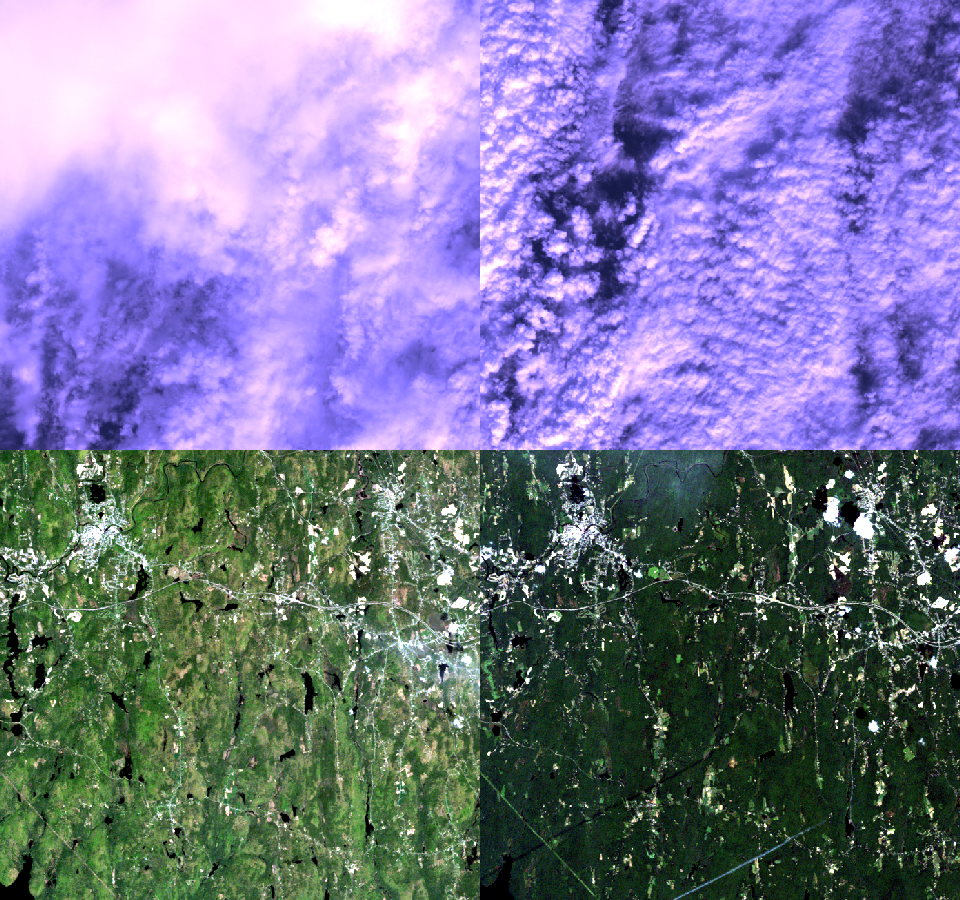
#open up some images
RGB_277 <-
  stack(paste0(wd, "HARV/2011/RGB/277_HARV_landRGB.tif"))
RGB_293 <-
  stack(paste0(wd, "HARV/2011/RGB/293_HARV_landRGB.tif"))
RGB_133 <-
  stack(paste0(wd, "HARV/2011/RGB/133_HARV_landRGB.tif"))
RGB_197 <-
  stack(paste0(wd, "HARV/2011/RGB/197_HARV_landRGB.tif"))
par(mfrow=c(2,2))
plotRGB(RGB_277)
plotRGB(RGB_293)
plotRGB(RGB_133,stretch="lin")
plotRGB(RGB_197,stretch="lin")
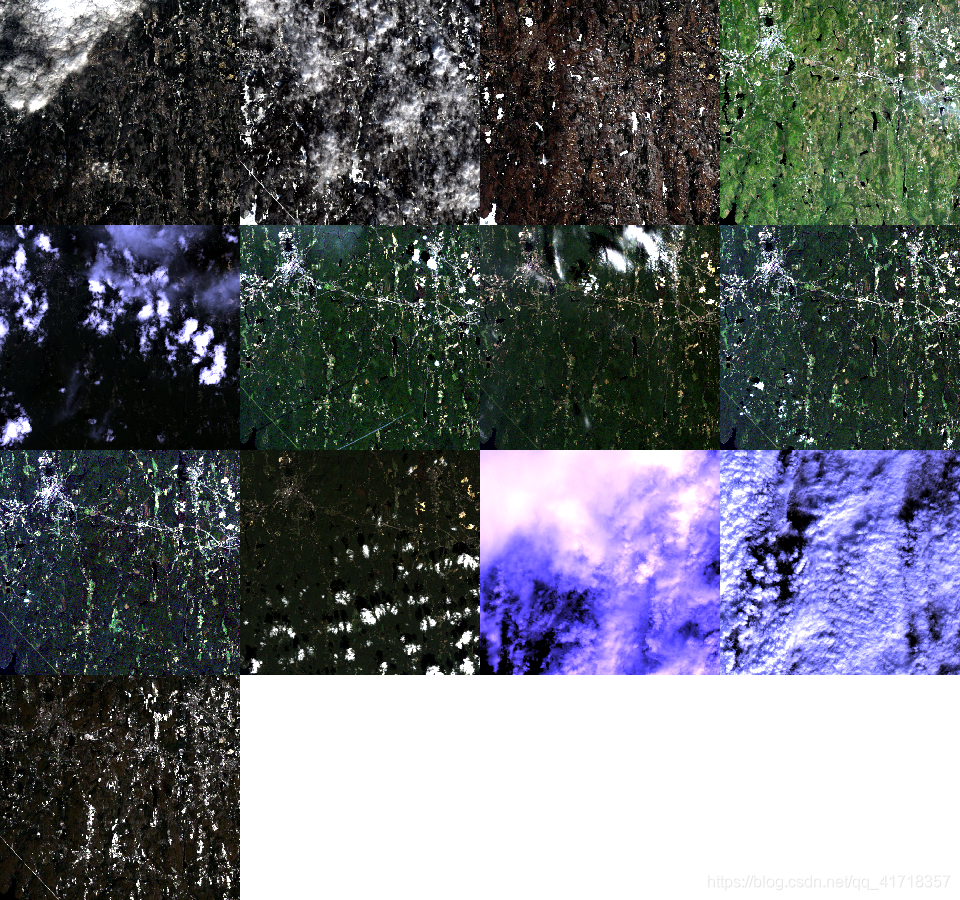
#create a layout
par(mfrow=c(4,4))
#Super efficient code-plot using a loop
RGB_HARV_allCropped <- list.files("HARV/2011/RGB",
                                  full.names = T,
                                  pattern = ".tif$")

for(aFile in RGB_HARV_allCropped){
  RGB.stack <- stack(aFile)
  plotRGB(RGB.stack,stretch = "lin")
}


 426
426

 被折叠的 条评论
为什么被折叠?
被折叠的 条评论
为什么被折叠?
 到【灌水乐园】发言


