


简谐波传播
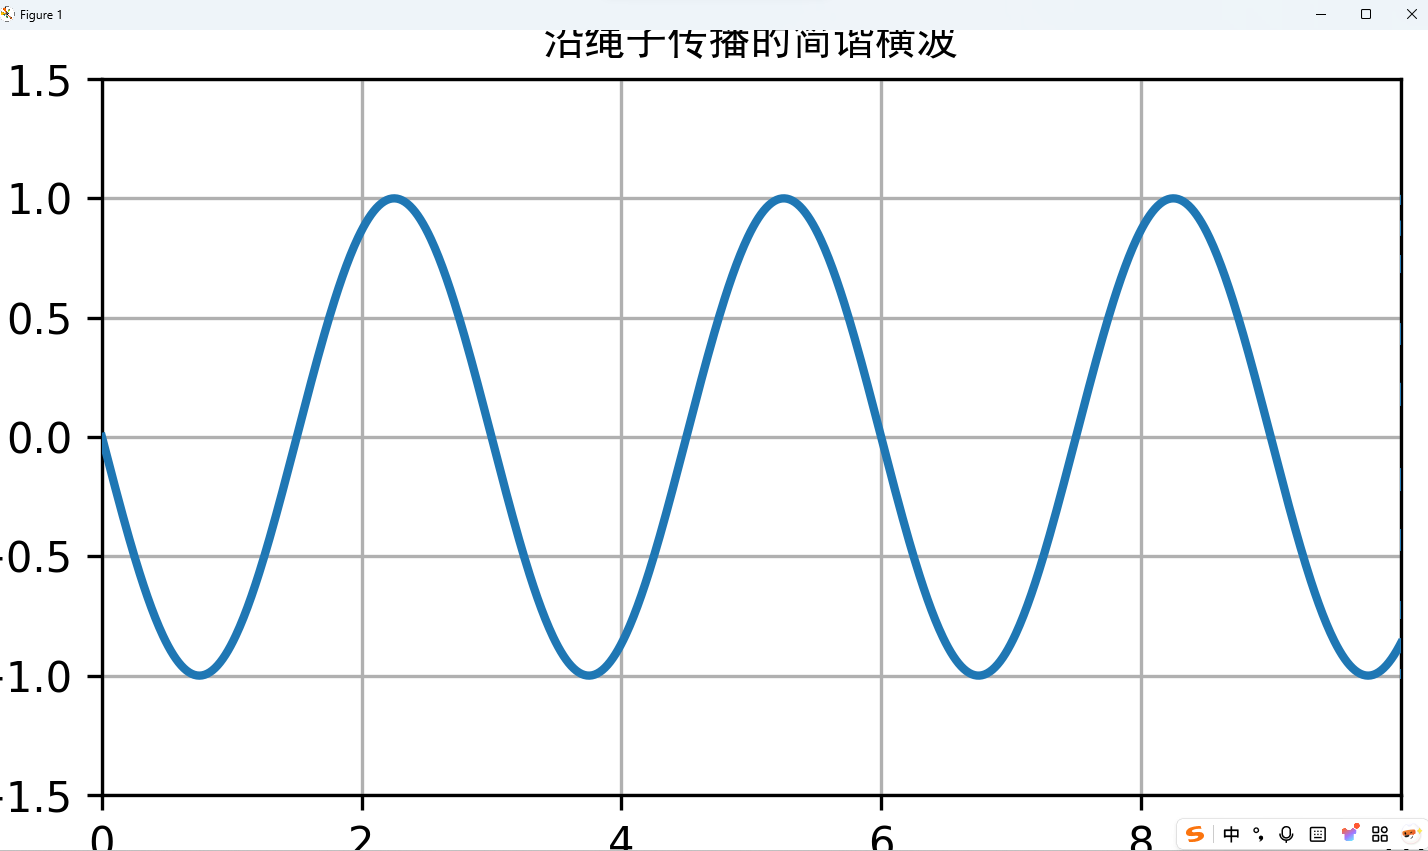
绘制沿绳子传播的简谐横波,展示波形随时间的变化。
import numpy as np
import matplotlib.pyplot as plt
from matplotlib.animation import FuncAnimation

# 设置图片清晰度
plt.rcParams['figure.dpi'] = 300

# 创建画布和子图
fig, ax = plt.subplots(figsize=(10, 6))
x = np.linspace(0, 10, 1000)  # 空间范围
line, = ax.plot(x, np.sin(x), lw=2)  # 初始波形

# 设置坐标轴范围和标签
ax.set_xlim(0, 10)
ax.set_ylim(-1.5, 1.5)
ax.set_xlabel('位置 (m)', fontproperties="SimHei")
ax.set_ylabel('位移 (m)', fontproperties="SimHei")
ax.set_title('沿绳子传播的简谐横波', fontproperties="SimHei")
ax.grid(True)

# 波动参数
amplitude = 1.0      # 振幅
frequency = 2.0      # 频率 (Hz)
wavelength = 3.0     # 波长 (m)
wave_speed = frequency * wavelength  # 波速 (m/s)

# 更新函数,用于动画每一帧的绘制
def update(frame):
    time = frame / 20.0  # 模拟时间
    # 简谐波方程: y = A*sin(kx - ωt)
    k = 2 * np.pi / wavelength  # 波数
    omega = 2 * np.pi * frequency  # 角频率
    y = amplitude * np.sin(k * x - omega * time)
    line.set_ydata(y)
    return line,

# 创建动画
ani = FuncAnimation(fig, update, frames=np.arange(0, 100), interval=50, blit=True)

# 显示动画
plt.tight_layout()
plt.show()

# 如果需要保存动画,取消下面一行的注释
ani.save('simple_harmonic_wave.gif', writer='pillow', fps=20)


 被折叠的 条评论
为什么被折叠?
被折叠的 条评论
为什么被折叠?
 到【灌水乐园】发言


