


线性回归
基础知识
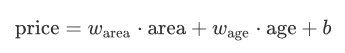
模型
为了简单起见,这里我们假设价格只取决于房屋状况的两个因素,即面积(平方米)和房龄(年)。接下来我们希望探索价格与这两个因素的具体关系。线性回归假设输出与各个输入之间是线性关系:

数据集
我们通常收集一系列的真实数据,例如多栋房屋的真实售出价格和它们对应的面积和房龄。我们希望在这个数据上面寻找模型参数来使模型的预测价格与真实价格的误差最小。在机器学习术语里,该数据集被称为训练数据集(training data set)或训练集(training set),一栋房屋被称为一个样本(sample),其真实售出价格叫作标签(label),用来预测标签的两个因素叫作特征(feature)。特征用来表征样本的特点。
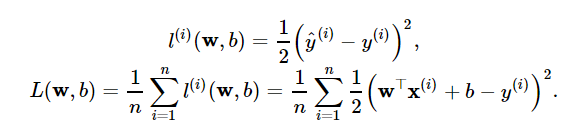
损失函数
在模型训练中,我们需要衡量价格预测值与真实值之间的误差。通常我们会选取一个非负数作为误差,且数值越小表示误差越小。一个常用的选择是平方函数。 它在评估索引为
i
i
i 的样本误差的表达式为:
优化函数 - 随机梯度下降
当模型和损失函数形式较为简单时,上面的误差最小化问题的解可以直接用公式表达出来。这类解叫作解析解(analytical solution)。本节使用的线性回归和平方误差刚好属于这个范畴。然而,大多数深度学习模型并没有解析解,只能通过优化算法有限次迭代模型参数来尽可能降低损失函数的值。这类解叫作数值解(numerical solution)。
在求数值解的优化算法中,小批量随机梯度下降(mini-batch stochastic gradient descent)在深度学习中被广泛使用。它的算法很简单:先选取一组模型参数的初始值,如随机选取;接下来对参数进行多次迭代,使每次迭代都可能降低损失函数的值。在每次迭代中,先随机均匀采样一个由固定数目训练数据样本所组成的小批量(mini-batch) ,然后求小批量中数据样本的平均损失有关模型参数的导数(梯度),最后用此结果与预先设定的一个正数的乘积作为模型参数在本次迭代的减小量。

矢量计算
在模型训练或预测时,我们常常会同时处理多个数据样本并用到矢量计算。在介绍线性回归的矢量计算表达式之前,让我们先考虑对两个向量相加的两种方法。
向量相加的一种方法是,将这两个向量按元素逐一做标量加法。
向量相加的另一种方法是,将这两个向量直接做矢量加法。
代码实现
import torch
import time

# init variable a, b as 1000 dimension vector
n = 1000
a = torch.ones(n)
b = torch.ones(n)
# define a timer class to record time
class Timer(object):
    """Record multiple running times."""
    def __init__(self):
        self.times = []
        self.start()

    def start(self):
        # start the timer
        self.start_time = time.time()

    def stop(self):
        # stop the timer and record time into a list
        self.times.append(time.time() - self.start_time)
        return self.times[-1]

    def avg(self):
        # calculate the average and return
        return sum(self.times)/len(self.times)

    def sum(self):
        # return the sum of recorded time
        return sum(self.times)
首先将两个向量使用for循环按元素逐一做标量加法。
timer = Timer()
c = torch.zeros(n)
for i in range(n):
    c[i] = a[i] + b[i]
'%.5f sec' % timer.stop()
'0.01115 sec'
另外是使用torch来将两个向量直接做矢量加法:
timer.start()
d = a + b
'%.5f sec' % timer.stop()
'0.00019 sec'
可见后者比前者更快。
线性回归模型从零开始的实现
首先导入包:
# import packages and modules
%matplotlib inline
import torch
from IPython import display
from matplotlib import pyplot as plt
import numpy as np
import random

print(torch.__version__)
1.3.0
生成数据集:
使用线性模型来生成数据集,生成一个1000个样本的数据集,下面是用来生成数据的线性关系:
# set input feature number
num_inputs = 2
# set example number
num_examples = 1000

# set true weight and bias in order to generate corresponded label
true_w = [2, -3.4]
true_b = 4.2

features = torch.randn(num_examples, num_inputs,
                      dtype=torch.float32)
labels = true_w[0] * features[:, 0] + true_w[1] * features[:, 1] + true_b
labels += torch.tensor(np.random.normal(0, 0.01, size=labels.size()),
                       dtype=torch.float32)
plt.scatter(features[:, 1].numpy(), labels.numpy(), 1);

读取数据集
def data_iter(batch_size, features, labels):
    num_examples = len(features)
    indices = list(range(num_examples))
    random.shuffle(indices)  # random read 10 samples
    for i in range(0, num_examples, batch_size):
        j = torch.LongTensor(indices[i: min(i + batch_size, num_examples)]) # the last time may be not enough for a whole batch
        yield  features.index_select(0, j), labels.index_select(0, j)
batch_size = 10

for X, y in data_iter(batch_size, features, labels):
    print(X, '\n', y)
    break
tensor([[ 0.6624, -0.3877],
        [-0.6765,  0.1546],
        [ 0.6929,  1.2454],
        [ 0.5670,  0.1939],
        [-1.2838, -1.1391],
        [-0.5085,  1.3619],
        [ 0.8670,  0.5125],
        [ 0.7736,  0.9599],
        [ 1.1189, -0.2153],
        [-1.1324,  0.9405]])
 tensor([ 6.8312,  2.3124,  1.3568,  4.6769,  5.5005, -1.4366,  4.1934,  2.4782,
         7.1770, -1.2610])
初始化模型参数
w = torch.tensor(np.random.normal(0, 0.01, (num_inputs, 1)), dtype=torch.float32)
b = torch.zeros(1, dtype=torch.float32)

w.requires_grad_(requires_grad=True)
b.requires_grad_(requires_grad=True)
tensor([0.], requires_grad=True)
定义模型
def linreg(X, w, b):
    return torch.mm(X, w) + b
定义损失函数
def squared_loss(y_hat, y):
    return (y_hat - y.view(y_hat.size())) ** 2 / 2
定义优化函数
def sgd(params, lr, batch_size):
    for param in params:
        param.data -= lr * param.grad / batch_size # ues .data to operate param without gradient track
训练
# super parameters init
lr = 0.03
num_epochs = 5

net = linreg
loss = squared_loss

# training
for epoch in range(num_epochs):  # training repeats num_epochs times
    # in each epoch, all the samples in dataset will be used once

    # X is the feature and y is the label of a batch sample
    for X, y in data_iter(batch_size, features, labels):
        l = loss(net(X, w, b), y).sum()
        # calculate the gradient of batch sample loss
        l.backward()
        # using small batch random gradient descent to iter model parameters
        sgd([w, b], lr, batch_size)
        # reset parameter gradient
        w.grad.data.zero_()
        b.grad.data.zero_()
    train_l = loss(net(features, w, b), labels)
    print('epoch %d, loss %f' % (epoch + 1, train_l.mean().item()))
epoch 1, loss 0.033529
epoch 2, loss 0.000127
epoch 3, loss 0.000052
epoch 4, loss 0.000052
epoch 5, loss 0.000052
w, true_w, b, true_b
(tensor([[ 2.0001],
         [-3.3995]], requires_grad=True),
 [2, -3.4],
 tensor([4.1994], requires_grad=True),
 4.2)


 被折叠的 条评论
为什么被折叠?
被折叠的 条评论
为什么被折叠?
 到【灌水乐园】发言


