


三维特殊图形
三维线性图: plot3(X,Y,Z)
三维条形图:bar3(Y),bar3(X,Y)
三维散点图:scatter3(x,y,z);scatter(x,y,z,s,c)s是面积,c是颜色
例题1.
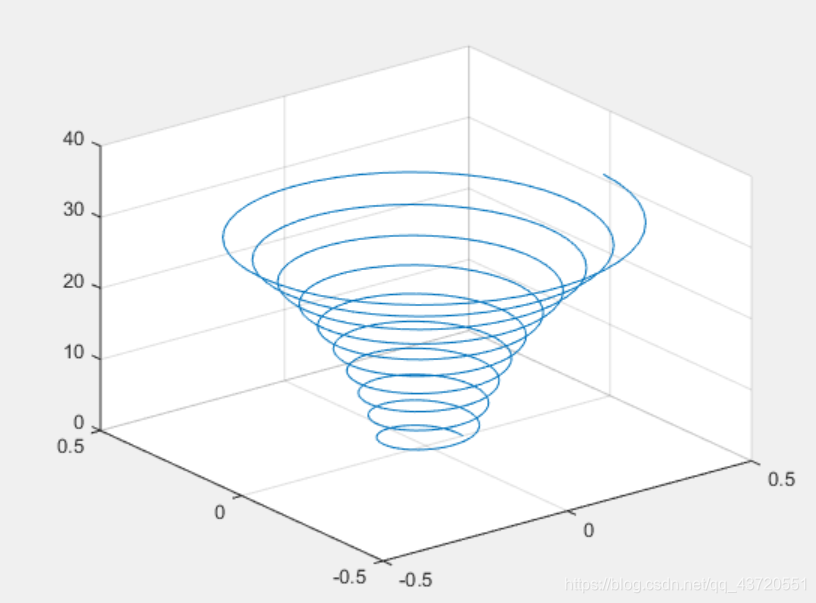
参数方程
x=0.1exp(t/20)cos(2t),
y=0.1exp(t/20)sin(2t),
z=t;
t的取值范围为0到10Π
>> t=0:pi/50:10*pi;
>> x=0.1*exp(t/20).*cos(2*t);
>> y=0.1*exp(t/20).*sin(2*t);
>> plot3(x,y,t),grid on
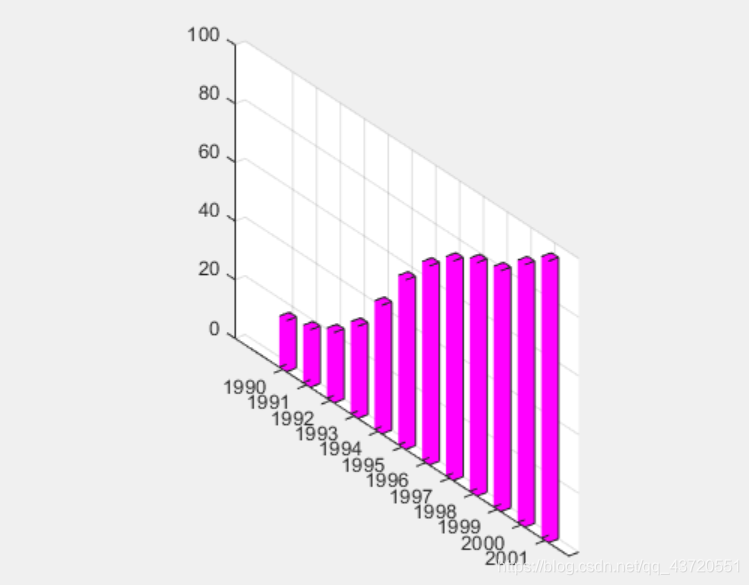
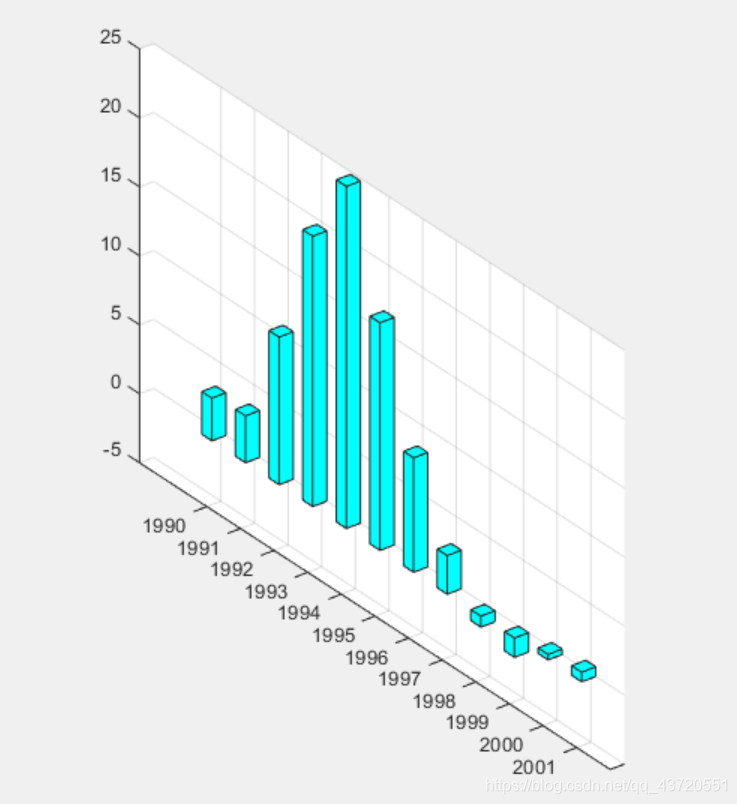
例题2
>> year=[1990 1991 1992 1993 1994 1995 1996 1997 1998 1999 2000 2001];
>> GDP=[17.4 19.58 23.94 31.38 43.8 57.73 67.79 74.77 79.55 82.05 89.4 95.93];
>> consu=[3.1 3.4 10.7 19.6 24.8 16.5 8.3 2.8 -0.8 -1.4 0.4 0.7];
>> colormap(spring)
>> bar3(year,GDP,0.3)
>> figure
>> colormap([0 1 1])
>> bar3(year,consu,0.3)
>>
例题3
绘制模拟喷泉
clear
for n=0:0.5:15
    r=5+5*n;
    theta=0:pi/12:2*pi;
    x=r*cos(theta);
    y=r*sin(theta);
    z=50*ones(size(x))*n-2*n.^2;
    c(1)=0;c(2)=0;c(1)=0;
    scatter3(x,y,z,3,c,'filled')
    hold on
end
axis([-80,80,-80,80,0,320])


 5928
5928


 被折叠的 条评论
为什么被折叠?
被折叠的 条评论
为什么被折叠?
 到【灌水乐园】发言


