


import matplotlib.pyplot as plt
x_point = [2,-2]
y_point = [2,-2]
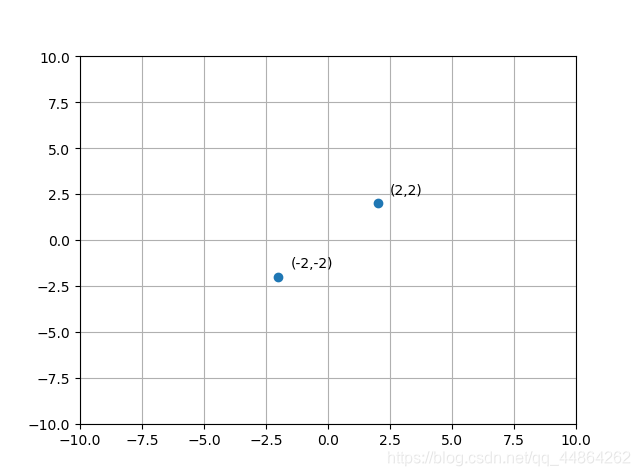
plt.scatter(x_point,y_point)
plt.xlim(-10,10) #x坐标轴范围-10~10
plt.ylim(-10,10)
#第一个参数为标记文本,第二个参数为标记对象的坐标,第三个参数为标记位置
plt.annotate('(2,2)', xy=(2,2), xytext=(2.5,2.5))
plt.annotate('(-2,-2)', xy=(-2,-2), xytext=(-1.5,-1.5))
plt.grid()#网格线显示
plt.show()


 6546
6546


 被折叠的 条评论
为什么被折叠?
被折叠的 条评论
为什么被折叠?
 到【灌水乐园】发言


