import * as echarts from 'echarts';
var chartDom = document.getElementById('main');
var myChart = echarts.init(chartDom);
var option;
let data1 = [320, 302, 341, 374, 120, 132, 101];
let data2 = [390, 450, 420, 134, 190, 230, 210];
option = {
tooltip: {
trigger: 'axis',
axisPointer: {
type: 'shadow'
}
},
legend: {
data: ['Profit', 'Expenses', 'Income']
},
grid: [
{
top: '10%',
width: '80%',
height: '40%',
containLabel: false
},
// {
// top: '40%',
// width: '80%',
// height:'20%',
// },
{
top: '50%',
width: '80%',
height: '40%',
containLabel: false
}
],
xAxis: [
{
type: 'category',
position: 'bottom',
inverse: false,
gridIndex: 0,
axisLabel: {
show: false // 这里设置不显示x轴名称
},
axisTick: {
show: false // 这里设置为 false 即可去掉 x 轴的刻度线
}
},
{
type: 'category',
position: 'top',
inverse: false,
gridIndex: 1,
axisLabel: {
show: false // 这里设置不显示x轴名称
},
axisTick: {
show: false // 这里设置为 false 即可去掉 x 轴的刻度线
}
}
],
yAxis: [
{
type: 'value',
gridIndex: 0,
axisTick: {
show: false
}
// data: ['Mon', 'Tue', 'Wed', 'Thu', 'Fri', 'Sat', 'Sun']
},
{
gridIndex: 1,
position: 'center',
inverse: true,
axisLabel: {
show: true,
// align: 'center',
// padding: [8, 0, 0, 0],
fontSize: 12,
color: `#262C41`
},
axisLine: {
show: false
}
}
],
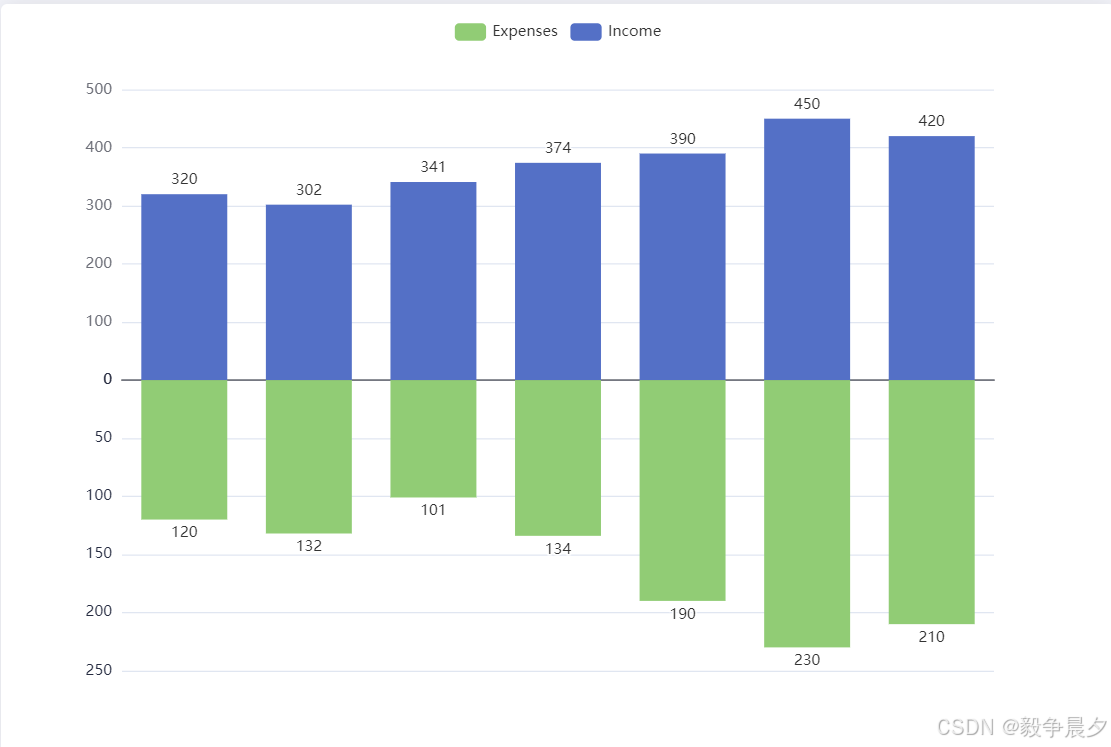
series: [
{
name: 'Income',
type: 'bar',
xAxisIndex: 0,
yAxisIndex: 0,
label: {
show: true, // 显示数值
position: 'top' // 数值显示在顶部
},
data: [320, 302, 341, 374, 390, 450, 420]
},
{
name: 'Expenses',
type: 'bar',
xAxisIndex: 1,
yAxisIndex: 1,
label: {
show: true, // 显示数值
position: 'bottom' //显示位置
},
data: [120, 132, 101, 134, 190, 230, 210]
}
]
};
option && myChart.setOption(option);


 5466
5466

 被折叠的 条评论
为什么被折叠?
被折叠的 条评论
为什么被折叠?
 到【灌水乐园】发言


