 Matlab读取.mat数据及{}与[]区别


过程+代码
首先加载.mat文件
load('E:\a1_s1_t1_depth_K2.mat')%括号中为.mat文件存储路径matlab工作区域会显示读取到的.mat中数据,此处d_iner为.mat中读取到的数据

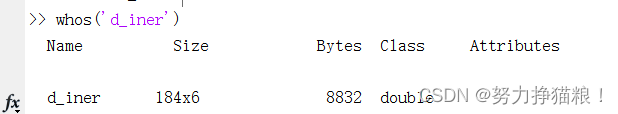
可通过 whos('d_iner')查看数据类型信息,这里d_iner为184x6的二维矩阵
接下来是将d_iner中数据按照列显示图像:
figure;
hold on;
colors = ['r'; 'g'; 'b'; 'c'; 'm'; 'y'];  %定义了6种颜色
name={'Ax','Ay','Az','Gx','Gy','Gz'};
for i=1:6
    plot(d_iner(:,i),colors(i));
end
hold off;

figure;  % 创建一个新的图形窗口
for i = 1:6
    subplot(3,2,i);  % 在 3x2 网格的第 i 位置创建子图
     plot(d_iner(:,i),colors(i));
最低0.47元/天 解锁文章


 5117
5117

 被折叠的 条评论
为什么被折叠?
被折叠的 条评论
为什么被折叠?
 到【灌水乐园】发言


