


按照给定特征划分数据集(当我们按照某个特征划分数据集时,就需要将所有符合要求的元素抽取出来)
def splitDataSet(dataSet, axis, value): #创建新的list对象(为了不修改原始数据集)
    retDataSet = []
    for featVec in dataSet:
        if featVec[axis] == value: #抽取符合特征的数据
            reducedFeatVec = featVec[:axis]
            reducedFeatVec.extend(featVec[axis+1:])
            retDataSet.append(reducedFeatVec)
    return retDataSet
append和extend函数:
a=[1,2,3]
b=[4,5,6]
a.append(b)
a
》》》[1, 2, 3, [4, 5, 6]] #第四个元素也是个列表
a=[1,2,3]
a.extend(b)
a
》》》[1, 2, 3, 4, 5, 6]
测试函数:
P38
选择最好的数据集划分方式
def chooseBestFeatureToSplit(dataSet): #选取特征,划分数据集,计算得最好的划分数据集的特征
    numFeatures = len(dataSet[0]) - 1
    baseEntropy = calcShannonEnt(dataSet) #计算整个数据集的原始熵,用于比较
    bestInfoGain = 0.0; bestFeature = -1
    for i in range(numFeatures):
        featList = [example[i] for example in dataSet] #创建新列表
        uniqueVals = set(featList) #变为集合类型(去重)
        newEntropy = 0.0
        for value in uniqueVals: #计算各种划分方式的信息熵
            subDataSet = splitDataSet(dataSet, i, value)
            prob = len(subDataSet)/float(len(dataSet))
            newEntropy += prob * calcShannonEnt(subDataSet)
        infoGain = baseEntropy - newEntropy
        if (infoGain > bestInfoGain): #计算最好的信息增益
            bestInfoGain = infoGain
            bestFeature = I
    return bestFeature
测试:
P39
after度量信息熵,有效划分数据集,
then将这些函数功能放一起,构建决策树
3.1.3递归构建决策树
import operatordef majorityCnt(classList):
classCount={} #用来存储classList中每个类标签出现的频率
for vote in classList:
if vote not in classCount.keys(): classCount[vote] = 0
classCount[vote] += 1
sortedClassCount = sorted(classCount.iteritems(),key=operator.itemgetter(1), reverse=True)
return sortedClassCount[0][0] #返回出现次数最多的分类名称创建树的函数代码
def createTree(dataSet,labels):
    classList = [example[-1] for example in dataSet]
    if classList.count(classList[0]) == len(classList):
        return classList[0] #所有类标签完全相同则停止划分,返回该类标签
    if len(dataSet[0]) == 1:
        return majorityCnt(classList) #遍历完所有特征时返回出现次数最多的
    bestFeat = chooseBestFeatureToSplit(dataSet) #存当前数据集选取的最好特征
    bestFeatLabel = labels[bestFeat]
    myTree = {bestFeatLabel:{}} #得到列表的所有属性值
    del(labels[bestFeat])
    featValues = [example[bestFeat] for example in dataSet]
    uniqueVals = set(featValues)
    for value in uniqueVals:
        subLabels = labels[:] #复制类标签
        myTree[bestFeatLabel][value] = createTree(splitDataSet\
                                                      (dataSet, bestFeat, value),subLabels)
    return myTree
3.2绘制树形图
31.Matplotlib注解工具:annotations
使用文本注解绘制树节点
# Author:J.Kong
import matplotlib.pyplot as plt
decisionNode = dict(boxstyle="sawtooth", fc="0.8") #定义文本框和箭头格式
leafNode = dict(boxstyle="round4", fc="0.8") #
arrow_args = dict(arrowstyle="<-")

def plotNode(nodeTxt, centerPt, parentPt, nodeType): #执行实际的绘图功能,绘制带箭头的注释
    createPlot.ax1.annotate(nodeTxt, xy=parentPt,xycoords='axes fraction',
    xytext=centerPt, textcoords='axes fraction',
    va="center", ha="center", bbox=nodeType, arrowprops=arrow_args)

def createPlot(): #创建新图形并清空绘图区,并画两个代表不同类型的树节点
    fig = plt.figure(1, facecolor='white')
    fig.clf()
    createPlot.ax1 = plt.subplot(111, frameon=False)
    plotNode('a decision node', (0.5, 0.1), (0.1, 0.5), decisionNode) #决策节点
    plotNode('a leaf node', (0.8, 0.1), (0.3, 0.8), leafNode) #叶节点
    plt.show()
测试结果:
import sys
sys.path.append("F:\k18\swhite")
import treePlotter
Backend Qt4Agg is interactive backend. Turning interactive mode on.
treePlotter.createPlot()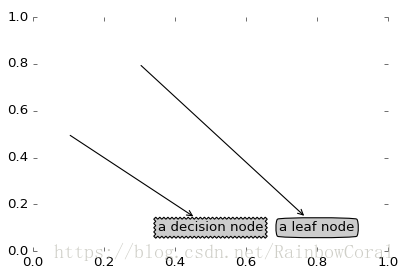
3.2.2构造注解树
我们要知道叶节点的数量-确定x轴长度-getNumLeafs()
树有多少层-确定y轴高度-getTreeDepth()


 2万+
2万+


 被折叠的 条评论
为什么被折叠?
被折叠的 条评论
为什么被折叠?
 到【灌水乐园】发言


