


kibana-8.12.0下载
问题1
[2025-08-19T17:37:28.709+08:00][INFO ][root] Kibana is starting
[2025-08-19T17:37:28.936+08:00][INFO ][node] Kibana process configured with roles: [background_tasks, ui]
[2025-08-19T17:38:01.245+08:00][INFO ][plugins-service] Plugin "cloudChat" is disabled.
[2025-08-19T17:38:01.269+08:00][INFO ][plugins-service] Plugin "cloudExperiments" is disabled.
[2025-08-19T17:38:01.270+08:00][INFO ][plugins-service] Plugin "cloudFullStory" is disabled.
[2025-08-19T17:38:01.950+08:00][INFO ][plugins-service] Plugin "profilingDataAccess" is disabled.
[2025-08-19T17:38:01.951+08:00][INFO ][plugins-service] Plugin "profiling" is disabled.
[2025-08-19T17:38:02.167+08:00][INFO ][plugins-service] Plugin "securitySolutionServerless" is disabled.
[2025-08-19T17:38:02.168+08:00][INFO ][plugins-service] Plugin "serverless" is disabled.
[2025-08-19T17:38:02.168+08:00][INFO ][plugins-service] Plugin "serverlessObservability" is disabled.
[2025-08-19T17:38:02.169+08:00][INFO ][plugins-service] Plugin "serverlessSearch" is disabled.
[2025-08-19T17:38:02.856+08:00][INFO ][root] Kibana is shutting down
[2025-08-19T17:38:02.884+08:00][FATAL][root] Reason: [config validation of [elasticsearch].username]: value of "elastic" is forbidden. This is a superuser account that cannot write to system indices that Kibana needs to function. Use a service account token instead. Learn more: https://www.elastic.co/guide/en/elasticsearch/reference/8.0/service-accounts.html
Error: [config validation of [elasticsearch].username]: value of "elastic" is forbidden. This is a superuser account that cannot write to system indices that Kibana needs to function. Use a service account token instead. Learn more: https://www.elastic.co/guide/en/elasticsearch/reference/8.0/service-accounts.html
    at ensureValidConfiguration (/data/isee/apps/kibana-8.12.2/node_modules/@kbn/core-config-server-internal/src/ensure_valid_configuration.js:23:11)
    at Server.preboot (/data/isee/apps/kibana-8.12.2/node_modules/@kbn/core-root-server-internal/src/server.js:162:5)
    at Root.preboot (/data/isee/apps/kibana-8.12.2/node_modules/@kbn/core-root-server-internal/src/root/index.js:47:14)
    at bootstrap (/data/isee/apps/kibana-8.12.2/node_modules/@kbn/core-root-server-internal/src/bootstrap.js:97:9)
    at Command.<anonymous> (/data/isee/apps/kibana-8.12.2/src/cli/serve/serve.js:241:5)

 FATAL  Error: [config validation of [elasticsearch].username]: value of "elastic" is forbidden. This is a superuser account that cannot write to system indices that Kibana needs to function. Use a service account token instead. Learn more: https://www.elastic.co/guide/en/elasticsearch/reference/8.0/service-accounts.html
禁止配置elastic用户
是 Kibana 8.x 的一项安全增强机制。从 Kibana 8.0 开始,禁止使用 elastic 超级用户 直接连接 Elasticsearch,因为:
elastic用户拥有全部权限,但不能写入 Kibana 所需的系统索引(如.kibana_*)- 出于最小权限原则和安全考虑,官方要求使用 Service Account Token 或 专用用户
✅ 正确解决方案:使用 Kibana System Service Account Token
✅ 方法 1:使用内置的 kibana_system 服务账户 Token(推荐)
Elasticsearch 8.x 内置了一个名为 kibana_system 的服务账户(Service Account),专门用于 Kibana 连接。
步骤 1:在 Elasticsearch 节点上生成 kibana_system 的 Token
# 进入 Elasticsearch 安装目录
cd /usr/share/elasticsearch  # 或你的路径

# 生成 token
./bin/elasticsearch-service-tokens create elastic/kibana kibana
warning: ignoring JAVA_HOME=/data/isee/apps/jdk8; using bundled JDK
SERVICE_TOKEN elastic/kibana/kibana = AAEAAWVsYXN0aWMva2liYW5hL2tpYmFuYTpGsssssssssssNOUxPTE9n
⚠️ 注意:这是
create-service-token,不是reset-password
输出示例:
Created service token ID: 12345abcde-6789-0fghij, elastic:kibana/kibana
To connect to Elasticsearch, use this Bearer token: AAAty3... (很长一串)
复制下这串 Bearer Token(以 AAAty3... 开头)
步骤 2:修改 kibana.yml,使用 Token 而不是用户名密码
# Kibana 服务配置
server.host: "0.0.0.0"
server.port: 5601

# ❌ 禁止使用 elastic 用户
# elasticsearch.username: "elastic"
# elasticsearch.password: "xxx"

# ✅ 正确方式:使用 Service Account Token
elasticsearch.serviceAccountToken: "AAAty3..."  # 就是上面生成的那串 Token

# Elasticsearch 地址
elasticsearch.hosts: ["http://10.10.10.10:9200"]

# 如果启用了 HTTPS
# elasticsearch.hosts: ["https://10.10.10.10:9200"]
# elasticsearch.ssl.certificateAuthorities: "/path/to/http_ca.crt"
📌 注意:
- 不要再设置
elasticsearch.username和elasticsearch.password- 使用
elasticsearch.serviceAccountToken替代
步骤 3:启动 Kibana
cd /usr/share/kibana
export NODE_OPTIONS=--openssl-legacy-provider
bin/kibana --allow-root
✅ 此时应该能正常启动,不再报错。
[2025-08-20T09:43:38.213+08:00][INFO ][root] Kibana is starting
[2025-08-20T09:43:38.470+08:00][INFO ][node] Kibana process configured with roles: [background_tasks, ui]

[2025-08-20T09:44:51.549+08:00][INFO ][plugins-service] Plugin "cloudChat" is disabled.
[2025-08-20T09:44:51.558+08:00][INFO ][plugins-service] Plugin "cloudExperiments" is disabled.
[2025-08-20T09:44:51.559+08:00][INFO ][plugins-service] Plugin "cloudFullStory" is disabled.
[2025-08-20T09:44:51.559+08:00][INFO ][plugins-service] Plugin "cloudGainsight" is disabled.
[2025-08-20T09:44:51.886+08:00][INFO ][plugins-service] Plugin "profilingDataAccess" is disabled.
[2025-08-20T09:44:51.887+08:00][INFO ][plugins-service] Plugin "profiling" is disabled.
[2025-08-20T09:44:51.965+08:00][INFO ][plugins-service] Plugin "securitySolutionServerless" is disabled.
[2025-08-20T09:44:51.966+08:00][INFO ][plugins-service] Plugin "serverless" is disabled.
[2025-08-20T09:44:51.966+08:00][INFO ][plugins-service] Plugin "serverlessObservability" is disabled.
[2025-08-20T09:44:51.967+08:00][INFO ][plugins-service] Plugin "serverlessSearch" is disabled.
[2025-08-20T09:44:52.525+08:00][INFO ][http.server.Preboot] http server running at http://10.10.10.10:15602
[2025-08-20T09:44:52.753+08:00][INFO ][plugins-system.preboot] Setting up [1] plugins: [interactiveSetup]
[2025-08-20T09:44:52.906+08:00][WARN ][config.deprecation] The default mechanism for Reporting privileges will work differently in future versions, which will affect the behavior of this cluster. Set "xpack.reporting.roles.enabled" to "false" to adopt the future behavior before upgrading.
[2025-08-20T09:44:55.848+08:00][INFO ][plugins-system.standard] Setting up [149] plugins: [devTools,translations
当观察到日志显示如下时,服务可用
[2025-08-20T09:50:13.636+08:00][INFO ][plugins.ruleRegistry] Installing component template .preview.alerts-security.alerts-mappings
[2025-08-20T09:50:15.144+08:00][INFO ][plugins.observabilityAIAssistant.service] Creating concrete write index - .kibana-observability-ai-assistant-kb-000001
[2025-08-20T09:50:15.859+08:00][INFO ][plugins.observabilityAIAssistant.service] Successfully set up index assets
[2025-08-20T09:50:16.152+08:00][INFO ][status.plugins.taskManager] taskManager plugin is now available: Task Manager is healthy
[2025-08-20T09:50:16.232+08:00][INFO ][status] Kibana is now available (was degraded)
[2025-08-20T09:50:19.541+08:00][INFO ][plugins.fleet] Fleet Usage: {"agents_enabled":true,"agents":{"total_enrolled":0,"healthy":0,"unhealthy":0,"offline":0,"inactive":0,"unenrolled":0,"total_all_statuses":0,"updating":0},"fleet_server":{"total_all_statuses":0,"total_enrolled":0,"healthy":0,"unhealthy":0,"offline":0,"updating":0,"num_host_urls":0}}
页面显示
问题汇总
问题1
Kibana security must be enabled to use Fleet这是一个 提示性信息(INFO 级别),不是错误,但它说明了一个关键问题:
✅ Fleet 插件要求 Kibana 的安全功能(Security)必须启用,否则无法正常使用。
🔍 问题原因
在 Elasticsearch + Kibana 8.x 中:
- Fleet 是管理 Elastic Agent 的核心功能(用于采集日志、指标、安全数据等)
- 出于安全考虑,Fleet 必须在 Kibana 安全认证开启的前提下才能使用
- 如果你关闭了安全功能,或未正确配置用户认证,Fleet 会禁用或提示此信息
✅ 解决方案:启用 Kibana 和 Elasticsearch 的安全功能
✅ 步骤 1:确认 elasticsearch.yml 启用了安全
在 Elasticsearch 配置文件中:
# elasticsearch.yml

# 启用安全功能(8.x 默认开启,但确认一下)
xpack.security.enabled: true

# 如果是单节点测试环境
discovery.type: single-node

# 允许外部访问
network.host: 0.0.0.0
http.port: 9200
⚠️ 修改后重启 Elasticsearch:
systemctl restart elasticsearch
✅ 步骤 2:确认 kibana.yml 启用了安全并正确连接
# kibana.yml

# Kibana 服务器
server.host: "0.0.0.0"
server.port: 5601

# 指向 Elasticsearch
elasticsearch.hosts: ["http://10.10.10.10:9200"]

# ✅ 必须配置服务账户 Token 或用户名密码
# 推荐方式:Service Account Token(8.12+)
elasticsearch.serviceAccountToken: "AAAty3...xyz"

# 或使用用户名密码(不推荐生产使用)
# elasticsearch.username: "kibana_user"
# elasticsearch.password: "your_password"

# 🔐 加密密钥(必须设置,否则 Fleet 无法启用)
xpack.security.encryptionKey: "a2b3c4d5e6f7g8h9i0j1k2l3m4n5o6p7"
xpack.encryptedSavedObjects.encryptionKey: "q8r9s0t1u2v3w4x5y6z7a8b9c0d1e2f3"
📌
encryptionKey是 Fleet 能否启用的关键!
xpack.security.encryptionKey这些值要如何生成呢。
使用 Kibana 自带命令生成(推荐 ✅)
Kibana 提供了一个专用命令来生成加密密钥:
cd /usr/share/kibana-8.12.0

# 生成一组推荐的加密密钥(包括多个插件所需)
bin/kibana-encryption-keys generate
输出示例:
xpack.security.encryptionKey: '9a8b7c6d5e4f3g2h1i0j9k8l7m6n5o4p'
xpack.encryptedSavedObjects.encryptionKey: '1z2y3x4w5v6u7t8s9r0q1p2o3n4m5l6k'
xpack.reporting.encryptionKey: '2a3b4c5d6e7f8g9h0i1j2k3l4m5n6o7p'
直接把这些复制到 kibana.yml 中即可。
实操:
# ./kibana-encryption-keys generate
Kibana is currently running with legacy OpenSSL providers enabled! For details and instructions on how to disable see https://www.elastic.co/guide/en/kibana/8.12/production.html#openssl-legacy-provider
## Kibana Encryption Key Generation Utility

The 'generate' command guides you through the process of setting encryption keys for:

xpack.encryptedSavedObjects.encryptionKey
    Used to encrypt stored objects such as dashboards and visualizations
    https://www.elastic.co/guide/en/kibana/current/xpack-security-secure-saved-objects.html#xpack-security-secure-saved-objects

xpack.reporting.encryptionKey
    Used to encrypt saved reports
    https://www.elastic.co/guide/en/kibana/current/reporting-settings-kb.html#general-reporting-settings

xpack.security.encryptionKey
    Used to encrypt session information
    https://www.elastic.co/guide/en/kibana/current/security-settings-kb.html#security-session-and-cookie-settings


Already defined settings are ignored and can be regenerated using the --force flag.  Check the documentation links for instructions on how to rotate encryption keys.
Definitions should be set in the kibana.yml used configure Kibana.

Settings:
xpack.encryptedSavedObjects.encryptionKey: 8a494ac5469823361a3fdaede66afe15
xpack.reporting.encryptionKey: 972c98ada7cbc70d7bec4fe46ec59e4e
xpack.security.encryptionKey: c79341f469a3f607d0ba697d9ec35047
✅ 这是官方推荐方式,最安全、最简单!
✅ 完整 kibana.yml 安全配置示例
server.host: "0.0.0.0"
server.port: 5601

elasticsearch.hosts: ["http://10.10.10.10:9200"]
elasticsearch.serviceAccountToken: "AAAty3...xyz"  # 或用户名密码

# 🔐 加密密钥(必须设置)
xpack.security.encryptionKey: "k3b8Y7v2Qw+9xZ6tR1nL5mX4pA0oN8qB3cV7dS9eF2hJ0kL5mN7oP1qR3sT6uV8wX0yZ"

# 🔐 用于加密保存的对象(如仪表盘、告警)
xpack.encryptedSavedObjects.encryptionKey: "a1b2c3d4e5f678901234567890abcdef1234567890abcdef1234567890abcdef"

# 🔐 用于 Reporting(报表)
xpack.reporting.encryptionKey: "z9y8x7w6v5u4t3s2r1q0p9o8n7m6l5k4"
📌 注意事项
| 项目 | 说明 |
|---|---|
| 🔁 重启生效 | 修改后必须重启 Kibana |
| 📁 备份密钥 | 一旦设置,不要随意更改,否则会话失效 |
| 🚫 不要泄露 | 密钥泄露会导致会话劫持风险 |
| 🔄 轮换密钥 | 如需轮换,建议逐步过渡,避免服务中断 |
✅ 验证是否生效
重启 Kibana 后,日志中不再出现:
WARN Generating a random key for xpack.security.encryptionKey说明你已成功配置。
✅ 步骤 3:确保用户有 Fleet 权限
你登录 Kibana 的用户必须拥有 Fleet 管理权限。
推荐角色:
superuser(超级用户)fleet_admin(Fleet 管理员)fleet_manager(Fleet 操作员)
创建一个有 Fleet 权限的用户示例:
curl -u elastic:你的密码 \
  -X PUT "http://10.10.10.10:9200/_security/user/fleet_admin" \
  -H "Content-Type: application/json" \
  -d'
{
  "password": "FleetPass123!",
  "roles": ["superuser"],
  "full_name": "Fleet Admin"
}'
🔐
superuser角色包含 Fleet 所需的所有权限。
✅ 步骤 4:重启 Kibana
# 如果是 systemd
sudo systemctl restart kibana

# 或手动重启
# cd /usr/share/kibana-8.12.0
# export NODE_OPTIONS=--openssl-legacy-provider
# nohup bin/kibana --allow-root > kibana.log 2>&1 &
✅ 步骤 5:登录 Kibana,检查 Fleet 是否可用
- 访问:
http://<kibana-ip>:5601 - 使用你创建的用户登录(如
fleet_admin) - 在左侧菜单中查看是否有 "Fleet" 选项
✅ 正常情况下,你会看到:
- Fleet
- Integrations
- Agent Policies
🛠️ 验证安全功能是否启用
1. 检查 Elasticsearch 安全状态
curl -X GET "http://10.10.10.10:9200/_xpack?human&pretty" -u elastic:你的密码返回中应包含:
"security": {
  "enabled": true,
  "available": true
}
📌 常见问题排查
| 问题 | 检查点 |
|---|---|
| 登录页面不出现 | xpack.security.enabled: true in ES |
| Fleet 菜单灰显或不可用 | 用户缺少 fleet 相关角色 |
| 提示“未授权” | encryptionKey 未设置 |
| 仍看到 INFO 提示 | 重启 Kibana 后会消失 |
✅ 总结:如何解决 "Kibana security must be enabled to use Fleet"
| 步骤 | 操作 |
|---|---|
| 1 | ✅ elasticsearch.yml 中 xpack.security.enabled: true |
| 2 | ✅ kibana.yml 中配置 serviceAccountToken 或用户名密码 |
| 3 | ✅ 设置 xpack.security.encryptionKey 和 encryptedSavedObjects.encryptionKey |
| 4 | ✅ 创建有 fleet_admin 或 superuser 角色的用户 |
| 5 | ✅ 重启 Kibana 和 Elasticsearch |
| 6 | ✅ 使用有权限的用户登录 Kibana |
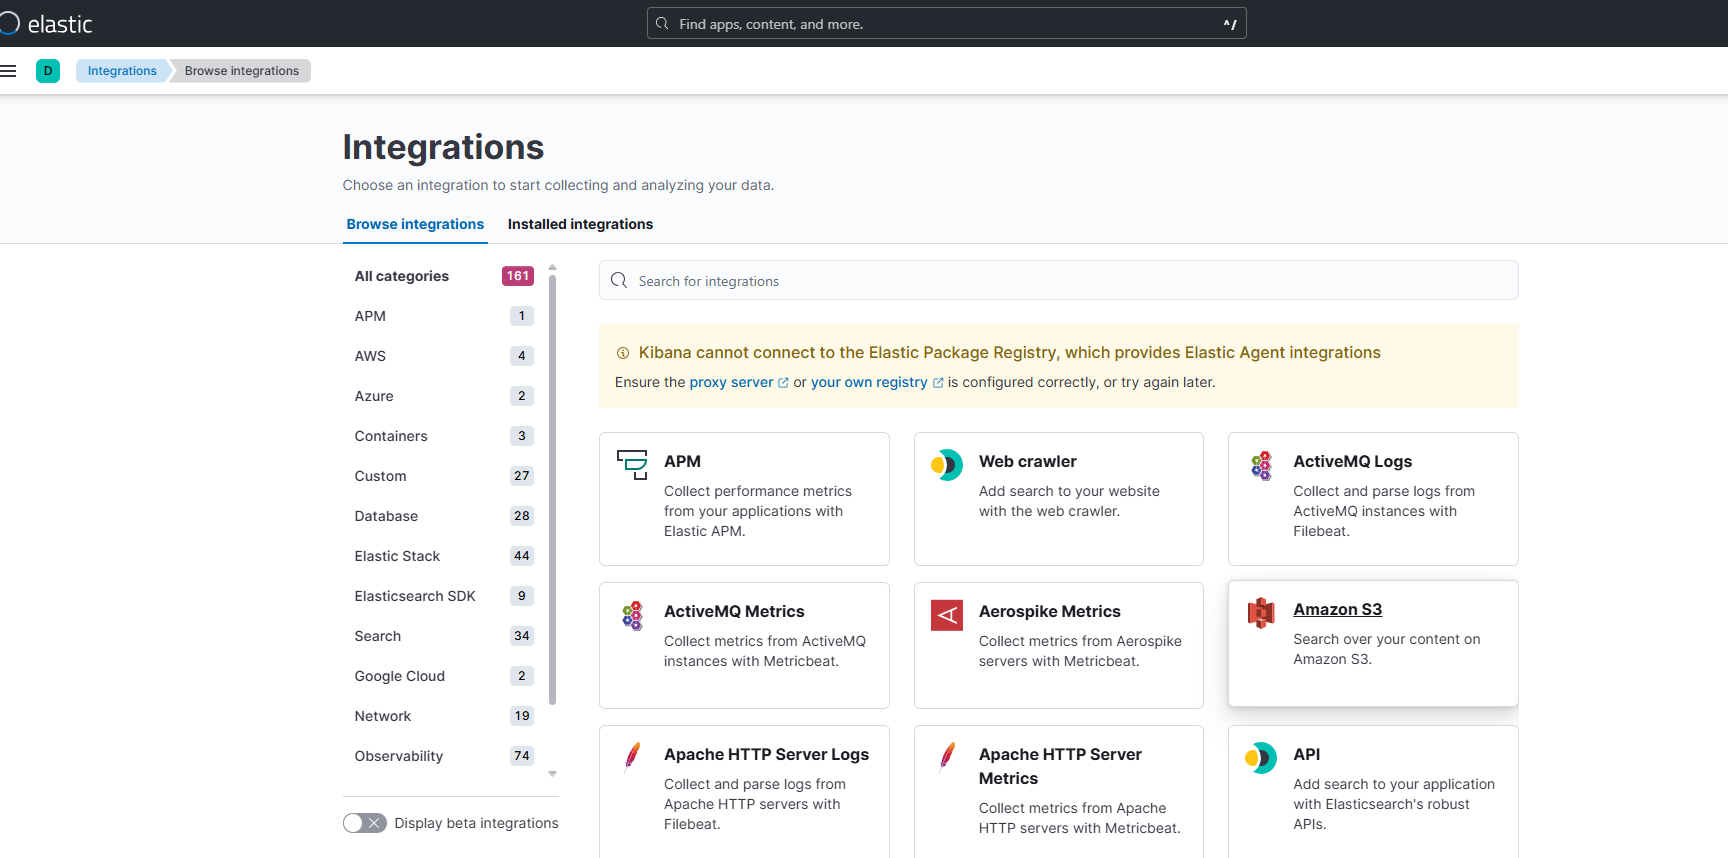
✅ 完成后,Fleet 就可以正常使用了,你就可以:
- 添加 Integration(如 Nginx、MySQL、System Logs)
- 创建 Agent Policy
- 部署 Elastic Agent
不再出现安全警告,功能完整启用。
测试命令
# curl -u elastic:9yZWp=3UnEVkBxYBhnlS \
>   -X PUT "http://10.10.10.10:9200/_security/user/fleet_admin" \
>   -H "Content-Type: application/json" \
>   -d'
> {
>   "password": "FleetPass123!",
>   "roles": ["superuser"],
>   "full_name": "Fleet Admin"
> }'
{"created":true}
# curl -u elastic:9yZWp=3UnEVkBxYBhnlS http://10.10.10.10:9200
{
"name" : "node71",
"cluster_name" : "isee_cluster",
"cluster_uuid" : "4tfIRB45Smioe8fi1UygdA",
"version" : {
"number" : "8.12.0",
"build_flavor" : "default",
"build_type" : "tar",
"build_hash" : "1665f706fd9354802c02146c1e6b5c0fbcddfbc9",
"build_date" : "2024-01-11T10:05:27.953830042Z",
"build_snapshot" : false,
"lucene_version" : "9.9.1",
"minimum_wire_compatibility_version" : "7.17.0",
"minimum_index_compatibility_version" : "7.0.0"
},
"tagline" : "You Know, for Search"
}问题2
[2025-08-20T10:24:18.241+08:00][INFO ][status] Kibana is now available
[2025-08-20T10:24:18.435+08:00][INFO ][plugins.alerting] Creating concrete write index - .internal.alerts-security.alerts-default-000001
[2025-08-20T10:24:18.437+08:00][INFO ][plugins.alerting] Creating concrete write index - .internal.alerts-observability.metrics.alerts-default-000001
[2025-08-20T10:24:18.439+08:00][INFO ][plugins.alerting] Creating concrete write index - .internal.alerts-observability.threshold.alerts-default-000001
[2025-08-20T10:24:18.503+08:00][INFO ][plugins.alerting] Creating concrete write index - .internal.alerts-observability.logs.alerts-default-000001
[2025-08-20T10:24:18.593+08:00][ERROR][plugins.security.session.index] Failed to clean up sessions: search_phase_execution_exception
        Root causes:
                no_shard_available_action_exception: [node71][10.10.10.10:9300][indices:data/read/open_reader_context]
[2025-08-20T10:24:18.594+08:00][ERROR][plugins.security.session.index] Cleanup routine failed: {"error":{"root_cause":[{"type":"no_shard_available_action_exception","reason":"[node71][10.10.10.10:9300][indices:data/read/open_reader_context]"}],"type":"search_phase_execution_exception","reason":"all shards failed","phase":"indices:data/read/open_point_in_time","grouped":true,"failed_shards":[{"shard":0,"index":".kibana_security_session_1","node":"ub4-HPY2RxSV01OPuI3gQQ","reason":{"type":"no_shard_available_action_exception","reason":"[node71][10.10.10.10:9300][indices:data/read/open_reader_context]"}}]},"status":503}.
[2025-08-20T10:24:18.616+08:00][ERROR][plugins.taskManager] Task session_cleanup "session_cleanup" failed: ResponseError: search_phase_execution_exception
        Root causes:
                no_shard_available_action_exception: [node71][10.10.10.10:9300][indices:data/read/open_reader_context]
[2025-08-20T10:24:18.619+08:00][INFO ][plugins.screenshotting.chromium] Browser executable: /data/isee/apps/kibana-8.12.0/node_modules/@kbn/screenshotting-plugin/chromium/headless_shell-linux_x64/headless_shell
[2025-08-20T10:24:18.674+08:00][INFO ][plugins.observability] Installing SLO ingest pipeline [.slo-observability.sli.pipeline-v3]
[2025-08-20T10:24:19.194+08:00][INFO ][plugins.observabilityAIAssistant.service] Creating concrete write index - .kibana-observability-ai-assistant-kb-000001
[2025-08-20T10:24:19.292+08:00][INFO ][plugins.fleet] Output secrets storage is disabled as minimum fleet server version has not been met
[2025-08-20T10:24:19.344+08:00][INFO ][plugins.observabilityAIAssistant.service] Successfully set up index assets
[2025-08-20T10:24:21.404+08:00][INFO ][plugins.fleet] Fleet setup completed
[2025-08-20T10:24:21.407+08:00][INFO ][plugins.securitySolution] Dependent plugin setup complete - Starting ManifestTask
[2025-08-20T10:24:21.409+08:00][INFO ][plugins.securitySolution.endpoint.policyProtections] App feature [endpoint_policy_protections] is enabled. Nothing to do!
[2025-08-20T10:24:23.770+08:00][INFO ][plugins.securitySolution.endpoint:metadata-check-transforms-task:0.0.1] no endpoint installation found

[2025-08-20T10:24:48.051+08:00][INFO ][http.server.Kibana] http server running at http://10.10.10.10:15602
提供的 Kibana 日志显示:
✅ Kibana 已成功启动并可用
✅ 大部分插件(Fleet、Security、Observability 等)已初始化完成
✅ HTTP 服务正在监听 http://10.10.10.10:15602
但存在一些 ERROR 级别的日志,主要集中在 会话清理失败(session_cleanup)。
✅ 一、核心结论:Kibana 服务已经可以使用!
访问地址:
🔗http://10.10.10.10:15602
你可以打开浏览器,输入这个地址,正常登录 Kibana。
❌ 二、关键错误分析
🔴 错误 1:会话清理失败(Session Cleanup Failed)
[ERROR][plugins.security.session.index] Failed to clean up sessions: search_phase_execution_exception
Root causes: no_shard_available_action_exception: [node71][10.10.10.10:9300][indices:data/read/open_reader_context]
原因:
Kibana 尝试清理过期的用户会话(存储在 .kibana_security_session_1 索引中),但 Elasticsearch 分片不可用,导致查询失败。
常见原因:
- Elasticsearch 节点负载过高或磁盘满
.kibana_security_session_1索引的分片未分配或处于UNASSIGNED状态- 网络问题或 JVM 崩溃导致节点短暂不可用
- Elasticsearch 的
cluster.routing.allocation.enable被禁用
✅ 三、解决方案
✅ 步骤 1:检查 Elasticsearch 集群健康状态
在任意节点执行:
# curl -u elastic:9yZWp=3UnEVkBxYBhnlS -X GET "http://10.10.10.10:9200/_cluster/health?pretty"
{
  "cluster_name" : "isee_cluster",
  "status" : "green",
  "timed_out" : false,
  "number_of_nodes" : 1,
  "number_of_data_nodes" : 1,
  "active_primary_shards" : 28,
  "active_shards" : 28,
  "relocating_shards" : 0,
  "initializing_shards" : 0,
  "unassigned_shards" : 0,
  "delayed_unassigned_shards" : 0,
  "number_of_pending_tasks" : 0,
  "number_of_in_flight_fetch" : 0,
  "task_max_waiting_in_queue_millis" : 0,
  "active_shards_percent_as_number" : 100.0
}
关注:
status: 应为green或yellowunassigned_shards: 应为0,如果不是,说明有分片未分配
✅ 步骤 2:检查 .kibana_security_session_1 索引状态
 curl -u elastic:9yZWp=3UnEVkBxYBhnlS -X GET "http://10.10.10.10:9200/.kibana_security_session_1/_stats"
{"_shards":{"total":1,"successful":1,"failed":0},"_all":{"primaries":{"docs":{"count":1,"deleted":0},"shard_stats":{"total_count":1},"store":{"size_in_bytes":6930,"total_data_set_size_in_bytes":6930,"reserved_in_bytes":0},"indexing":{"index_total":1,"index_time_in_millis":1,"index_current":0,"index_failed":0,"delete_total":0,"delete_time_in_millis":0,"delete_current":0,"noop_update_total":0,"is_throttled":false,"throttle_time_in_millis":0,"write_load":1.6811242066341014E-6},"get":{"total":68,"time_in_millis":361,"exists_total":68,"exists_time_in_millis":361,"missing_total":0,"missing_time_in_millis":0,"current":0},"search":{"open_contexts":0,"query_total":0,"query_time_in_millis":0,"query_current":0,"fetch_total":0,"fetch_time_in_millis":0,"fetch_current":0,"scroll_total":0,"scroll_time_in_millis":0,"scroll_current":0,"suggest_total":0,"suggest_time_in_millis":0,"suggest_current":0},"merges":{"current":0,"current_docs":0,"current_size_in_bytes":0,"total":0,"total_time_in_millis":0,"total_docs":0,"total_size_in_bytes":0,"total_stopped_time_in_millis":0,"total_throttled_time_in_millis":0,"total_auto_throttle_in_bytes":20971520},"refresh":{"total":6,"total_time_in_millis":327,"external_total":3,"external_total_time_in_millis":0,"listeners":0},"flush":{"total":2,"periodic":2,"total_time_in_millis":482},"warmer":{"current":0,"total":2,"total_time_in_millis":0},"query_cache":{"memory_size_in_bytes":0,"total_count":0,"hit_count":0,"miss_count":0,"cache_size":0,"cache_count":0,"evictions":0},"fielddata":{"memory_size_in_bytes":0,"evictions":0,"global_ordinals":{"build_time_in_millis":0}},"completion":{"size_in_bytes":0},"segments":{"count":1,"memory_in_bytes":0,"terms_memory_in_bytes":0,"stored_fields_memory_in_bytes":0,"term_vectors_memory_in_bytes":0,"norms_memory_in_bytes":0,"points_memory_in_bytes":0,"doc_values_memory_in_bytes":0,"index_writer_memory_in_bytes":0,"version_map_memory_in_bytes":0,"fixed_bit_set_memory_in_bytes":0,"max_unsafe_auto_id_timestamp":-1,"file_sizes":{}},"translog":{"operations":0,"size_in_bytes":55,"uncommitted_operations":0,"uncommitted_size_in_bytes":55,"earliest_last_modified_age":532243},"request_cache":{"memory_size_in_bytes":0,"evictions":0,"hit_count":0,"miss_count":0},"recovery。。。。。。。。。。。。。
或查看所有索引:
 curl -u elastic:9yZWp=3UnEVkBxYBhnlS -X GET "http://10.10.10.10:9200/_cat/indices/.kibana*?v&s=index"
health status index                                                   uuid                   pri rep docs.count docs.deleted store.size pri.store.size dataset.size
green  open   .ds-.kibana-event-log-ds-2025.08.20-000001              jTkaR05TQKi8bSfJm4VQvQ   1   0          2            0     12.5kb         12.5kb       12.5kb
green  open   .kibana-observability-ai-assistant-conversations-000001 9XflFvAdSYmNNAqunA12BA   1   0          0            0       249b           249b         249b
green  open   .kibana-observability-ai-assistant-kb-000001            FyvkDidkTO6Se1lX5pr98w   1   0          0            0       249b           249b         249b
green  open   .kibana_8.12.0_001                                      uh15bMGLTKe2GIYRfRbFjg   1   0         88            0    122.6kb        122.6kb      122.6kb
green  open   .kibana_alerting_cases_8.12.0_001                       5Dao03P7S-SZclMbkaKbSQ   1   0          1            0      6.8kb          6.8kb        6.8kb
green  open   .kibana_analytics_8.12.0_001                            Lsuq_0xyTbONNZJ5szmCHA   1   0          5            0      2.3mb          2.3mb        2.3mb
green  open   .kibana_ingest_8.12.0_001                               24CCE5H3TBSeHK9vszpmMg   1   0        136            0    275.5kb        275.5kb      275.5kb
green  open   .kibana_security_session_1                              AYiJSo4gRf-bmWGnCr0RvA   1   0          1            0      6.7kb          6.7kb        6.7kb
green  open   .kibana_security_solution_8.12.0_001                    chTTnQGBRuCPfAbIIbopXA   1   0          1            0       13kb           13kb         13kb
green  open   .kibana_task_manager_8.12.0_001                         3KCDrr19RGCYi1f95WrAAw   1   0         28           17    218.8kb        218.8kb      218.8kb
如果索引状态是 red 或 yellow,需要修复分片。
✅ 步骤 3:检查未分配的分片
curl -u elastic:9yZWp=3UnEVkBxYBhnlS -X GET "http://10.10.10.10:9200/_cat/shards?h=index,shard,prirep,state,node,unassigned.reason" | grep UNASSIGNED
  % Total    % Received % Xferd  Average Speed   Time    Time     Time  Current
                                 Dload  Upload   Total   Spent    Left  Speed
100  2324    0  2324    0     0  30365      0 --:--:-- --:--:-- --:--:-- 30578
常见 unassigned.reason:
ALLOCATION_FAILED→ 资源不足CLUSTER_RECOVERED→ 集群恢复中NODE_LEFT→ 节点宕机INDEX_CREATED→ 索引刚创建,等待分配
✅ 步骤 4:修复分片分配(如果存在未分配分片)
1. 确保分片分配是启用的:
curl -X PUT "http://10.10.10.10:9200/_cluster/settings" -H "Content-Type: application/json" -d'
{
  "transient": {
    "cluster.routing.allocation.enable": true
  }
}'
2. 强制重新分配(谨慎使用):
curl -X POST "http://10.10.10.10:9200/_cluster/reroute?retry_failed" -H "Content-Type: application/json" -d'
{
  "commands": []
}'
3. 如果磁盘空间不足,清理旧索引或扩容。
✅ 步骤 5:重启 Kibana(可选)
如果分片已恢复,重启 Kibana 可让 session 清理任务恢复正常:
sudo systemctl restart kibana✅ 四、其他日志说明
| 日志 | 说明 |
|---|---|
[INFO] Kibana is now available | ✅ 启动成功 |
[INFO] http server running at http://10.10.10.10:15602 | ✅ 访问地址 |
[ERROR] session_cleanup failed | ⚠️ 重要但不影响登录,需修复 ES 分片问题 |
[INFO] Fleet setup completed | ✅ Fleet 正常 |
[INFO] SecuritySolution endpoint... | ✅ 安全模块启动 |
✅ 五、访问 Kibana
打开浏览器,访问:
http://10.10.10.10:15602使用你在 Elasticsearch 中创建的用户登录,例如:
- 用户名:
elastic - 密码:你设置的密码
✅ 六、后续建议
- 监控 Elasticsearch 健康状态
- 定期清理旧索引(如
.kibana_task_manager*,.kibana_events*) - 确保磁盘空间充足(建议 < 80%)
- 配置 Kibana 的
xpack.security.encryptionKey(防止 session 重启失效)
✅ 总结
| 问题 | 是否影响使用 | 解决方案 |
|---|---|---|
session_cleanup 失败 | ❌ 不影响登录,但长期可能影响性能 | 修复 Elasticsearch 分片分配问题 |
| Kibana 启动成功 | ✅ 可以访问 | 访问 http://10.110.10.10:15602 |
| Fleet、Security 正常 | ✅ 功能可用 | 正常使用 |
🟢 你现在就可以访问 http://10.10.10.10:15602 使用 Kibana 了!
后续只需修复 


 2560
2560

 被折叠的 条评论
为什么被折叠?
被折叠的 条评论
为什么被折叠?
 到【灌水乐园】发言


