


Almost every Windows user has heard of, if not experienced, the infamous “blue screen of death.”This ominous term refers to the blue screen that is displayed when Windows crashes, or stops executing, because of a catastrophic fault or an internal condition that prevents the system from continuing to run.
In this chapter, we'll cover the basic problems that cause Windows to crash, describe the information presented on the blue screen, and explain the various configuration options available to create a crash dump, a record of system memory at the time of a crash that can help you figure out which component caused the crash and why. This section is not intended to provide detailed troubleshooting information on how to analyze a Windows system crash. This section will also show you how to analyze a crash dump to identify a faulty driver or omponent. The effort required to perform basic crash dump analysis is minimal and takes a few minutes. Even if an analysis ascertains the problematic driver for only one out of every five or ten crash dumps, it's still worth doing: one successful analysis can avoid future data loss, system downtime, and frustration.
Why Does Windows Crash?
Windows crashes (stops execution and displays the blue screen) for many possible reasons.
A common source is a reference to a memory address that causes an access violation, either a write operation to read-only memory or a read operation on an address that is not mapped. Another common cause is an unexpected exception or trap. Crashes also occur when a kernel subsystem (such as the memory manager or power manager) or a driver (such as a USB or display driver) detect inconsistencies in their operation.
When a kernel-mode device driver or subsystem causes an illegal exception, Windows faces a
difficult dilemma. It has detected that a part of the operating system with the ability to access any hardware device and any valid memory has done something it wasn't supposed to do.
But why does that mean Windows has to crash? Couldn't it just ignore the exception and let the
device driver or subsystem continue as if nothing had happened? The possibility exists that the error was isolated and that the component will somehow recover. But what's more likely is that the detected exception resulted from deeper problems—for example, from a general corruption of memory or from a hardware device that's not functioning properly. Permitting the system to continue operating would probably result in more exceptions, and data stored on disk or other peripherals could become corrupt—a risk that's too high to take. So Windows adopts a fail fast policy in attempting to prevent the corruption in RAM from spreading to disk.
The Blue Screen
Regardless of the reason for a system crash, the function that actually performs the crash is KeBugCheckEx, documented in the Windows Driver Kit (WDK). This function takes a stop code (sometimes called a bugcheck code) and four parameters that are interpreted on a per–stop code basis. After KeBugCheckEx masks out all interrupts on all processors of the system, it switches the display into a low-resolution VGA graphics mode (one implemented by all Windows-supported video cards), paints a blue background, and then displays the stop code, followed by some text suggesting what the user can do. Finally, KeBugCheckEx calls any registered device driver bugcheck callbacks (registered by calling the KeRegisterBugCheckCallback function), allowing drivers an opportunity to stop their devices.It then calls registered reason callbacks (registered with KeRegisterBugCheckReasonCallback), which allow drivers to append data to the crash dump or write crash dump information to alternate devices.
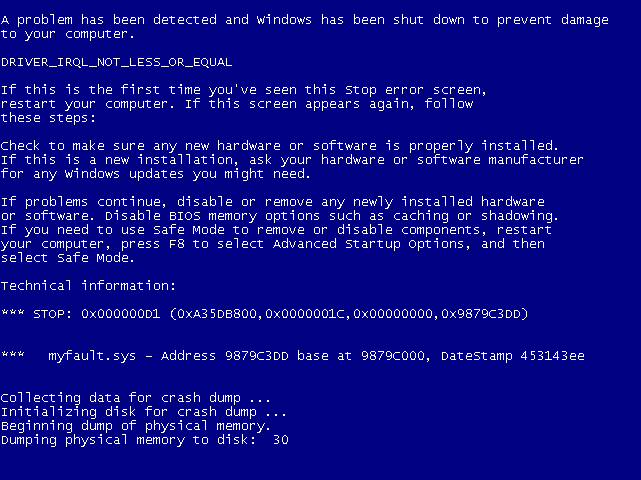
The first line in the Technical information section in the sample Windows blue screen shown in
Figure 14-1 lists the stop code and the four additional parameters passed to KeBugCheckEx. A text line near the top of the screen provides the text equivalent of the stop code's numeric identifier. According to the example in Figure 14-1, the stop code 0x000000D1 is a DRIVER_IRQL_NOT_LESS_OR_EQUAL crash. When a parameter contains an address of a piece of operating system or device driver code (as in Figure 14-1), Windows displays the base address of the module the address falls in, the date stamp, and the file name of the device driver. This information alone might help you pinpoint the faulty component.
Although there are more than 300 unique stop codes, most are rarely, if ever, seen on production systems. Instead, just a few common stop codes represent the majority of Windows system crashes.Also, the meaning of the four additional parameters depends on the stop code (and not all stop codes have extended parameter information). Nevertheless, looking up the stop code and the meaning of the parameters (if applicable) might at least assist you in diagnosing the component that is failing (or the hardware device that is causing the crash).
You can find stop code information in the section "Bug Checks (Blue Screens)" in the Debug-
ging Tools for Windows help file. (For information on the Debugging Tools for Windows, see
Chapter 1, "Concepts and Tools," in Part 1.) You can also search Microsoft's Knowledge Base (http://support.microsoft.com) for the stop code and the name of the suspect hardware or driver. You might find information about a workaround, an update, or a service pack that fixes the problem you're having. The Bugcodes.h file in the WDK contains a complete list of the 300 or so stop codes, with some additional details on the reasons for some of them. Last but not least, these stop codes are listed and documented at http://msdn.microsoft.com/en-us/library/windows/hardware/hh406232(v=vs.85).aspx.
最新的可以看这里 关于蓝屏的MSDN的文档也在这里可以查看
https://learn.microsoft.com/zh-cn/windows-hardware/drivers/debugger/blue-screen-data
Causes of Windows Crashes
Based on data collected from the release of Windows 7 through the release of Windows 7 SP1,
the top 20 stop codes account for 91 percent of crashes and can be grouped into the following
categories:
■ Page fault A page fault on memory backed by data in a paging file or a memory-mapped
file occurs at an IRQL of DPC/dispatch level or above, which would require the memory
manager to have to wait for an I/O operation to occur. The kernel cannot wait or reschedule
threads at an IRQL of DPC/dispatch level or higher. (See Chapter 3,"System Mechanisms,” in Part 1 for details on IRQLs.) The common stop codes are:
• 0xA - IRQL_NOT_LESS_OR_EQUAL
• 0xD1 - DRIVER_IRQL_NOT_LESS_OR_EQUAL
■ Power management A device driver or an operating system function running in kernel
mode is in an inconsistent or invalid power state. Most frequently, some component has failed to complete a power management I/O request operation within the default period of 10 minutes. The common stop code is:
• 0x9F - DRIVER_POWER_STATE_FAILURE
■ Exceptions and traps A device driver or an operating system function running in kernel
mode incurs [导致]an unexpected exception or trap. The common stop codes are:
• 0x1E - KMODE_EXCEPTION_NOT_HANDLED
• 0x3B - SYSTEM_SERVICE_EXCEPTION
• 0x7E - SYSTEM_THREAD_EXCEPTION_NOT_HANDLED
• 0x7F - UNEXPECTED_KERNEL_MODE_TRAP
• 0x8E - KERNEL_MODE_EXCEPTION_NOT_HANDLED with P1 != 0xC0000005
STATUS_ACCESS_VIOLATION
■ Access violations A device driver or an operating system function running in kernel mode
incurs a memory access violation, which is caused either by attempting to write to a read-only page or by attempting to read an address that isn't currently mapped and therefore is not a valid memory location. The common stop codes are:
• 0x50 - PAGE_FAULT_IN_NONPAGED_AREA
• 0x8E - KERNEL_MODE_EXCEPTION_NOT_HANDLED with P1 = 0xC0000005
STATUS_ACCESS_VIOLATION
■ Display The display device driver detects that it can no longer control the graphics processing unit. This indicates that an attempt to reset the display driver failed. The common stop code is:
• 0x116 - VIDEO_TDR_FAILURE
■ Pool The kernel pool manager detects a corrupt pool header or an improper pool reference.The common stop codes are:
• 0x19 - BAD_POOL_HEADER
• 0xC2 - BAD_POOL_CALLER
• 0xC5 - DRIVER_CORRUPTED_EXPOOL
■ Memory management The kernel memory manager detects a corruption of memory man-
agement data structures or an improper memory management request. The common stop
codes are:
• 0x1A - MEMORY_MANAGEMENT
• 0x4E - PFN_LIST_CORRUPT
■ Hardware A hardware error, such as a machine check or a nonmaskable interrupt (NMI), occurs. This category also includes disk failures when the memory manager is attempting to read data to satisfy page faults. The common stop codes are:
• 0x7A - KERNEL_DATA_INPAGE_ERROR
• 0x124 - WHEA_UNCORRECTABLE_ERROR[WHEA 硬件错误报告体系]
■ USB An unrecoverable error occurs in a universal serial bus operation. The common stop
code is:
• 0xFE - BUGCODE_USB_DRIVER
■ Critical object A fatal error occurs in a critical object without which Windows cannot con-
tinue to run. The common stop code is:
• 0xF4 - CRITICAL_OBJECT_TERMINATION
■ NTFS file system A fatal error is detected by the NTFS file system. The common stop
code is:
• 0x24 - NTFS_FILE_SYSTEM
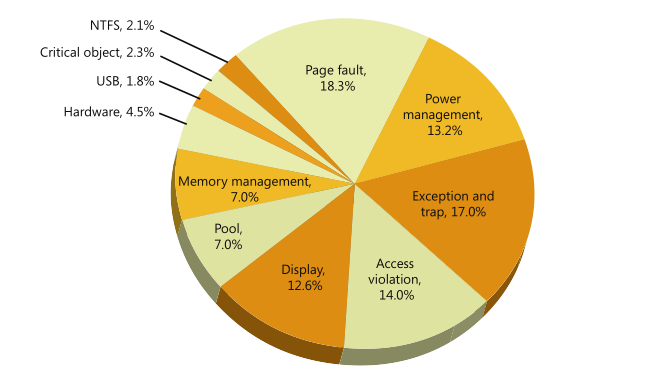
Figure 14-2 shows the distribution of these categories for Windows 7 and Windows 7 SP1 in May 2012:
Troubleshooting Crashes[Troubleshooting 故障排除]
You often begin seeing blue screens after you install a new software product or piece of hardware. If you've just added a driver, rebooted, and gotten a blue screen early in system initialization, you can reset the machine, press the F8 key when instructed, and then select Last Known Good Configuration. Enabling last known good causes Windows to revert to a copy of the registry's device driver registration key (HKLM\SYSTEM\CurrentControlSet\Services) from the last successful boot (before you installed the driver). From the perspective of last known good, a successful boot is one in which all services and drivers have finished loading and at least one logon has succeeded. (Last known good is further described in Chapter 13, “Startup and Shutdown.”)
During the reboot after a crash, the Boot Manager (Bootmgr) will automatically detect that
Windows did not shut down properly and display a Windows Error Recovery message similar to the one shown in Figure 14-3. This screen gives you the option to attempt booting into safe mode so that you can disable or uninstall the software component that might be broken.
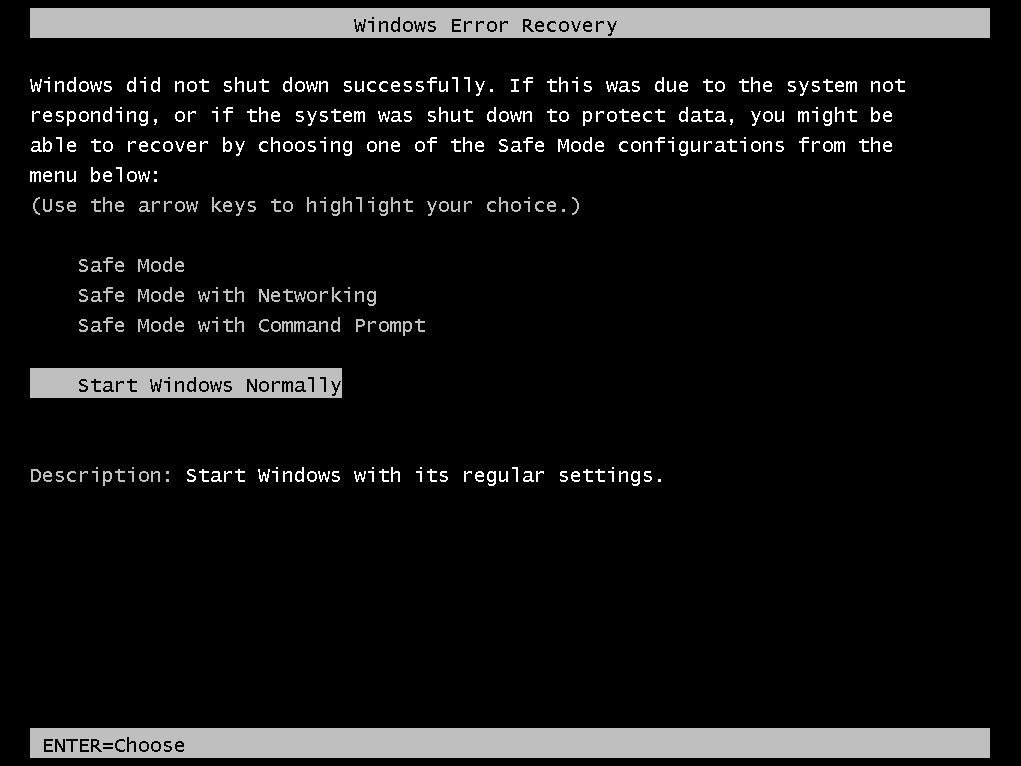
FIGURE 14-3 An example of a Windows Error Recovery message
If you keep getting blue screens, an obvious approach is to uninstall the components you added
just before the first blue screen appeared. If some time has passed since you added something new or you added several things at about the same time, you need to note the names of the device drivers referenced in any of the parameters. If you recognize any of the names as being related to something you just added (such as Storport.sys if you installed a new SCSI drive), you've possibly found your culprit.[culprit罪魁祸首]
Many device drivers have cryptic [cryptic隐秘的加密的]names, but one approach you can take to figure out which application or hardware device is associated with a name is to find out the name of the service in the registry associated with a device driver by searching for the name of the device driver under the HKLM\SYSTEM\CurrentControlSet\Services key. This branch of the registry is where Windows stores registration information for every device driver in the system. If you find a match, look for values named DisplayName and Description. Some drivers fill in these values to describe the device driver's purpose.For example, you might find the string "Virus Scanner" in the DisplayName value, which can implicate the antivirus software you have running. The list of drivers can be displayed in the System Information tool (from the Start menu, select All Programs, Accessories, System Tools, System Information[直接搜系统信息]). In
System Information, expand Software Environment, and then select System Drivers. Process Explorer also lists the currently loaded drivers, including their version numbers and load addresses, in the DLL view of the System process. Another option is to open the Properties dialog box for the driver file and examine the information on the Details tab, which often contains the description and company information for the driver. Keep in mind that the registry information and file description are provided by the driver manufacturer, and there is nothing to guarantee their accuracy.
More often than not[通常情况下], however, the stop code and the four associated parameters aren't enough information to troubleshoot a system crash. For example, you might need to examine the kernel-mode call stack to pinpoint[精确定位] the driver or system component that triggered the crash. Also, because the default behavior on Windows systems is to automatically reboot after a system crash, it's unlikely that you would have time to record the information displayed on the blue screen. That is why, by default,Windows attempts to record information about the system crash to the disk for later analysis, which takes us to our next topic, crash dump files.
Crash Dump Files
By default, all Windows systems are configured to attempt to record information about the state of the system when the system crashes. You can see these settings by opening the System Properties tool in Control Panel (under System, Advanced System Settings), clicking the Advanced tab, and then clicking the Settings button under Startup And Recovery. The default settings for a Windows system are shown in Figure 14-4.
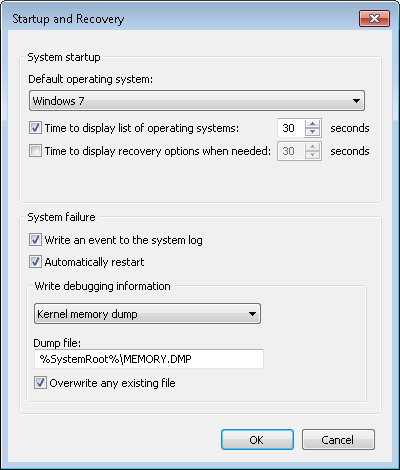
FIGURE 14-4 Crash dump settings
Three levels of information can be recorded on a system crash:
■ Complete memory dump A complete memory dump contains all physical memory ac-
cessible by Windows at the time of the crash. This type of dump requires that a page file be
at least the size of physical memory plus 1 MB for the header. Device drivers can add up to
256 MB for secondary crash dump data, so to be safe, it's recommended to increase the size
of the page file by an additional 256 MB. Because it can require an inordinately large page file on large memory systems, this type of dump file is the least common setting. If the system has more than 2 GB of RAM, this option will be disabled in the UI, but you can manually enable it by running the following command from an elevated command prompt:
wmic recoveros set DebugInfoType=1
When using Wmic.exe to enable a complete dump, the WMI Win32 Provider sets the Crash-
DumpEnabled value to 1 in the HKLM\SYSTEM\CurrentControlSet\Control\CrashControl reg-
istry key. At initialization time, Windows will check whether the page-file size is large enough
for a complete dump and automatically switch to creating a small memory dump if not.
[完全转储的设置方式和页面文件大小的要求]
■ Kernel memory dump A kernel memory dump contains only the kernel-mode pages al-
located by the operating system and device drivers that are present in physical memory at
the time of the crash. This type of dump doesn't contain pages belonging to user processes.
Because only kernel-mode code can directly cause Windows to crash, however, it's unlikely that user process pages are necessary to debug a crash. In addition, all data structures relevant for crash dump analysis—including the list of running processes, the kernel-mode stack of the current thread, and list of loaded drivers—are stored in nonpaged memory that saves in a kernel memory dump. There is no way to predict the size of a kernel memory dump because its size depends on the amount of kernel-mode memory allocated by the operating system and drivers present on the machine. This is the default setting for both Windows client and server systems.
■ Small memory dump A small memory dump, which is typically between 128 KB and 1 MB
in size and is also called a minidump or triage[诊疗] dump, contains the stop code and parameters,the list of loaded device drivers, the data structures that describe the current process and thread (called the EPROCESS and ETHREAD—described in Chapter 5, "Processes, Threads, and Jobs," in Part 1), the kernel stack for the thread that caused the crash, and additional memory considered potentially relevant by crash dump heuristics, such as the pages referenced by processor registers that contain memory addresses and secondary dump data added by drivers.
Note
Device drivers can register a secondary dump data callback routine by calling
KeRegisterBugCheckReasonCallback. The kernel invokes these callbacks after a crash and
a callback routine can add additional data to a crash dump file, such as device hardware
memory or device information for easier debugging. Up to 256 MB can be added system-
wide by all drivers, depending on the space required to store the dump and the size of the
file into which the dump is written, and each callback can add at most one-eighth of the
available additional space. Once the additional space is consumed, drivers subsequently
called are not offered the chance to add data.
The debugger indicates that it has limited information available to it when it loads a minidump,
and basic commands like !process, which lists active processes, don't have the data they need. Here is an example of !process executed on a minidump:
Microsoft (R) Windows Debugger Version 6.12.0002.633 AMD64
Copyright (c) Microsoft Corporation. All rights reserved.
Loading Dump File [C:\Windows\Minidump\100911-22965-01.dmp]
Mini Kernel Dump File: Only registers and stack trace are available
...
0: kd> !process 0 0
**** NT ACTIVE PROCESS DUMP ****
GetPointerFromAddress: unable to read from fffff800030c5000
Error in reading nt!_EPROCESS at 0000000000000000
A kernel memory dump includes more information, but switching to a different process's address space mappings won't work because required data isn't in the dump file. Here is an example of the debugger loading a kernel memory dump, followed by an attempt to switch process address spaces:
Microsoft (R) Windows Debugger Version 6.12.0002.633 AMD64
Copyright (c) Microsoft Corporation. All rights reserved.
Loading Dump File [C:\Windows\MEMORY.DMP]
Kernel Summary Dump File: Only kernel address space is available
...
0: kd> !process 0 0 explorer.exe
PROCESS fffffa8009b47540 ...
0: kd> .process fffffa8009b47540
Process fffffa80`09b47540 has invalid page directories
While a complete memory dump is a superset of the other options, it has the drawback that its size tracks the amount of physical memory on a system and can therefore become unwieldy[笨重]. Because user-mode code and data are not used during the analysis of most crashes (because crashes originate as a result of problems in kernel memory, and system data structures reside in kernel memory),much of the data stored in a complete memory dump is not relevant to crash analysis and therefore contributes wastefully to the size of a dump file. A final disadvantage is that the paging file must be at least as large as the amount of physical memory on the system plus 1 MB for the dump header,plus up to an additional 256 MB for secondary crash dump data. Because the size of the paging files required, in general, inversely tracks the amount of physical memory present, this requirement can force the paging file to be unnecessarily large. You should therefore consider the advantages offered by the small and kernel memory dump options.
An advantage of a minidump is its small size, which makes it convenient for exchange via e-mail,for example. In addition, each crash generates a file in the directory %SystemRoot%\Minidump with a unique file name consisting of the date, the number of milliseconds that have elapsed since the system was started, and a sequence number (for example, 040712-24835-01.dmp). If there's a conflict,the system will attempt to create additional unique file names by calling the Windows GetTickCount function to return an updated system tick count, and it will also increment the sequence number.By default, Windows saves the last 50 minidumps. The number of minidumps saved is configurable by modifying the MinidumpsCount value under the HKLM\SYSTEM\CurrentControlSet\Control\CrashControl registry key.
A disadvantage of minidumps is that to analyze them, you must have access to the exact images used on the system that generated the dump at the time of analysis. (At a minimum, a copy of the matching Ntoskrnl.exe is needed to perform the most basic analysis.) This can be problematic if you want to analyze a dump on a system different from the system that generated the dump. However,the Microsoft symbol server contains images (and symbols) for all recent Windows versions, so you can set the symbol path in the debugger to point to the symbol server, and the debugger will automatically download the needed images. (Of course, the Microsoft symbol server won't have images for third-party drivers you have installed.)
A more significant disadvantage is that the limited amount of data stored in the dump can hamper [阻碍]effective analysis. You can also get the advantages of minidumps even when you configure a system to generate kernel or complete crash dumps by opening the larger crash with WinDbg and using the .dump /m command to extract a minidump. Note that a minidump is automatically created even if the system is set for full or kernel dumps.
Note You can use the .dump command from within LiveKd to generate a memory image
of a live system that you can analyze offline without stopping the system. This approach is
useful when a system is exhibiting a problem but is still delivering services, and you want
to troubleshoot the problem without interrupting service. To prevent creating crash images
that aren’t necessarily fully consistent because the contents of different regions of memory
reflect different points in time, LiveKd supports the –m flag. The mirror dump option pro-
duces a consistent snapshot of kernel-mode memory by leveraging the memory manager’s
memory mirroring APIs, which give a point-in-time view of the system. For information
about using LiveKd with Hyper-V guests, refer to the “Dumping Hyper-V Guests Using
LiveKd” experiment later in the chapter.
The kernel memory dump option offers a practical middle ground. Because it contains all of
kernel-mode-owned physical memory, it has the same level of analysis-related data as a complete memory dump, but it omits the usually irrelevant user-mode data and code, and therefore can be significantly smaller. As an example, on a system running a 64-bit version of Windows with 4 GB of RAM,a kernel memory dump was 294 MB in size.
When you configure kernel memory dumps, the system checks whether the paging file is large enough, as described earlier. Some general recommendations follow in Table 14-1, but these are only estimated sizes because there is no way to predict the size of a kernel memory dump. The reason you can't predict the size of a kernel memory dump is that its size depends on the amount of kernel-mode memory in use by the operating system and drivers present on the machine at the time of the crash.
Therefore, it is possible that at the time of the crash, the paging file is too small to hold a kernel dump, in which case the system will switch to generating a minidump. If you want to see the size of a kernel dump on your system, force a manual crash either by configuring the option to allow you to initiate a manual system crash from the console or by using the Notmyfault tool. (Both Notmyfault and initiating a crash are described later in the chapter.) When you reboot, you can check to make sure that a kernel dump was generated and check its size to gauge how large to make your paging file. To be conservative, on 32-bit systems you can choose a page file size of 2 GB plus up to 256 MB,because 2 GB is the maximum kernel-mode address space available (unless you are booting with the increaseuserva boot option, in which case this can be as low as 1 GB). If you do not have enough space on the boot volume for saving the Memory.dmp file, you can choose a location on any other local hard disk through the dialog box shown earlier in Figure 14-4.
TABLE 14-1 Default Minimum Paging File Sizes for Kernel Dumps
System memory size | Minimum Page File Size for Kernel Dumps |
< 4 GB | 200 MB |
< 8 GB | 400 MB |
>= 8 GB | 800 MB |
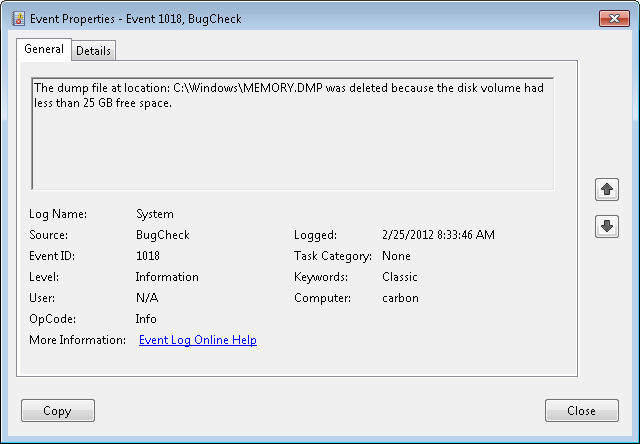
To limit the amount of disk space that is taken up by crash dumps, Windows needs to deter-mine whether it should maintain a copy of the last kernel or complete dump. After reporting the kernel fault (described later), Windows uses the following algorithm to decide if it should keep the Memory.dmp file. If the system is a server, Windows will always store the dump file. On a Windows client system, only domain-joined machines will store a crash dump by default. For a non-domain-joined machine, Windows will maintain a copy of the crash dump only if there is more than 25 GB of free disk space on the destination volume—that is, the volume where the system is configured to write the Memory.dmp file. If the system, due to disk space constraints, is unable to keep a copy of the crash dump file, an event is written to the System event log indicating that the dump file was deleted, as shown in Figure 14-5. This behavior can be overridden by creating the DWORD registry value
HKLM\SYSTEM\CurrentControlSet\Control\CrashControl\AlwaysKeepMemoryDump and setting it to 1, in which case Windows will always keep a crash dump, regardless of the amount of free disk space.
EXPERIMENT: Viewing Dump File Information
Each crash dump file contains a dump header that describes the stop code and its parameters,
the type of system the crash occurred on (including version information), and a list of pointers
to important kernel-mode structures required during analysis. The dump header also contains
the type of crash dump that was written and any information specific to that type of dump. The
.dumpdebug debugger command can be used to display the dump header of a crash dump file.
For example, the following output is from a crash of a system that was configured for a kernel
(or summary) dump:
0: kd> .dumpdebug
----- 64 bit Kernel Summary Dump Analysis
DUMP_HEADER64:
MajorVersion 0000000f
MinorVersion 00001db1
KdSecondaryVersion 00000000
DirectoryTableBase 00000001`ad6a2000
PfnDataBase fffffa80`00000000
PsLoadedModuleList fffff800`02a47670
PsActiveProcessHead fffff800`02a29350
MachineImageType 00008664
NumberProcessors 00000002
BugCheckCode 000000d1
BugCheckParameter1 fffff8a0`027475c0
BugCheckParameter2 00000000`00000002
BugCheckParameter3 00000000`00000000
BugCheckParameter4 fffff880`0343a361
KdDebuggerDataBlock fffff800`029f30a0
SecondaryDataState 00000000
ProductType 00000001
SuiteMask 00000110
SUMMARY_DUMP64:
DumpOptions 504d4453
HeaderSize 00049000
BitmapSize 00230000
Pages 000151f0
Bitmap.SizeOfBitMap 00230000
KiProcessorBlock at fffff800`02ab1c40
2 KiProcessorBlock entries:
fffff800`029f4e80 fffff880`009ec180
The .enumtag command displays all secondary dump data stored within a crash dump. For
each callback of secondary data, the tag, the length of the data, and the data itself (in byte
and ASCII format) are displayed. Developers can utilize Debugger Extension APIs to create
custom debugger extensions to also read secondary dump data. (See the Debugging Tools for
Windows help file for more information.)
0: kd> .enumtag
{270A33FD-3DA6-460D-BA893C1BAE21E39B} - 0xfc8 bytes
09 00 00 00 00 00 00 00 48 00 00 00 13 00 00 00 ........H.......
48 08 00 00 14 00 00 00 C8 0F 00 00 15 00 00 00 H...............
C8 0F 00 00 17 00 00 00 00 00 00 00 00 00 00 00 ................
00 00 00 00 00 00 00 00 00 00 00 00 00 00 00 00 ................
00 00 00 00 00 00 00 00 EF B2 01 00 00 00 00 00 ................
Crash Dump Generation
When the system boots, it checks the crash dump options configured by reading the HKLM\SYSTEM\CurrentControlSet\Control\CrashControl registry key. If a dump is configured, it makes a copy of the disk miniport driver used to write to the volume in memory and gives it the same name as the miniport with the word “dump_” prefixed. The system also queries the DumpFilters value for any filter drivers that are required for writing to the volume, an example being Dumpfve.sys, the BitLocker Drive Encryption Crashdump Filter driver. (See Chapter 9, “Storage Management,” for more details on BitLocker Drive Encryption.) It also collects information related to the components involved with writing a crash dump—including the name of the disk miniport driver, the I/O manager structures that are necessary to write the dump, and the map of where the paging file is on disk—and saves two copies of the data in dump-context structures.
这一步是为了校验是不是被破坏了,如果被破坏了那么就不能再dump
关于驱动的微软的文章 有关miniport driver的介绍
https://learn.microsoft.com/en-us/windows-hardware/drivers/gettingstarted/
When the system crashes, the crash dump driver (%SystemRoot%\System32\Drivers\Crashdmp.sys) verifies the integrity of the two dump-context structures obtained at boot by performing a memory comparison. If there's not a match, it does not write a crash dump, because doing so would likely fail or corrupt the disk. Upon a successful verification match, Crashdmp.sys, with support from the disk miniport driver and any required filter drivers, writes the dump information directly to the sectors on disk occupied by the paging file, bypassing the file system driver and storage driver stack (which
might be corrupted or even have caused the crash).
Note Because the page file is opened early during system startup for crash dump use,most crashes that are caused by bugs in system-start driver initialization result in a dump
file. Crashes in early Windows boot components such as the HAL or the initialization of
boot drivers occur too early for the system to have a page file, so using another computer
to debug the startup process is the only way to perform crash analysis in those cases. (See
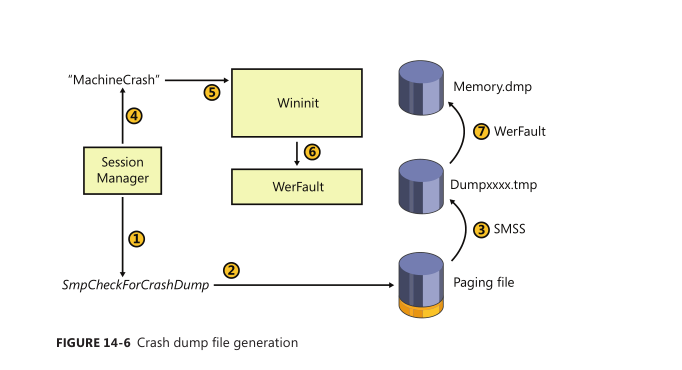
the “Attaching a Kernel Debugger” experiment later in the chapter.)During the boot process, the Session Manager (Smss.exe) checks the registry value HKLM\ SYSTEM\CurrentControlSet\Control\Session Manager\Memory Management\ExistingPageFiles for a list of existing page files from the previous boot. (See Chapter 10, “Memory Management,” for more information on page files.) It then cycles through the list, calling the function SmpCheckForCrashDump on each file present, looking to see whether it contains crash dump data. It checks by searching the header at the top of each paging file for the signature PAGEDUMP or PAGEDU64 on 32-bit or 64-bit systems, respectively. (A match indicates that the paging file contains crash dump information.) If crash dump data is present, the Session Manager then reads a set of crash parameters from the HKLM\SYSTEM\CurrentControlSet\Control\CrashControl registry key, one of which contains the name of the target dump file (typically %SystemRoot%\Memory.dmp, unless configured otherwise).Smss.exe then checks whether the target dump file is on a different volume than the paging file.If so, it checks whether the target volume has enough free disk space (the size required for the crash dump is stored in the dump header of the page file) before truncating the paging file to the size of the crash data and renaming it to a temporary dump file name. (A new page file will be created later when the Session Manager calls the NtCreatePagingFile function.) The temporary dump file name takes the format DUMPxxxx.tmp, where xxxx is the current low-word value of the system's tick count.(The system will attempt 100 times to find a nonconflicting value.) After renaming the page file, the system removes both the hidden and system attributes from the file and sets the appropriate security descriptors to secure the crash dump.
Next the Session Manager creates the volatile registry key KLM\SYSTEM\CurrentControlSet\Control\CrashControl\MachineCrash and stores the temporary dump file name in the value DumpFile. It then writes a DWORD to the TempDestination value indicating whether the dump file location is only a temporary destination. If the paging file is on the same volume as the destination dump file, a temporary dump file isn't used, because the paging file is truncated and directly renamed to the target dump file name. In this case, the DumpFile value will be that of the target dump file and TempDestination will be 0.
Later in the boot, Wininit checks for the presence of the MachineCrash key, and if it exists, Wininit launches WerFault (described in the next section), which reads the TempDestination and DumpFile values. If the TempDestination value is set to 1, which indicates a temporary file was used, WerFault moves the temporary file to its target location and secures the target file by allowing only the System account and the local Administrators group access. WerFault then writes the final dump file name to the FinalDumpFileLocation value in the MachineCrash key. These steps are shown in Figure 14-6.
To provide more control over where the dump file data is written to, for example on systems
that boot from a SAN or systems with insufficient disk space on the volume where the paging file is configured, Windows also supports the use of a dedicated dump file that is configured in the DedicatedDumpFile and DumpFileSize values under the HKLM\SYSTEM\CurrentControlSet\Control\CrashControl registry key. When a dedicated dump file is specified, the crash dump driver creates the dump file of the specified size and writes the crash data there instead of to the paging file. If no DumpFileSize value is given, Windows creates a dedicated dump file using the largest file size that would be required to store a complete dump. Windows calculates the required size as the size of the total number of physical pages of memory present in the system plus the size required for the dump header (one page on 32-bit systems, and two pages on 64-bit), plus the maximum value for second-
ary crash dump data, which is 256 MB. If a full or kernel dump is configured but there is not enough space on the target volume to create the dedicated dump file of the required size, the system falls back to writing a minidump.
Windows Error Reporting
As mentioned in Chapter 3 in Part 1, Windows includes a facility called Windows Error Reporting
(WER), which facilitates the automatic submission of process and system failures (such as crashes and/or hangs) to Microsoft (or an internal error reporting server) for analysis. This feature is enabled by default, but it can be modified by changing WER's behavior since WER takes the additional step of determining whether the system is configured to send a crash dump to Microsoft (or a private server,explained further in the “Online Crash Analysis” section later in the chapter) for analysis on a reboot following a crash. The main Problem Reporting Settings page, which you access from the Control Panel's Action Center applet by following the Change Action Center Settings link, is shown in Figure
14-7. This page allows you to configure the system's error reporting settings.
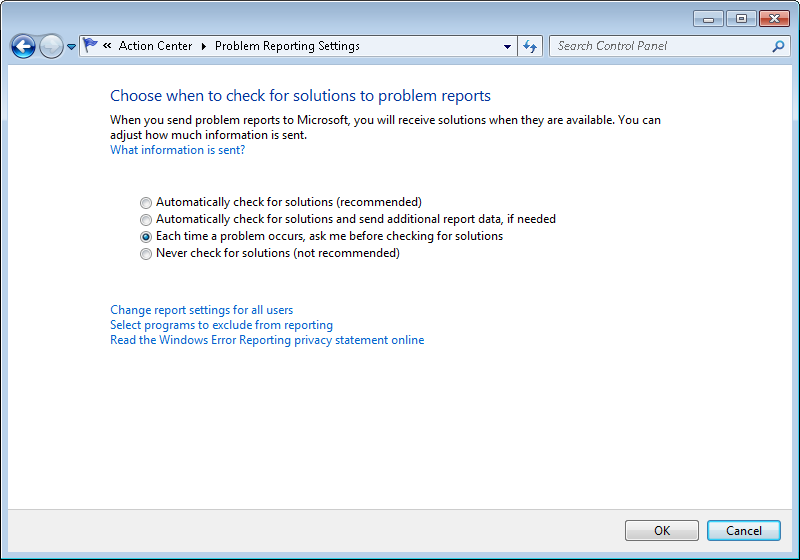
FIGURE 14-7 Problem reporting configuration page
As mentioned earlier, if Wininit.exe finds the HKLM\SYSTEM\CurrentControlSet\Control\Crash-
Control\MachineCrash key, it executes WerFault.exe with the –k –c flags (the k flag indicates kernel error reporting, and the c flag indicates that the full or kernel dump should be converted to a mini-dump) to have WerFault.exe check for the kernel-mode crash dump file. WerFault takes the following steps in preparing to send a crash dump report to the Microsoft Online Crash Analysis (OCA) site (or,if configured, an internal error reporting server):
1. If the type of dump generated was not a minidump, it extracts a minidump from the dump file and stores it in the default location of %SystemRoot%\Minidump, unless otherwise configured through the MinidumpDir value in the HKLM\SYSTEM\CurrentControlSet\Control\CrashControl key.
2. It writes the name of the minidump files to HKLM\SOFTWARE\Microsoft\Windows\Windows
Error Reporting\KernelFaults\Queue.
3. It adds a command to execute WerFault.exe (%SystemRoot%\System32\WerFault.exe) with the –k –qr flags (the qr flag specifies to use queued reporting mode and that WerFault should be restarted) to HKLM\SOFTWARE\Microsoft\Windows\CurrentVersion\RunOnce so that Wer-
Fault is executed during the first user's logon to the system for purposes of actually sending
the error report.
Online Crash Analysis
When the WerFault utility executes during logon, as a result of having configured itself to start, it launches itself again using the –k –q flags (the q flag on its own specifies queued reporting mode) and terminates the previous instance. It does this to prevent the Windows shell from waiting on WerFault by returning control to RunOnce as quickly as possible. The newly launched WerFault.exe checks the HKLM\SOFTWARE\Microsoft\Windows\Windows Error Reporting\KernelFaults\Queue key to look for queued reports that may have been added in the previous dump conversion phase. It also checks whether there are previously unsent crash reports from previous sessions. If there are, WerFault.exe generates two XML-formatted files:
■ The first contains a basic description of the system, including the operating system version, a list of drivers installed on the machine, and the list of devices present in the system.
■ The second contains metadata used by the OCA service, including the event type that trig-
gered WER and additional configuration information such as the system manufacturer.
If configured to ask for user input (which is the default), it then presents the dialog box shown in
Figure 14-8, which prompts the user whether he or she wants to check online for a solution to the problem. If the user chooses to check for a solution, and unless overridden by Group Policy, WerFault sends a copy of the two XML files and the minidump to https://oca.microsoft.com, which forwards the data to a server farm for automated analysis, described in the next section.If OCA fails to identify a resolution or you are unable to submit the crash to OCA, an alternative is analyzing crashes yourself. As mentioned earlier, WinDbg and Kd both execute the same analysis engine used by OCA when you load a crash dump file, and the basic analysis can sometimes pinpoint the problem. As a result, you might be fortunate and have the crash dump solved by the automatic analysis. If not, there are some straightforward techniques to try to solve the crash.
This section explains how to perform basic crash analysis steps, followed by tips on leveraging
Driver Verifier (which is introduced in Chapter 8, “I/O System”) to catch buggy drivers when they corrupt the system so that a crash dump analysis pinpoints them.
Note OCA's automated analysis may occasionally identify a highly likely cause of a crash but not be able to inform you of the suspected driver. This happens because it only reports the cause for crashes that have their bucket ID entry populated in the OCA database, and
entries are created only when Microsoft crash-analysis engineers have verified the cause. If
there's no bucket ID entry, OCA reports that the crash was caused by “unknown driver.”
Notmyfault
You can use the Notmyfault utility from Windows Sysinternals (http://technet.microsoft.com/en-us/sysinternals/bb963901) to generate the crashes described here. Notmyfault consists of an executable named Notmyfault.exe and a driver named Myfault.sys. When you run the notmyfault executable, it loads the driver and presents the dialog box shown in Figure 14-9, which allows you to crash or hang the system in various ways or to cause the driver to leak paged or nonpaged pool. The crash types offered represent the ones most commonly seen by Microsoft's Customer Service and Support group.Selecting an option and clicking the Crash, Hang, Leak Paged, or Leak Nonpaged button causes the executable to tell the driver, by using the DeviceIoControl Windows API, which type of bug to trigger.
Note You should execute Notmyfault crashes on a test system or on a virtual machine because there is a small risk that memory it corrupts will be written to disk and result in file or disk corruption.

Note The names of the Notmyfault executable and driver highlight the fact that user
mode cannot directly cause the system to crash. The Notmyfault executable can cause a
crash only by loading a driver to perform an illegal operation for it in kernel mode.
Basic Crash Dump Analysis
The most straightforward Notmyfault crash to debug is the one caused by selecting the High IRQL Fault (Kernel-Mode) option and clicking the Crash button. This causes the driver to allocate a page of paged pool, free the pool, raise the IRQL to DPC/dispatch level, and then touch the page it has freed.(See Chapter 3 in Part 1 for more information on IRQLs.) If that doesn't cause a crash, the process continues by reading memory past the end of the page until it causes a crash by accessing invalid pages.The driver performs several illegal operations as a result:
1. It references memory that doesn't belong to it.
2. It references paged pool at an IRQL that's DPC/dispatch level or higher, which is illegal be-
cause page faults are not permitted when the processor IRQL is DPC/dispatch level or higher.
3. When it goes past the end of the memory that it had allocated, it tries to reference memory that is potentially invalid.
The reason the first page reference might not cause a crash is that it won't generate a page fault if the page that the driver frees remains in the system working set. (See Chapter 10 for information on the system working set.)
When you load a crash generated with this bug into WinDbg, the tool's analysis displays some-
thing like this:
Microsoft (R) Windows Debugger Version 6.12.0002.633 AMD64
Copyright (c) Microsoft Corporation. All rights reserved.
Loading Dump File [C:\Windows\MEMORY.DMP]
Kernel Complete Dump File: Full address space is available
Symbol search path is: srv*c:\symbols*http://msdl.microsoft.com/download/symbols
Executable search path is:
Windows 7 Kernel Version 7601 (Service Pack 1) MP (2 procs) Free x86 compatible
Product: WinNt, suite: TerminalServer SingleUserTS
Built by: 7601.17514.x86fre.win7sp1_rtm.101119-1850
Machine Name:
Kernel base = 0x82814000 PsLoadedModuleList = 0x8295e850
Debug session time: Wed Mar 21 08:12:50.194 2012 (UTC - 7:00)
System Uptime: 8 days 8:54:38.580
Loading Kernel Symbols
...............................................................
...........
Loading User Symbols
......................
Loading unloaded module list
.....
*******************************************************************************
* *
* Bugcheck Analysis *
* *
*******************************************************************************
Use !analyze -v to get detailed debugging information.
BugCheck D1, {946ae800, 2, 0, 91df15ab}
*** ERROR: Module load completed but symbols could not be loaded for myfault.sys
Probably caused by : myfault.sys ( myfault+5ab )
Followup: MachineOwner
---------
The first thing to note is that WinDbg reports errors trying to load symbols for Myfault.sys. This is expected because the symbol file for Myfault.sys is not stored in the symbol-file path (which is configured to point at the Microsoft symbol server). You'll see similar errors for third-party drivers that do not ship with the operating system.
The analysis text itself is terse[简要的], showing the numeric stop code and bug-check parameters followed by a "Probably caused by" line that shows the analysis engine's best guess at the offending driver. In this case it's on the mark and points directly at Myfault.sys, so there's no need for manual analysis.
The "Followup" line is not generally useful except within Microsoft, where the debugger looks for the module name in the Triage.ini file that's located within the Triage directory of the Debugging Tools for Windows installation directory. The Microsoft-internal version of that file lists the developer or group responsible for handling crashes in a specific driver, and the debugger displays the developer's or group's name in the Followup line when appropriate.
VerboseAnalysis
verbose[啰嗦的冗长的]
Even though the basic analysis of the Notmyfault crash identifies the faulty driver, you should always have the debugger execute a verbose analysis by entering the command:
!analyze –v
The first obvious difference between the verbose and default analysis is the description of the stop code and its parameters. Following is the output of the command when executed on the same dump:
DRIVER_IRQL_NOT_LESS_OR_EQUAL (d1)
An attempt was made to access a pageable (or completely invalid) address at an
interrupt request level (IRQL) that is too high. This is usually
caused by drivers using improper addresses.
If kernel debugger is available get stack backtrace.
Arguments:
Arg1: 946ae800, memory referenced
Arg2: 00000002, IRQL
Arg3: 00000000, value 0 = read operation, 1 = write operation
Arg4: 91df15ab, address which referenced memory
This saves you the trouble of opening the help file to find the same information, and the text
sometimes suggests troubleshooting steps, an example of which you'll see in the next section on
advanced crash dump analysis.
The other potentially useful information in a verbose analysis is the stack trace of the thread that
was executing on the processor that crashed at the time of the crash. Here's what it looks like for the
same complete dump:
STACK_TEXT:
93cdbb3c 91df15ab badb0d00 84f3e380 946ad800 nt!KiTrap0E+0x2cf
WARNING: Stack unwind information not available. Following frames may be wrong.
93cdbbb8 91df19db 86d77900 93cdbbfc 91df1b26 myfault+0x5ab
93cdbbc4 91df1b26 85e38488 00000001 00000000 myfault+0x9db
93cdbbfc 8284b593 86c9a510 86d77900 86d77900 myfault+0xb26
93cdbc14 82a3f99f 85e38488 86d77900 86d77970 nt!IofCallDriver+0x63
93cdbc34 82a42b71 86c9a510 85e38488 00000000 nt!IopSynchronousServiceTail+0x1f8
93cdbcd0 82a893f4 86c9a510 86d77900 00000000 nt!IopXxxControlFile+0x6aa
93cdbd04 828521ea 000000c4 00000000 00000000 nt!NtDeviceIoControlFile+0x2a
93cdbd04 77af70b4 000000c4 00000000 00000000 nt!KiFastCallEntry+0x12a
0009f370 77af5864 75cb989d 000000c4 00000000 ntdll!KiFastSystemCallRet
0009f374 75cb989d 000000c4 00000000 00000000 ntdll!NtDeviceIoControlFile+0xc
0009f3d4 77a1a671 000000c4 83360018 00000000 KERNELBASE!DeviceIoControl+0xf6
0009f400 00c421f9 000000c4 83360018 00000000 kernel32!DeviceIoControlImplementation+0x80
0009f4a0 7749c4e7 000201ec 00000111 000003f9 NotMyfault+0x21f9
The preceding stack shows that the Notmyfault executable image, shown at the bottom, invoked the DeviceIoControlImplementation function in Kernel32.dll, which in turn invoked DeviceIoControl in Kernelbase.dll, and so on, until finally the system crashed with the execution of an instruction in the Myfault image. A stack trace like this can be useful because crashes sometimes occur as the result of one driver passing another one data that is improperly formatted or corrupt or contains illegal parameters. The driver that's passed the invalid data might cause a crash and get the blame in an analysis, when the stack reveals that another driver was involved. In this sample trace, no driver other than Myfault is listed. (The module “nt” is Ntoskrnl.)
If the driver singled out by an analysis is unfamiliar to you, use the lm (list modules) command to look at the driver's version information. Add the k (kernel modules) and v (verbose) options along with the m (match) option followed by the name of the driver:
0: kd> lm kv m myfault
start end module name
91df1000 91df2880 myfault (no symbols)
Loaded symbol image file: myfault.sys
Image path: \??\C:\Windows\system32\drivers\myfault.sys
Image name: myfault.sys
Timestamp: Sat Apr 07 09:34:40 2012 (4F806CA0)
CheckSum: 00003871
ImageSize: 00001880
File version: 4.0.0.0
Product version: 4.0.0.0
File flags: 0 (Mask 3F)
File OS: 40004 NT Win32
File type: 3.7 Driver
File date: 00000000.00000000
Translations: 0409.04b0
CompanyName: Sysinternals
ProductName: Sysinternals Myfault
InternalName: myfault.sys
OriginalFilename: myfault.sys
ProductVersion: 4.0
FileVersion: 4.0 (sysinternals.com)
FileDescription: Crash Test Driver
LegalCopyright: Copyright © 2002-2012 Mark Russinovich
Before you spend additional time and energy further analyzing crashes, you should ensure that your system's kernel and drivers are the most recent available by using the services of Windows Update and third-party driver support sites.
In addition to using the description to identify the purpose of a driver, you can also use the file and product version numbers to see whether the version installed is the most up-to-date version available. If version information isn't present (because it might have been paged out of physical memory at the time of the crash), look at the driver image file's properties in Windows Explorer on the system that crashed.
To use Windows Update to check for a newer version of a driver, open Device Manager and locate the device that the driver is associated with. Right-click on the device, and select Update Driver Software. If Windows Update reports that no newer version of the driver is available for download, it may be worthwhile checking the website of the original equipment manufacturer (OEM) for the system.Finally, since both Windows Update and the OEM may not have the latest drivers, also check the website of the actual driver author for a newer version.
Using Crash Troubleshooting Tools
The crash generated in the preceding section with Notmyfault's High IRQL Fault (Kernel-Mode) option poses no challenge for the debugger's automated analysis. Unfortunately, most crashes are not so easy and sometimes are impossible to debug. There are several levels of increasing severity in terms of system performance degradation that might help turn system crashes that cannot be analyzed into ones that can be. If the crashes generated after you configure a level and reboot aren't revealing the cause, try the next level.
1. If there are one or more drivers you consider likely sources of the crashes—because they were introduced into the system relatively recently, they were recently updated, or the circumstances of the crash implicate them enable them for verification using Driver Verifier and check all the verification options except for low resources simulation. (See Chapter 8 for more information on Driver Verifier.)
2. If the computer is running a 32-bit version of Windows, enable the same level of verification as in level 1 on all unsigned drivers in the system. (All drivers on a 64-bit system must be signed unless this restriction is disabled manually at boot time by pressing F8 and choosing the advanced boot option Disable Driver Signature Enforcement.)
3. Enable the same verification as in level 1 on all drivers in the system. To maintain reasonable performance, you may want to divide the drivers into groups, enabling Driver Verifier on one group at a time between reboots.
Note If your system becomes unbootable because Driver Verifier detects a driver error and crashes the system, start in safe mode (where verification is disabled), run Driver Verifier, and delete the verification settings.The following sections demonstrate how Driver Verifier can make impossible-to-debug crashes into ones that you can solve.
Buffer Overruns, Memory Corruption, and Special Pool
One of the most common sources of crashes on Windows is pool corruption. Pool corruption usually occurs when a driver suffers from a buffer overrun or buffer underrun bug that causes it to overwrite data past either the end or start of a buffer it has allocated from paged or nonpaged pool. The Executive's pool-tracking structures reside on either side of a pool buffer and separate buffers from each other. These bugs, therefore, cause corruption to the pool tracking structures, to buffers owned by other drivers, or to both. You can often catch the culprit of a pool overrun by using the !pool command to examine the surrounding pool tags. Find the address at which the corruption occurred,and use !pool address_of_corruption. This command will display all the pool allocations that are on the same page as the corruption. Looking in the left column, find the range of the corrupted address and then look at the allocation just previous to it and find its pool tag. This will likely be the culprit[罪魁祸首] in a buffer overrun. You can use the Pooltag.txt file in the Triage folder of the Debugging Tools for Windows installation directory to find the driver that owns the pool tag, or use the Strings utility from Sysinternals.
Pool corruption can also occur when a driver writes to pool it had previously owned but subsequently freed. This is called a use after free bug and is usually caused by a race condition in a driver.These bugs are particularly hard to debug because the driver that corrupts memory no longer has any traceable ties to the memory, such as a neighboring pool tag as in a buffer overrun. Another fairly common cause of pool corruption is direct memory access (DMA). DMA occurs when hardware writes directly to RAM instead of going through a driver; however, the driver is still responsible for coordinating the whole process by allocating the memory that the hardware will write to and programming the hardware registers of the device with the details of the operation. If a driver has a bug that releases the memory it is using for DMA before the hardware writes to it, the memory can be given to another driver or even to a user-mode application, which will certainly not expect to have hardware writing to it.
The crashes caused by pool corruption are virtually impossible to debug because the system
crashes when corrupted data is referenced, not when the corruption occurs. However, sometimes you can take steps to at least obtain a clue about what corrupted the memory. The first step is to try to determine the size of the corruption by looking at the corrupted data. If the corruption is a single bit, it was likely caused by bad RAM or a faulty processor. If the corruption is fairly small, it could be caused by hardware or software, and finding a root cause will be nearly impossible. In the case of large corruptions, you can look for patterns in the corruption, like strings (for example, HTTP packet payloads, file contents of text-based files, and so on).
Note To assist in catching pool corruptions, Windows checks the consistency of a buffer’s pool-tracking structures, and those of the buffer’s immediate neighbors, on every pool allocation and free operation. Thus, buffer overruns are likely to be detected shortly after
the corruption and identified with a crash that has the BAD_POOL_HEADER (0x19) stop code.
You can generate a pool corruption crash by running Notmyfault and selecting the Buffer Over-flow bug. This causes Myfault to allocate a buffer and then overwrite the 48 bytes following the buffer. There can be a significant delay between the time you click the Crash button and when a crash occurs, and you might even have to generate pool usage by exercising applications before a crash occurs, which highlights the distance between a corruption and its effect on system stability. An analysis of the resultant crash almost always reports Ntoskrnl or another driver as being the likely cause, which demonstrates the usefulness of a verbose analysis with its description of the stop code:
DRIVER_CORRUPTED_EXPOOL (c5)
An attempt was made to access a pageable (or completely invalid) address at an
interrupt request level (IRQL) that is too high. This is
caused by drivers that have corrupted the system pool. Run the driver
verifier against any new (or suspect) drivers, and if that doesn’t turn up
the culprit, then use gflags to enable special pool.
Arguments:
Arg1: 4f4f4f53, memory referenced
Arg2: 00000002, IRQL
Arg3: 00000000, value 0 = read operation, 1 = write operation
Arg4: 829234a7, address which referenced memory
The advice in the description is to run Driver Verifier against any new or suspect drivers or to use Gflags to enable special pool. Both accomplish the same thing: to have the system detect a potential corruption when it occurs and crash the system in a way that makes the automated analysis point at the driver causing the corruption.
If Driver Verifier's special pool option is enabled, verified drivers use special pool, rather than paged or nonpaged pool, for any allocations they make for buffers slightly less than a page in size. A buffer allocated from special pool is sandwiched between two invalid pages and by default is aligned against the top of the page. The special pool routines also fill the unused portions of the page in which the buffer resides with a random pattern (based on the system’s tick count). See Chapter 10 for more information on special pool.
The system detects any buffer overruns of under a page in size at the time of the overrun because they cause a page fault on the invalid page following the buffer. The signature serves to catch buffer underruns at the time the driver frees a buffer because the integrity of the pattern placed there at the time of allocation will have been compromised
EXPERIMENT: Enabling Special Pool with Driver Verifier
To see how the use of special pool causes a crash that the analysis engine easily diagnoses, run
the Driver Verifier Manager to configure the special pool option. The Driver Verifier Manager
provides the ability to activate most verification features without having to restart the system.
The following steps show how to use the Driver Verifier Manager to enable the special pool
feature, without requiring a restart:
1. From the Start menu, type verifier, and then press Enter to run the Driver Verifier
Manager.
2. Select the option Display Information About The Currently Verified Drivers, and then
click Next.
3. Click the Change button, select Special Pool, and click OK to enable the special pool
option. (The Enabled? option will read No until you select a driver for verification.)
4. Next, click the Add button, type myfault.sys in the File Name field, and then click
Open. (You do not have to find Myfault.sys in the dialog box; just enter its name.)
5. Click the Next button to progress to where the Driver Verifier Manager displays a list
of global counters for any currently verified drivers. Clicking the Next button again
shows you a list of counters specific to each verified driver. You should see Myfault.sys
in the list
6. Finally, click the Finish button to complete the wizard.
Drivers that are verified using the No Reboot feature of Driver Verifier are not monitored as
thoroughly as drivers that are loaded after a reboot. Whenever possible, enable the driver for
verification, and then restart the system. Running the following command from an elevated
command prompt causes Driver Verifier to preserve verification settings across reboots:
C:\>verifier /flags 0x1 /driver myfault.sys
New verifier settings:
Special pool: Enabled
Pool tracking: Disabled
Force IRQL checking: Disabled
I/O verification: Disabled
Deadlock detection: Disabled
DMA checking: Disabled
Security checks: Disabled
Force pending I/O requests: Disabled
Low resources simulation: Disabled
IRP Logging: Disabled
Miscellaneous checks: Disabled
Verified drivers:
myfault.sys
You must restart this computer for the changes to take effect.
When you run Notmyfault and cause a buffer overflow, the system will immediately crash
and the analysis of the dump reports this:
Probably caused by : myfault.sys ( myfault+61d )
A verbose analysis describes the stop code like this:
DRIVER_PAGE_FAULT_BEYOND_END_OF_ALLOCATION (d6)
N bytes of memory was allocated and more than N bytes are being referenced.
This cannot be protected by try-except.
When possible, the guilty driver’s name (Unicode string) is printed on
the bugcheck screen and saved in KiBugCheckDriver.
Arguments:
Arg1: beb50000, memory referenced
Arg2: 00000001, value 0 = read operation, 1 = write operation
Arg3: 9201161d, if non-zero, the address which referenced memory.
Arg4: 00000000, (reserved)
Special pool made an elusive bug into one that instantly reveals itself and makes the analysis
trivial.
Code Overwrite and System Code Write Protection
A driver with a bug that causes corruption or misinterpretation of its own data structures can reference memory the driver doesn't own when it interprets corrupted data as a memory pointer value.The target of the pointer can be anything in the virtual address space, including data belonging to other drivers, invalid memory, or the code of other drivers or the kernel. As with buffer overruns, by the time that corruption is detected and the system crashes, it's usually impossible to identify the driver that caused the corruption. Enabling special pool increases the chance of catching wild-pointer bugs, but it does not catch code corruption.When you run Notmyfault and select the Code Overwrite option, the Myfault driver corrupts the entry point to the NtReadFile kernel function. One of two things will happen at this point: if your system has 2 GB or less of physical memory, you’ll get a crash for which an analysis points at Myfault.sys.
The stop code description that a verbose analysis displays tells you that Myfault attempted to write to read-only memory:
ATTEMPTED_WRITE_TO_READONLY_MEMORY (be)
An attempt was made to write to readonly memory. The guilty driver is on the
stack trace (and is typically the current instruction pointer).
When possible, the guilty driver's name (Unicode string) is printed on
the bugcheck screen and saved in KiBugCheckDriver.
Arguments:
Arg1: 826a023c, Virtual address for the attempted write.
Arg2: 026a0121, PTE contents.
Arg3: 90f83b4c, (reserved)
Arg4: 0000000b, (reserved)
However, if you have more than 2 GB of memory, you'll get a different type of crash because the attempt to corrupt the memory isn't caught. Because NtReadFile is a commonly executed system service that is used by Windows, the system will almost immediately crash as a thread attempts to execute the corrupted code and generates an illegal instruction fault. The analysis of crashes generated with this bug is always wrong, but it might vary, with Win32k.sys and Ntoskrnl.exe commonly being the analyzer's best guess as to what's responsible. The bugcheck description for these crashes is:
KERNEL_MODE_EXCEPTION_NOT_HANDLED (8e)
This is a very common bugcheck. Usually the exception address pinpoints
the driver/function that caused the problem. Always note this address
as well as the link date of the driver/image that contains this address.
Some common problems are exception code 0x80000003. This means a hard
coded breakpoint or assertion was hit, but this system was booted
/NODEBUG. This is not supposed to happen as developers should never have
hardcoded breakpoints in retail code, but ...
If this happens, make sure a debugger gets connected, and the
system is booted /DEBUG. This will let us see why this breakpoint is
happening.
Arguments:
Arg1: c0000005, The exception code that was not handled
Arg2: 826a0240, The address that the exception occurred at
Arg3: 978eb9c4, Trap Frame
Arg4: 00000000
The reason for the different behaviors on different configurations relates to a mechanism called system code write protection. If system code write protection is enabled, the memory manager maps Ntoskrnl.exe, the HAL, and boot drivers using standard physical pages (4 KB on x86 and x64, and 8 KB on IA64). Because the granularity of protection in an image is the standard page size, the memory manager can write-protect code pages so that an attempt to modify them generates an access fault (as seen in the first crash). However, when system code write protection is disabled on systems with more than 2 GB of RAM, the memory manager uses large pages (4 MB on x86, and 16 MB on IA64 and x64) to map Ntoskrnl.exe and the HAL.
If system code write protection is off and crash analysis reports unlikely causes for a crash or you suspect code corruption, you should enable it. Verifying at least one driver with Driver Verifier is the easiest way to enable it. You can also enable it manually by adding a registry value under HKLM\SYSTEM\CurrentControlSet\Control\Session Manager\Memory Management. You need to specify the amount of RAM at which the memory manager uses large pages instead of standard pages to map Ntoskrnl.exe as an effectively infinite value. You do this by creating a DWORD value called LargePageMinimum and setting it to 0xFFFFFFFF. You must reboot for the changes to take effect.
Advanced Crash Dump Analysis
The preceding section leverages Driver Verifier to create crashes that the debugger's automated
analysis engine can resolve. You might still encounter cases where you cannot get a system to produce easily analyzable crashes, and, if so, you will need to execute manual analysis to try to determine what the problem is. Here are some examples of basic commands that can provide clues during crash analysis. The Debugging Tools for Windows help file provides complete documentation on these and other commands as well as examples of how to use them during crash analysis:
■ Use the !cpuinfo command to display a list of processors the system is configured to use.
■ Use the processor ID with the k command to display the stack trace of each processor in the
system—for example, 1k. Be sure you recognize each of the modules listed in the stack trace
and that you have the most recent versions.
■ Use the !thread command to display information about the current thread on each processor.
The ~s command can be used with the processor ID to change the current processor (such as
~1s). Look for any pending I/O request packets (explained in the next section).
■ Use the .time command to display information about the system time, including when the sys-
tem crashed and for how long it had been running. A short uptime value can indicate frequent
problems.
■ Use the lm command with the k t option (the t flag specifies to display time stamp informa-
tion—that is, when the file was compiled, not what appears on the file system, which might
differ) to list the loaded kernel-mode drivers. Be sure you understand the purpose of any
third-party drivers and that you have the most recent versions.
■ Use the !vm command to see whether the system has exhausted virtual memory, paged pool,
or nonpaged pool. If virtual memory is exhausted, the committed pages will be close to the
commit limit, so try to identify a potential memory leak by examining the list of processes to
see which one reports high commit usage. If nonpaged pool or paged pool is exhausted (that
is, the usage is close to the maximum), see the “Troubleshooting a Pool Leak” experiment in
Chapter 10.
■ Use the !process 0 0 debugger command to look at the processes running, and be sure that
you understand the purpose of each one. Try disabling or uninstalling unnecessary applica-
tions and services.
There are other debugging commands that can prove useful, but more advanced knowledge is
required to apply them. The !irp command is one of them. The next section shows the use of this
command to identify a suspect driver.
Stack Trashes
Stack overruns or stack trashing typically results from a buffer overrun or underrun or when a driver passes a buffer address located on the stack to a lower driver on the device stack, which then performs the work asynchronously.
In the case of a stack overrun or underrun, instead of residing in pool, as you saw with Notmyfault's buffer overrun bug, the target buffer is on the stack of the thread that executes the bug. This type of bug is another one that's difficult to debug because the stack is the foundation for any crash dump analysis.
In the case of passing buffers on the stack to lower drivers, if the lower driver returns to the caller immediately because it used a completion routine to perform the work, instead of returning synchronously, when the completion routine is called, it will use the stack address that was passed previously,which could now correspond to a different state on the caller's stack and result in corruption.
When you run Notmyfault and select Stack Trash, the Myfault driver overruns a buffer it allocates on the kernel stack of the thread that executes it. When Myfault tries to return control to the Ntoskrnl function that was invoked, it reads the return address, which is the address at which it should continue executing, from the stack. The address was corrupted by the stack-buffer overrun, so the thread continues execution at some different address in memory—an address that might not even contain code. An illegal exception and crash occur when the thread executes an illegal CPU instruction or it references invalid memory.
The driver that the crash dump analysis of a stack overrun points the blame at will vary from crash to crash, but the stop code will almost always be KERNEL_MODE_EXCEPTION_NOT_HANDLED (0x8E) on a 32-bit system and KMODE_EXCEPTION_NOT_HANDLED (0x1E) on a 64-bit one. If you execute a verbose analysis, the stack trace looks like this:
STACK_TEXT:
9569b6b4 828c108c 0000008e c0000005 00000000 nt!KeBugCheckEx+0x1e
9569badc 8284add6 9569baf8 00000000 9569bb4c nt!KiDispatchException+0x1ac
9569bb44 8284ad8a 00000000 00000000 badb0d00 nt!CommonDispatchException+0x4a
9569bbfc 82843593 853422b0 86b99278 86b99278 nt!Kei386EoiHelper+0x192
00000000 00000000 00000000 00000000 00000000 nt!IofCallDriver+0x63
Notice how the call to IofCallDriver leads immediately to Kei386EoiHelper and into an exception,
instead of a driver's IRP dispatch routine. This is consistent with the stack having been orrupted and the IRP dispatch routine causing an exception when attempting to return to its caller by referencing a corrupted return address. Unfortunately, mechanisms like special pool and system code write protection can't catch this type of bug. Instead, you must take some manual analysis steps to determine indirectly which driver was operating at the time of the corruption. One way is to examine the IRPs that are in progress for the thread that was executing at the time of the stack trash. When a thread issues an I/O request, the I/O manager stores a pointer to the outstanding IRP on the IRP list of the ETHREAD structure for the thread. The !thread debugger command dumps the IRP list of the target thread. (If you don't specify a thread object address, !thread dumps the processor's current thread.)
Then you can look at the IRP with the !irp command:
0: kd> !thread
THREAD 8527fa58 Cid 0d0c.0d10 Teb: 7ffdf000 Win32Thread: fe4ec4f8 RUNNING on processor 0
IRP List:
86b99278: (0006,0094) Flags: 00060000 Mdl: 00000000
Not impersonating
...
0: kd> !irp 86b99278
Irp is active with 1 stacks 1 is current (= 0x86b992e8)
No Mdl: No System Buffer: Thread 8527fa58: Irp stack trace.
cmd flg cl Device File Completion-Context
>[ e, 0] 5 0 853422b0 85e3aed8 00000000-00000000
\Driver\MYFAULT
Args: 00000000 00000000 83360010 00000000
The output shows that the IRP’s current and only stack location (designated with the “>” prefix) is owned by the Myfault driver. If this were a real crash, the next steps would be to ensure that the driver version installed is the most recent available, install the new version if it isn't, and if it is, to enable Driver Verifier on the driver (with all settings except low memory simulation).
Note Most newer drivers built using the WDK are compiled by default to use the
/GS (Buffer Security Check) compiler flag. When the Buffer Security Check option is enabled,
the compiler reserves space before the return address on the stack, which, when the func-
tion executes, is filled with a security cookie. On function exit, the security cookie is verified. A mismatch indicates that a stack overwrite may have occurred, in which case, the
compiler-generated code will call KeBugCheckEx, passing the DRIVER_OVERRAN_STACK_
BUFFER (0xF7) stop code
Manually analyzing the stack is often the most powerful technique when dealing with crashes such as these. Typically, this involves dumping the current stack pointer register (for example, esp and rsp on x86 and x64 processors, respectively). However, because the code responsible for crashing the system itself might modify the stack in ways that make analysis difficult, the processor responsible for crashing the system provides a backing store for the current data in the stack, called KiPreBugcheckStackSaveArea, which contains a copy of the stack before any code in KeBugCheckEx executes.
By using the dps (dump pointer with symbols) command in the debugger, you can dump this area (in-stead of the CPU's stack pointer register) and resolve symbols in an attempt to discover any potential stack traces. In this crash, here's what dumping the stack area eventually revealed on a 32-bit system:
0: kd> dps KiPreBugcheckStackSaveArea KiPreBugcheckStackSaveArea+3000
81d7dd20 881fcc44
81d7dd24 98fcf406 myfault+0x406
81d7dd28 badb0d00
Although this data was located among many other different functions, it is of special interest be-cause it mentions a function in the Myfault driver, which as we've seen was currently executing an IRP, that doesn't show on the stack. For more information on manual stack analysis, see the Debugging Tools for Windows help file and the additional resources referenced later in this chapter.
Hung or Unresponsive Systems
If a system becomes unresponsive (that is, you are receiving no response to keyboard or mouse
input), the mouse freezes, or you can move the mouse but the system doesn't respond to clicks, the system is said to have hung. A number of things can cause the system to hang:
■ A device driver does not return from its interrupt service (ISR) routine or deferred procedure
call (DPC) routine
■ A high priority real-time thread preempts the windowing system driver's input threads
■ A deadlock (when two threads or processors hold resources each other wants and neither will
yield what they have) occurs in kernel mode
You can check for deadlocks by using the Driver Verifier option called deadlock detection. Deadlock detection monitors the use of spinlocks, mutexes, and fast mutexes, looking for patterns that could result in a deadlock. (For more information on these and other synchronization primitives, see Chapter 3 in Part 1.) If one is found, Driver Verifier crashes the system with an indication of which driver causes the deadlock. The simplest form of deadlock occurs when two threads hold resources each other thread wants and neither will yield what they have or give up waiting for the one they want. The first step to troubleshooting hung systems is therefore to enable deadlock detection on suspect drivers, then unsigned drivers, and then all drivers, until you get a crash that pinpoints the driver causing the deadlock.
There are two ways to approach a hanging system so that you can apply the manual crash trouble-shooting techniques described in this chapter to determine what driver or component is causing thehang: the first is to crash the hung system and hope that you get a dump that you can analyze, and the second is to break into the system with a kernel debugger and analyze the system's activity. Both approaches require prior setup and a reboot. You use the same exploration of system state with both approaches to try to determine the cause of the hang.
To manually crash a hung system, you must first add the DWORD registry value HKLM\SYSTEM\
CurrentControlSet\Services\i8042prt\Parameters\CrashOnCtrlScroll and set it to 1. After rebooting,the i8042 port driver, which is the port driver for PS/2 keyboard input, monitors keystrokes in its ISR (discussed further in Chapter 3 in Part 1) looking for two presses of the Scroll Lock key while the right Control key is depressed. When the driver sees that sequence, it calls KeBugCheckEx with the MANUALLY_INITIATED_CRASH (0xE2) stop code that indicates a manually initiated crash. When the system reboots, open the crash dump file and apply the techniques mentioned earlier to try to determine why the system was hung (for example, determining what thread was running when the system hung, what the kernel stack indicates was happening, and so on). Note that this works for most hung system scenarios, but it won't work if the i8042 port driver's ISR doesn't execute. (The i8042 port driver's ISR won't execute if all processors are hung as a result of their IRQL being higher than the ISR's IRQL, or if corruption of system data structures extends to interrupt-related code or data.)
Note Manually crashing a hung system by using the support provided in the i8042
port driver does not work with USB keyboards. It works with PS/2 keyboards only. See
http://msdn.microsoft.com/en-us/library/windows/hardware/ff545499.aspx for information
about enabling USB keyboard support.
You can also trigger a crash if your hardware has a built-in “crash” button. (Some high-end servers have these embedded on their motherboards or exposed via remote management interfaces.) In this case, the crash is initiated by signaling the nonmaskable interrupt (NMI) pin of the system's motherboard. To enable this, set the registry DWORD value HKLM\SYSTEM\CurrentControlSet\Control\CrashControl\NMICrashDump to 1. Then, when you press the dump switch, an NMI is delivered to the system and the kernel's NMI interrupt handler calls KeBugCheckEx. This works in more cases than the i8042 port driver mechanism because the NMI IRQL is always higher than that of the i8042 port driver interrupt. See http://support.microsoft.com/kb/927069 for more information.
If you are unable to manually generate a crash dump, you can attempt to break into the hungsystem by first making the system boot into debugging mode. You do this in one of two ways. You can press the F8 key during the boot and select Debugging Mode, or you can create a debugging-mode boot option in the BCD by copying an existing boot entry and adding the debug option. When using the F8 approach, the system will use the default connection (serial port COM1 and 115200 baud), but you can use the F10 key to display the Edit Boot Options screen to edit debug-related boot options. With the debug option enabled, you must also configure the connection mechanism to be used between the host system running the kernel debugger and the target system booting in debugging mode and then configure the transport parameters appropriately for the connection type. The three connection types are a null modem cable using a serial port, an IEEE 1394 (FireWire) cable using 1394 ports on each system, or a USB 2.0 host-to-host dongle using USB ports on each system. For details on configuring the host and target system for kernel debugging, see the Debugging Tools for Windows help file and the “Attaching a Kernel Debugger” experiment later in the chapter.
When booting in debugging mode, the system loads the kernel debugger at boot time and makes it ready for a connection from a kernel debugger running on a different computer connected through a serial cable, IEEE 1394 cable, or USB 2.0 host-to-host dongle. Note that the kernel debugger's presence does not affect performance. When the system hangs, run the WinDbg or Kd debugger on the connected system, establish a kernel debugging connection, and break into the hung system. This approach will not work if interrupts are disabled or the kernel debugger has become corrupted.
Note Booting a system in debugging mode does not affect performance if it's not
connected to another system. Also, if a system booted in debugging mode is configured to
automatically reboot after a crash, it will not wait for a connection from another system if a debugger isn't already connected.
Instead of leaving the system in its halted state while you perform analysis, you can also use the debugger .dump command to create a crash dump file on the host debugger machine. Then you can reboot the hung system and analyze the crash dump offline (or submit it to Microsoft). Note that this can take a long time if you are connected using a serial null modem cable or USB 2.0 connection (versus a higher speed 1394 connection), so you might want to just capture a minidump using the .dump /m command. Alternatively, if the target machine is capable of writing a crash dump, you can force it to do so by issuing the .crash command from the debugger. This will cause the target machine to create a dump on its local hard drive that you can examine after the system reboots.
EXPERIMENT: Dumping Hyper-V Guests Using LiveKd
The LiveKd tool, in addition to allowing the use of the .dump command on a live system, also
permits a crash dump of a running Hyper-V guest to be created. To query the list of running
guests on a Hyper-V host, the –hvl option can be specified. LiveKd will display both the name of
the guest virtual machine and its partition GUID:
C:\Users\Administrator>livekd -hvl
LiveKd v5.2 - Execute kd/windbg on a live system
Sysinternals - www.sysinternals.com
Copyright (C) 2000-2012 Mark Russinovich and Ken Johnson
Partition GUID Name
7EB669F2-EB6E-405D-94EA-21CB2ABD0A52 Windows Server 2008
D57D7601-D154-473B-847D-C3C77413AD0B Windows Server 2003
Once the name or the partition GUID of the target Hyper-V guest has been obtained, it can
be passed to LiveKd using the –hv option, along with the –o switch, specifying where to write
the crash dump file. LiveKd will write a complete dump, which requires enough free disk space
on the destination volume equal to the amount of memory assigned to the virtual machine.
Because the Hyper-V guest is still running, LiveKd might run into situations in which data struc-
tures are in the middle of being changed by the system and are inconsistent. To prevent such an
event from occurring, LiveKd is able to pause the Hyper-V guest before writing the crash dump
by specifying the –p option.
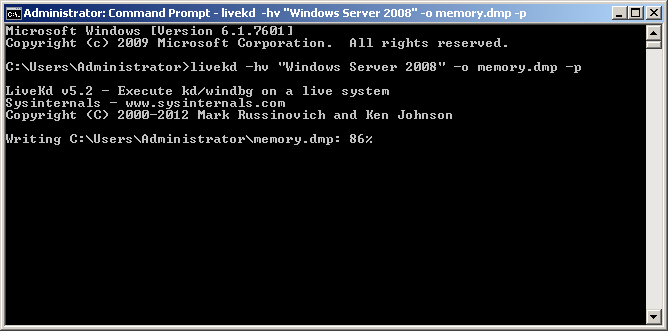
LiveKd takes the additional step of writing a comment to the header of the crash dump file,specifying that a live system view was taken—notifying the user performing analysis of any possible inconsistencies. After LiveKd finishes writing the crash dump file, the file can then be analyzed using any of the kernel debuggers and techniques described earlier in the chapter.
If the Hyper-V guest was previously in the running state, LiveKd will automatically resume thetarget system.You can cause a hang by running Notmyfault and selecting the Hang With DPC option. This causes the Myfault driver to queue a DPC on each processor of the system that executes an infinite loop.Because the IRQL of the processor while executing DPC functions is DPC/dispatch level, the keyboard ISR will respond to the special keyboard crashing sequence. Once you've broken into a hung system or loaded a manually generated dump from a hung sys-tem into a debugger, you should execute the !analyze command with the –hang option. This causes the debugger to examine the locks on the system and try to determine whether there's a deadlock and, if so, what driver or drivers are involved. However, for a hang like the one that Notmyfault's Hang With DPC option generates, the !analyze analysis command will report nothing useful.
If the !analyze command doesn't pinpoint the problem, execute !thread and !process in each of the dump's CPU contexts to see what each processor is doing. (Switch CPU contexts with the ~s command—for example, use ~1s to switch to processor 1’s context.) If a thread has hung the system by executing in an infinite loop at an IRQL of DPC/dispatch level or higher, you'll see the driver module in which it has become stuck in the stack trace of the !thread command. The stack trace of the crash dump you get when you crash a system experiencing the Notmyfault hang bug looks like this:
STACK_TEXT:
8078ae30 8cb49160 000000e2 00000000 00000000 nt!KeBugCheckEx+0x1e
8078ae60 8cb49768 00527658 010001c6 00000000 i8042prt!I8xProcessCrashDump+0x251
8078aeac 8287c7ad 851c8780 855275a0 8078aed8 i8042prt!I8042KeyboardInterruptService+0x2ce
8078aeac 91d924ca 851c8780 855275a0 8078aed8 nt!KiInterruptDispatch+0x6d
WARNING: Stack unwind information not available. Following frames may be wrong.
8078afa4 828a5218 82966d20 86659780 00000000 myfault+0x4ca
The top few lines of the stack trace reference the routines that execute when you type the i8042 port driver's crash key sequence. The presence of the Myfault driver indicates that it might be responsible for the hang. Another command that might be revealing is !locks, which dumps the status of all executive resource locks. By default, the command lists only resources that are under contention, which means that they are both owned and have at least one thread waiting to acquire them.Examine the thread stacks of the owners with the !thread command to see what driver they might be executing in. Sometimes you will find that the owner of one of the locks is waiting for an IRP to complete (a list of IRPs related to a thread is displayed in the !thread output). In these cases it is very hard to tell why an IRP is not making forward progress. (IRPs are usually queued to privately managed driver queues before they are completed). One thing you can do is examine the IRP with the !irp command and find the driver that pended the IRP (it will have the word “pending” displayed in its stack location from the !irp output). Once you have the driver name, you can use the !stacks command to look for other threads that the driver might be running on, which often provides clues about what the lock-owning driver is doing. Much of the time you will find the driver is deadlocked or waiting on some other resource that is blocked waiting for the driver.
When There Is No Crash Dump
In this section, we'll address how to troubleshoot systems that for some reason are not recording a crash dump. One reason why a crash dump might not be recorded is if no paging file is configured to hold the dump. This can easily be remedied by creating a paging file of the required size. A second reason why there might not be a crash dump recorded is because the kernel code and data structures needed to write the crash dump have been corrupted at the time of the crash. As described earlier, this data is captured when the system boots, and if the integrity verification check made at the time of the crash does not match, the system does not even attempt to save the crash dump (so as not to risk corrupting data on the disk). So in this case, you need to catch the system as it crashes and then try to determine the reason for the crash.
Another reason occurs when the disk subsystem for the system disk is not able to process disk write requests (a condition that might have triggered the system failure itself). One such condition would be a hardware failure in the disk controller or maybe a cabling issue near the hard disk.
Yet another possibility occurs when the system has drivers that have registered callbacks that are invoked before the crash dump is written. When the driver callbacks are called, they might incorrectly access data structures located in paged memory (for example), which will lead to a second crash. In the case of a crash inside of a secondary dump callback, the system should still have a valid crash dump file but any secondary crash dump data may be missing or incomplete.
One simple option is to turn off the Automatically Restart option in the Startup And Recovery settings so that if the system crashes, you can examine the blue screen on the console. However, only the most straightforward crashes can be solved from just the blue-screen text.
To perform more in-depth analysis, you need to use the kernel debugger to look at the system at the time of the crash. This can be done by booting the system in debugging mode, which is described in the previous section. When a system is booted in debugging mode (with a debugger attached) and crashes, instead of painting the blue screen and attempting to record the dump, it will break into the host kernel debugger. In this way, you can see the reason for the crash and perhaps perform some basic analysis using the kernel debugger commands escribed earlier. As mentioned in the previous section, you can use the .dump command in the debugger to save a copy of the crashed system's memory space for later debugging, thus allowing you to reboot the crashed system and debug the problem offline.
EXPERIMENT: Attaching a Kernel Debugger
Connecting a kernel debugger to a live, running system requires two computers—a target
and a host. The target, the system being debugged, must be booted in debugging mode by
pressing F8 during the boot process and selecting Debugging Mode or by modifying the boot
configuration database from within an elevated command prompt using the BCDEdit tool:
bcdedit /debug on
The system will use the default settings of serial port COM1 and baud rate 115200 if no
other settings are specified. On the host system—the computer running the debugger—the
symbol path option needs to be set so that the debugger can locate the required symbol files.
One option for configuring the symbol path is to use the systemwide environment variable
_NT_SYMBOL_PATH. Setting the systemwide variable allows for other applications, such as
Process Explorer and Process Monitor, to take advantage of the symbol path without requiring
additional configuration. The symbol path can be set via an elevated command prompt by us-
ing the following command:
setx _NT_SYMBOL_PATH srv*c:\symbols*http://msdl.microsoft.com/download/symbols /m
The /m switch specifies that the variable should be set system wide. Without it, the default
option is to set it only for the current user. One final step that’s required is to configure the
transport layer. If two physical computers are being used, this is done by connecting the serial
ports of the computers to each other by using a null modem cable.
In the following example, a Hyper-V guest has been selected as the target. Hyper-V (as is the
case with other virtual-machine technologies) supports the option of configuring a virtual serial
port to communicate with a physical computer through a named pipe. If you are using multiple
named pipes, each pipe name should be unique to avoid a conflict.
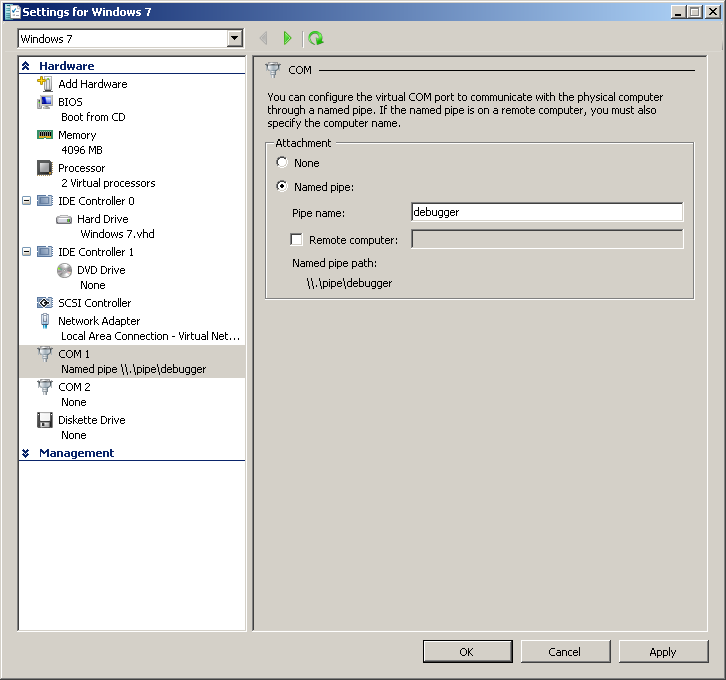
Before restarting the target system, the debugger on the host needs to be configured to
specify the named pipe that should be used as a transport. Both the resets=0 and reconnect op-
tions specified in the following command are required when connecting to Hyper-V guests. (For
other virtual-machine technologies, refer to the Debugging Tools for Windows help file.) The
command shown here will start a debugging session on a virtual machine, which is running on
the same physical computer as the debugger:
windbg -k com:pipe,port=\\.\pipe\debugger,resets=0,reconnect
The WinDbg command window should appear with a prompt that the debugger is waiting
to connect:
Microsoft (R) Windows Debugger Version 6.12.0002.633 AMD64
Copyright (c) Microsoft Corporation. All rights reserved.
Waiting for pipe \\.\pipe\debugger
Waiting to reconnect...
At this point, the target system should be restarted. After a brief period, the two systems
should connect via the named pipe. The following output confirms that the host is now con-
nected to the target system through the kernel debugger:
Connected to Windows 7 7601 x86 compatible target at
(Mon Mar 12 19:34:01.295 2012 (UTC - 7:00)), ptr64 FALSE
Kernel Debugger connection established.
Symbol search path is: srv*c:\symbols*http://msdl.microsoft.com/download/symbols
Executable search path is:
Windows 7 Kernel Version 7601 (Service Pack 1) MP (1 procs) Free x86 compatible
Built by: 7601.17514.x86fre.win7sp1_rtm.101119-1850
Machine Name:
Kernel base = 0x82813000 PsLoadedModuleList = 0x8295d850
System Uptime: not available
To verify that the system will break into the debugger when a crash occurs, the /bugcheck
option of Notmyfault can be used to crash the system. As is the case with other Notmyfault
functions, a control code is sent to the Myfault.sys driver. The control code specifies that the
KeBugCheckEx routine should be called, passing it a reference to the stop code. Here is an ex-
ample of using a user-defined stop code:
notmyfault /bugcheck 0xdeaddead
When a debugger is connected to the system and a crash occurs, control is given to the
debugger before painting the blue screen and any bugcheck callbacks have been called. This
allows for further analysis to be performed or for breakpoints to be set:
*** Fatal System Error: 0xdeaddead
(0x00000000,0x00000000,0x00000000,0x00000000)
Break instruction exception - code 80000003 (first chance)
A fatal system error has occurred.
Debugger entered on first try; Bugcheck callbacks have not been invoked.
A fatal system error has occurred.
...
The operating system code and data structures that handle processor exceptions can becomecorrupted such that a series of recursive faults occur. One example of this would be if the operating system trap handler got corrupted and caused a page fault. This would invoke the page fault handler,which would fault again, and so on. If such a situation occurred, the system would be hopelessly stuck.To prevent such a situation from occurring, CPUs have a built-in recursive fault protection mechanism,which sets a hard limit on the depth of a recursive fault. On most x86 processors, a fault can nest to two levels deep. When the third recursive fault occurs, the processor resets itself and the machine reboots. This is called a triple fault. This can happen when there's a faulty hardware component as well.Even a kernel debugger won't be invoked in a triple fault situation. However, sometimes the mere fact that the kernel debugger doesn't activate can confirm that there's a problem with newly added hardware or drivers.
Note You can use the kernel debugger to trigger a triple fault on a machine by
setting a breakpoint on the kernel debugger dispatch routine KiDispatchException. This
happens because the exception dispatcher now causes a breakpoint exception, which invokes the
exception dispatcher, and so on.
Analysis of Common Stop Codes
The following sections provide a walkthrough of common stop codes reported to Microsoft’s Online Crash Analysis service. For each stop code presented, the analysis begins with the verbose output of the analysis engine's !analyze –v command.
The reasons for each type of crash may vary, as will the commands and techniques used to analyze them. For more information on analyzing common stop codes, see the Debugging Tools for Windows help file and the additional resources referenced later in this chapter.
0xD1 - DRIVER_IRQL_NOT_LESS_OR_EQUAL
The DRIVER_IRQL_NOT_LESS_OR_EQUAL (0xD1) stop code is the result of a device driver attempting to access a pageable or invalid address at an interrupt request level that is too high. This stop code is usually the result of device drivers using improper addresses.
DRIVER_IRQL_NOT_LESS_OR_EQUAL (d1)
An attempt was made to access a pageable (or completely invalid) address at an
interrupt request level (IRQL) that is too high. This is usually
caused by drivers using improper addresses.
If kernel debugger is available get stack backtrace.
Arguments:
Arg1: a0a91660, memory referenced
Arg2: 00000002, IRQL
Arg3: 00000000, value 0 = read operation, 1 = write operation
Arg4: 85701579, address which referenced memory
In analyzing a stop DRIVER_IRQL_NOT_LESS_OR_EQUAL (0xD1), viewing the stack trace of the
thread that was executing at the time of the crash will reveal the device driver that was referencing
pageable or invalid memory:
STACK_TEXT:
8b94bb3c 85701579 badb0d00 84f40600 a0a4f660 nt!KiTrap0E+0x2cf
WARNING: Stack unwind information not available. Following frames may be wrong.
8b94bbb8 85701849 86ffe5d8 8b94bbfc 857018ac myfault+0x579
8b94bbc4 857018ac 850d6890 00000001 00000000 myfault+0x849
8b94bbfc 8283e593 86efaa98 86ffe5d8 86ffe5d8 myfault+0x8ac
8b94bc14 82a3299f 850d6890 86ffe5d8 86ffe648 nt!IofCallDriver+0x63
8b94bc34 82a35b71 86efaa98 850d6890 00000000 nt!IopSynchronousServiceTail+0x1f8
8b94bcd0 82a7c3f4 86efaa98 86ffe5d8 00000000 nt!IopXxxControlFile+0x6aa
8b94bd04 828451ea 000000b8 00000000 00000000 nt!NtDeviceIoControlFile+0x2a
8b94bd04 776f70b4 000000b8 00000000 00000000 nt!KiFastCallEntry+0x12a
0012f994 00000000 00000000 00000000 00000000 0x776f70b4
The debugger's analysis engine is able to locate and display the trap frame that was created when the exception that caused the crash occurred. The trap frame contains the kernel thread's machine state, which includes the register values of the CPU that the thread was executing on. The instruction pointer register (eip on an x86 processor and rip on an x64) contains the address of the instruction that, when executed, generated the trap. The lower line of the output from the .trap command in the debugger lists the address of the instruction that caused the crash, its binary code, assembly language mnemonic, and assembly language details:
TRAP_FRAME: 8b94bb3c -- (.trap 0xffffffff8b94bb3c)
ErrCode = 00000000
eax=a0a91660 ebx=86ffe5f0 ecx=00200073 edx=84f40600 esi=a0a4f660 edi=00000000
eip=85701579 esp=8b94bbb0 ebp=8b94bbb8 iopl=0 nv up ei ng nz na pe nc
cs=0008 ss=0010 ds=0023 es=0023 fs=0030 gs=0000 efl=00010286
myfault+0x579:
85701579 8b08 mov ecx,dword ptr [eax] ds:0023:a0a91660=????????
The first bugcheck parameter of a stop DRIVER_IRQL_NOT_LESS_OR_EQUAL (0xD1) points to the
memory address that was being referenced by the device driver. If the debugger is unable to display an address (because it is invalid or not present in the dump file), a series of question marks is displayed. In the trap frame just shown, the debugger has been unable to resolve the address of the memory referenced by the device driver.
Viewing the output of the !pte command for the address that was referenced confirms that the valid bit for the page table entry is not set, which indicates that the address does not map to a page in physical memory:
0: kd> !pte a0a91660
VA a0a91660
PDE at C0602828 PTE at C0505488
contains 0000000010BE6863 contains 00007A1800000000
pfn 10be6 ---DA--KWEV not valid
PageFile: 0
Offset: 7a18
Protect: 0
0x8E - KERNEL_MODE_EXCEPTION_NOT_HANDLED
The KERNEL_MODE_EXCEPTION_NOT_HANDLED (0x8E) stop message is caused by a kernel-mode
thread generating an exception that was not handled. The first bugcheck parameter identifies the ex-
ception code for which a handler was not found. Common exception codes are STATUS_BREAKPOINT
(0x80000003) and STATUS_ACCESS_VIOLATION (0xC0000005).
KERNEL_MODE_EXCEPTION_NOT_HANDLED (8e)
This is a very common bugcheck. Usually the exception address pinpoints
the driver/function that caused the problem. Always note this address
as well as the link date of the driver/image that contains this address.
Some common problems are exception code 0x80000003. This means a hard
coded breakpoint or assertion was hit, but this system was booted
/NODEBUG. This is not supposed to happen as developers should never have
hardcoded breakpoints in retail code, but ...
If this happens, make sure a debugger gets connected, and the
system is booted /DEBUG. This will let us see why this breakpoint is
happening.Arguments:
Arg1: 80000003, The exception code that was not handled
Arg2: 92c70a78, The address that the exception occurred at
Arg3: 9444fb4c, Trap Frame
Arg4: 00000000
Viewing the stack trace of the crashed thread can give an indication of the driver or function that
caused the problem. If there’s nothing that looks suspicious, viewing the address where the exception
occurred should provide more details. The stack trace from a crashed system looks like this:
STACK_TEXT:
9444f6b4 828ba08c 0000008e 80000003 92c70a78 nt!KeBugCheckEx+0x1e
9444fadc 82843dd6 9444faf8 00000000 9444fb4c nt!KiDispatchException+0x1ac
9444fb44 82844678 9444fbc4 92c70a79 badb0d00 nt!CommonDispatchException+0x4a
9444fb44 92c70a79 9444fbc4 92c70a79 badb0d00 nt!KiTrap03+0xb8
WARNING: Stack unwind information not available. Following frames may be wrong.
9444fbc4 92c70b1c 8730f980 00000001 00000000 myfault+0xa79
9444fbfc 8283c593 87314a08 87279950 87279950 myfault+0xb1c
9444fc14 82a3099f 8730f980 87279950 872799c0 nt!IofCallDriver+0x63
9444fc34 82a33b71 87314a08 8730f980 00000000 nt!IopSynchronousServiceTail+0x1f8
9444fcd0 82a7a3f4 87314a08 87279950 00000000 nt!IopXxxControlFile+0x6aa
9444fd04 828431ea 000000c4 00000000 00000000 nt!NtDeviceIoControlFile+0x2a
9444fd04 772c70b4 000000c4 00000000 00000000 nt!KiFastCallEntry+0x12a
0012f2ac 00000000 00000000 00000000 00000000 0x772c70b4
The second bugcheck parameter contains the location in memory that the exception occurred at.
In the case of a STATUS_BREAKPOINT exception, unassembling the address will confirm the presence
of a breakpoint instruction. The processor instruction INT 3 is called the trap to debugger instruction.
An INT 3 instruction, when executed, causes the system to call the kernel’s debugger exception han-
dler. If a debugger is attached to the computer, the system will break in.
0: kd> u 92c70a78
myfault+0xa78:
92c70a78 cc int 3
...
Breakpoints shouldn’t usually appear in retail versions of device drivers. Using the lm command, it’s
sometimes possible to determine which environment a device driver was targeted for. When compil-
ing a driver for release (and unless overridden by the developer), a flag is set indicating the release
type. When viewing the File flags property, the presence of the word Debug indicates that the driver
was built using a checked (or debug) environment:
0: kd> lm kv m myfault
start end module name
92c70000 92c71880 myfault (no symbols)
Loaded symbol image file: myfault.sys
Image path: \??\C:\Windows\system32\drivers\myfault.sys
Image name: myfault.sys
Timestamp: Sat Apr 07 09:34:40 2012 (4F806CA0)
CheckSum: 00004227
ImageSize: 00001880
File version: 4.0.0.0
Product version: 4.0.0.0
File flags: 1 (Mask 3F) Debug
File OS: 40004 NT Win32
...
A breakpoint in a debug version of a driver could also indicate the failure of an ASSERT macro. If a
kernel debugger is attached to the system, a message would be displayed followed by a prompt ask-
ing the user what to do about the assertion failure.
0x7F - UNEXPECTED_KERNEL_MODE_TRAP
An UNEXPECTED_KERNEL_MODE_TRAP (0x7F) stop code indicates that the CPU generated a trap that
the Windows kernel failed to handle. The trap could be the result of a bound trap (which the kernel is
not permitted to catch) or a double fault (a fault that occurs while the kernel is processing an earlier
fault). The first bugcheck parameter defines the type of trap.
UNEXPECTED_KERNEL_MODE_TRAP (7f)
This means a trap occurred in kernel mode, and it's a trap of a kind
that the kernel isn't allowed to have/catch (bound trap) or that
is always instant death (double fault). The first number in the
bugcheck params is the number of the trap (8 = double fault, etc)
Consult an Intel x86 family manual to learn more about what these
traps are. Here is a *portion* of those codes:
If kv shows a taskGate
use .tss on the part before the colon, then kv.
Else if kv shows a trapframe
use .trap on that value
Else
.trap on the appropriate frame will show where the trap was taken
(on x86, this will be the ebp that goes with the procedure KiTrap)
Endif
kb will then show the corrected stack.
Arguments:
Arg1: 00000008, EXCEPTION_DOUBLE_FAULT
Arg2: 801db000
Arg3: 00000000
Arg4: 00000000
Most traps in this category are the result of faulty or failed hardware. If you recently added new
hardware to the computer, try removing it to see whether the problem no longer occurs. Remove
any existing hardware that may have failed and have it replaced. It’s also recommended to run any
manufacturer-supplied hardware-diagnostic tools to determine which components may have failed.
There are, however, certain traps that are the result of software errors. Viewing the trap frame that
was generated or the task gate (depending on the type of trap) displays the instruction that gener-
ated the trap:
TSS: 00000028 -- (.tss 0x28)
eax=8336001c ebx=86d57388 ecx=83360044 edx=00000000 esi=86d57388 edi=00000000
eip=96890918 esp=92985000 ebp=92987bc4 iopl=0 nv up ei pl zr na pe nc
cs=0008 ss=0010 ds=0023 es=0023 fs=0030 gs=0000 efl=00010246
myfault+0x918:
96890918 e8f9ffffff call myfault+0x916 (96890916)
The type of trap described earlier, an EXCEPTION_DOUBLE_FAULT, is usually the result of one of
two common causes—a kernel stack overflow or faulty hardware. A kernel stack overflow occurs
when a kernel thread’s guard page is hit, as a result of having exhausted all of the current thread’s
stack allocation. The kernel attempts to push a trap frame onto the stack—for which no more space
exists—causing a double fault.
Using the !thread command to verify the stack limits of the thread that was executing confirms
whether the double fault was caused by a kernel stack overflow:
0: kd> !thread
THREAD 850e3918 Cid 0fb8.0fbc Teb: 7ffde000 Win32Thread: fe4f0dd8 RUNNING on processor 0
IRP List:
86d57370: (0006,0094) Flags: 00060000 Mdl: 00000000
Not impersonating
DeviceMap 8fa3b8e8
Owning Process 85100670 Image: NotMyfault.exe
Attached Process N/A Image: N/A
Wait Start TickCount 21664 Ticks: 0
Context Switch Count 461
UserTime 00:00:00.000
KernelTime 00:00:00.046
Win32 Start Address 0x00fe27ff
Stack Init 92987fd0 Current 92987af8 Base 92988000 Limit 92985000 Call 0
Priority 12 BasePriority 8 UnusualBoost 0 ForegroundBoost 2 IoPriority 2 PagePriority 5
ChildEBP RetAddr Args to Child
00000000 96890918 00000000 00000000 00000000 nt!KiTrap08+0x75 (FPO: TSS 28:0)
WARNING: Stack unwind information not available. Following frames may be wrong.
92987bc4 96890b1c 87015038 00000001 00000000 myfault+0x918
92987bfc 82845593 85154158 86d57370 86d57370 myfault+0xb1c
92987c14 82a3999f 87015038 86d57370 86d573e0 nt!IofCallDriver+0x63
92987c34 82a3cb71 85154158 87015038 00000000 nt!IopSynchronousServiceTail+0x1f8
92987cd0 82a833f4 85154158 86d57370 00000000 nt!IopXxxControlFile+0x6aa
92987d04 8284c1ea 000000c4 00000000 00000000 nt!NtDeviceIoControlFile+0x2a
92987d04 779a70b4 000000c4 00000000 00000000 nt!KiFastCallEntry+0x12a (FPO: [0,3]
TrapFrame @ 92987d34)
0012f424 00000000 00000000 00000000 00000000 0x779a70b4
The two values of interest are the stack base and the stack limit. Comparing the value of the stack
limit with the value stored in the stack pointer register (esp in this case) of the task state segment
shown earlier confirms that the lower limit of the stack has been reached. (Both locations contain the
same value.)
To understand what component has used all of the kernel thread’s stack allocation requires the
two values obtained earlier—the stack base and the stack limit. Using the dps command with both
values displays the thread’s stack, using symbols to resolve any function names:
0: kd> dps 92985000 92988000
92985000 9689091d myfault+0x91d
92985004 9689091d myfault+0x91d
92985008 9689091d myfault+0x91d
...
In this output, a repeating address is shown for the Myfault.sys driver. This is consistent with a de-
vice driver that is recursively calling into itself. Each call to a function pushes the return address onto
the stack—growing the stack and contributing to the thread’s overall stack limit. The return address
is popped off the stack only when the function returns. In the case of a driver or function recursively
calling itself, each function called never returns.
0xC5 - DRIVER_CORRUPTED_EXPOOL
Diagnosing the cause of pool corruption can be difficult, if not virtually impossible, without the use of
additional tools. The recommended course of action for troubleshooting any type of pool corruption
issue is to enable the special pool option of Driver Verifier against any new or suspect drivers. Before
you enable Driver Verifier, spending a few extra minutes analyzing the crash may yield some interest-
ing results.
The cause of a DRIVER_CORRUPTED_EXPOOL (0xC5) stop code is the result of an attempt to access
a pageable or invalid address at an IRQL that is too high. The stop code originates from the kernel as
a stop IRQL_NOT_LESS_OR_EQUAL (0xA). Inside the kernel’s KeBugCheck2 function (for which KeBug-
CheckEx is just a stub), the system checks the value of the stop code. If the stop code’s value is equal
to IRQL_NOT_LESS_OR_EQUAL (0xA), the system queries the fourth bugcheck parameter, which is the
address that referenced the memory that led to the crash. If the address lies between the regions of
memory that contain the Windows executive’s pool functions, the system changes the stop code to
DRIVER_CORRUPTED_EXPOOL (0xC5). The reason for modifying the stop code is to highlight that it's
not the fault of the pool routines, but rather that one of the pool structures they manage has been
corrupted.
DRIVER_CORRUPTED_EXPOOL (c5)
An attempt was made to access a pageable (or completely invalid) address at an
interrupt request level (IRQL) that is too high. This is
caused by drivers that have corrupted the system pool. Run the driver
verifier against any new (or suspect) drivers, and if that doesn't turn up
the culprit, then use gflags to enable special pool.
Arguments:
Arg1: 4f4f4f53, memory referenced
Arg2: 00000002, IRQL
Arg3: 00000000, value 0 = read operation, 1 = write operation
Arg4: 829234a7, address which referenced memory
In the case of pool corruption, a stack trace almost always points to Ntoskrnl or another device
driver as being the likely cause of the crash. In the following example, the stack trace of the thread
that was executing when the system crashed lists only Windows operating system functions:
STACK_TEXT:
8b8e3554 829234a7 badb0d00 00000000 91470d90 nt!KiTrap0E+0x2cf
8b8e3610 8288d2c6 00000000 00000280 76615358 nt!ExAllocatePoolWithTag+0x49d
8b8e3620 8288d19d 00000001 00000053 8b8e38a8 nt!KeAllocateXStateContext+0x25
8b8e3644 8288d6b5 00000003 00000000 8b8e37b4 nt!KeSaveExtendedProcessorState+0x104
8b8e3658 9139b443 8b8e37b4 fe7b8010 8288d038 nt!KeSaveFloatingPointState+0x14
8b8e3864 9139bfdb fe8af408 ffbbd540 00000000 win32k!EngAlphaBlend+0x230
8b8e38d0 9139c394 fe7b8010 fe989010 fe1c0010 win32k!SURFREFDC::vUnlock+0x1e5
8b8e3974 913a4a2f fe7b8010 fe989010 00000000 win32k!SURFREFDC::vUnlock+0x59e
8b8e39d4 913a4981 fe7b8010 fe989010 00000000 win32k!EngNineGrid+0x6e
8b8e3a34 913a4847 fe7b8010 fe989010 00000000 win32k!EngDrawStream+0x109
8b8e3aa8 913a13a3 8b8e3ba4 00000000 fe989000 win32k!NtGdiDrawStreamInternal+0x232
8b8e3bd4 913a0e09 3a010231 00000000 fe9ef140 win32k!GreDrawStream+0x557
8b8e3d20 828401ea 3a010231 00000060 0012f628 win32k!NtGdiDrawStream+0x8c
8b8e3d20 774570b4 3a010231 00000060 0012f628 nt!KiFastCallEntry+0x12a
0012f49c 75c973a5 75c9738f 3a010231 00000060 ntdll!KiFastSystemCallRet
0012f4a0 75c9738f 3a010231 00000060 0012f628 GDI32!NtGdiDrawStream+0xc
0012f5a4 74243efa 3a010231 00000060 0012f628 GDI32!GdiDrawStream+0x432
The trap frame that was generated when the attempt to access pageable or invalid memory was
made displays the processor instruction that was executed and the register values of the CPU the
thread was executing on. The debugger, with the assistance of the symbol file for the kernel image, is
able to display the name of the function that crashed, using the instruction pointer as a reference:
TRAP_FRAME: 8b8e3554 -- (.trap 0xffffffff8b8e3554)
eax=8b8e35f8 ebx=82939940 ecx=4f4f4f4f edx=00000000 esi=82939da8 edi=82939944
eip=829234a7 esp=8b8e35c8 ebp=8b8e3610 iopl=0 ov up ei ng nz na po cy
cs=0008 ss=0010 ds=0023 es=0023 fs=0030 gs=0000 efl=00010a83
nt!ExAllocatePoolWithTag+0x49d:
829234a7 8b4104 mov eax,dword ptr [ecx+4] ds:0023:4f4f4f53=????????
As with previous examples, the series of question marks is used to represent invalid addresses that
were unable to be displayed by the debugger. In the case of the preceding instruction, the processor
read the address stored in the ecx register, added a value of four to it, and then attempted to refer-
ence the memory pointed to by that address (for storage into the eax register). The resulting address
to be fetched was invalid, causing an exception to be raised by the processor.
To understand why the invalid value was stored in the ecx register, analyzing the set of instruc-
tions that executed prior to the crash may give an indication. The following output shows the results
of unassembling the instruction stream of the crashed thread, backward from the current instruction
pointer:
0: kd> ub 829234a7
nt!ExAllocatePoolWithTag+0x479:
...
829234a5 8b0e mov ecx,dword ptr [esi]
Analysis reveals that the address in the ecx register was written to by an instruction that read the
value pointed to by the esi register. Using the dc command with the address stored in the esi register
of the trap frame shows from where the value 4f4f4f4f originated. What is of interest in the output of
the command is that each of the addresses listed appears as a pair and that the first value—the one
that contains the invalid address—doesn’t match the value adjacent to it:
0: kd> dc 82939da8
82939da8 4f4f4f4f 85045810 82939db0 82939db0 OOOO.X..........
82939db8 82939db8 82939db8 86f749f8 86f749f8 .........I...I..
82939dc8 82939dc8 82939dc8 82939dd0 82939dd0 ................
82939dd8 82939dd8 82939dd8 82939de0 82939de0 ................
82939de8 82939de8 82939de8 82939df0 82939df0 ................
...
Following the suspicion that these values are address pairs and that the first value is invalid, dis-
playing the address next to the corrupted value leads toward determining the cause of the corrup-
tion. The value 4f4f4f4f is OOOO in ASCII, which is apparent in the output shown here:
0: kd> dc 85045810
85045810 4f4f4f4f 4f4f4f4f 4f4f4f4f 4f4f4f4f OOOOOOOOOOOOOOOO
85045820 4f4f4f4f 4f4f4f4f 4f4f4f4f 4f4f4f4f OOOOOOOOOOOOOOOO
85045830 46524556 00574f4c 00000000 00000000 VERFLOW.........
85045840 00000000 00000000 00000000 00000000 ................
85045850 00000000 00000000 00000000 00000000 ................
...
Checking the pool allocation with the !pool command confirms that the allocation, along with its
pool headers, have been corrupted:
0: kd> !pool 85045810
Pool page 85045810 region is Nonpaged pool
85045000 size: 808 previous size: 0 (Allocated) None
85045808 is not a valid large pool allocation, checking large session pool...
85045808 is freed (or corrupt) pool
Bad previous allocation size @85045808, last size was 101
It’s important to note that although corruption has been identified, it may or may not have directly
caused the crash currently being analyzed. Any pool corruption that has been discovered requires
further investigation. Pool corruption left undiagnosed risks further crashes to the system or corrup-
tion of data stored on disk.
Of further interest in the output of the corrupted pool allocation is a reference to the string
OVERFLOW. Using the !for_each_module command, it’s possible to search each loaded module for any
occurrences of the suspect string. The following debugger command displays the name of any loaded
drivers that contain a match for the search phrase:
0: kd> !for_each_module .foreach (address {s -[1]a @#Base @#End "OVERFLOW"}) {lm 1m a address}
BTHUSB
CLASSPNP
CLASSPNP
rfcomm
rfcomm
rfcomm
...
myfault
Further analysis of a crash dump that appears at first to be virtually impossible to diagnose has
narrowed down the list of suspect drivers. The next step would be to enable the special pool option
of Driver Verifier with the device drivers listed.
Hardware Malfunctions
Another type of stop message is the hardware malfunction screen. This type of screen is displayed
when the processor detects a hardware condition. Figure 14-10 shows a sample hardware malfunction
screen. Depending on the type of condition that generated the hardware malfunction, the system
might display additional information indicating the cause of the error. When displaying the hardware
malfunction screen, the system ignores the AutoReboot value of the HKLM\SYSTEM\CurrentControl-
Set\Control\CrashControl registry key and will display the screen indefinitely.
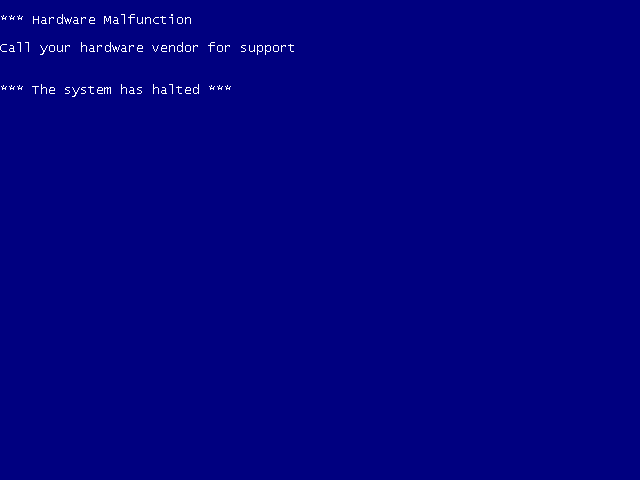
FIGURE 14-10 Example of a hardware malfunction screen
As you should with any stop messages that are suspected to be caused by hardware failures, run
any manufacturer-supplied hardware-diagnostic tools to determine which components, if any, may
have failed. If you recently added new hardware to the computer, try removing it to see whether the
problem no longer occurs. Remove any existing hardware that may have failed, and have it replaced.
Signaling the nonmaskable interrupt (NMI) pin of the system’s motherboard when the HKLM\
SYSTEM\CurrentControlSet\Control\CrashControl\NMICrashDump registry value isn’t set will also
generate a hardware malfunction screen. If the intention was to generate a manual crash dump using
an NMI button for offline analysis, verify that the NMICrashDump value is configured correctly.
EXPERIMENT: The Blue Screen Screen Saver
A great way to remind yourself of what a blue screen looks like or to fool your office workers
and friends is to run the Sysinternals Blue Screen screen saver from Sysinternals. The screen
saver simulates authentic looking blue screens that reflect the version of Windows on which you
run it, generating all blue screen text using actual system information, such as the list of loaded
drivers. It also mimics an automatic reboot, complete with the Windows startup splash screen.
Note that unlike other screen savers, where a mouse movement dismisses them, the Blue Screen
screen saver requires a key press.
By using the following syntax for the Psexec tool from Sysinternals, you can even run the
screen saver on another system:
psexec \\computername –c –f –i –d "SysInternalsBluescreen.scr" –s –accepteula
The command requires that you have administrative privilege on the remote system. (You
can use the –u and –p Psexec switches to specify alternate credentials.) Make sure that your
coworker has a sense of humor!
Conclusion
Although many crashes can be analyzed with some of the techniques described in this chapter, many
require analysis that goes beyond the scope of this book. Here are some additional resources that
may be useful if you want to learn more advanced crash analysis techniques and information:
■ The Microsoft Platforms Global Escalation Services team blog, at http://blogs.msdn.com/
ntdebugging, provides various tips and tricks and real-life scenarios encountered by the team.
■ The website http://www.dumpanalysis.org provides hundreds of patterns and advanced analy-
sis scenarios and hints.


 5万+
5万+

 被折叠的 条评论
为什么被折叠?
被折叠的 条评论
为什么被折叠?
 到【灌水乐园】发言


