


 本文介绍了LiveCharts2,一个功能丰富、易于使用的.NET图表库,适用于多种平台如BlazorWebAssembly。展示了如何在Blazor项目中快速集成基本柱状图和带有延迟动画的图表示例,以及如何通过MVVM模式管理数据和视图。


前言
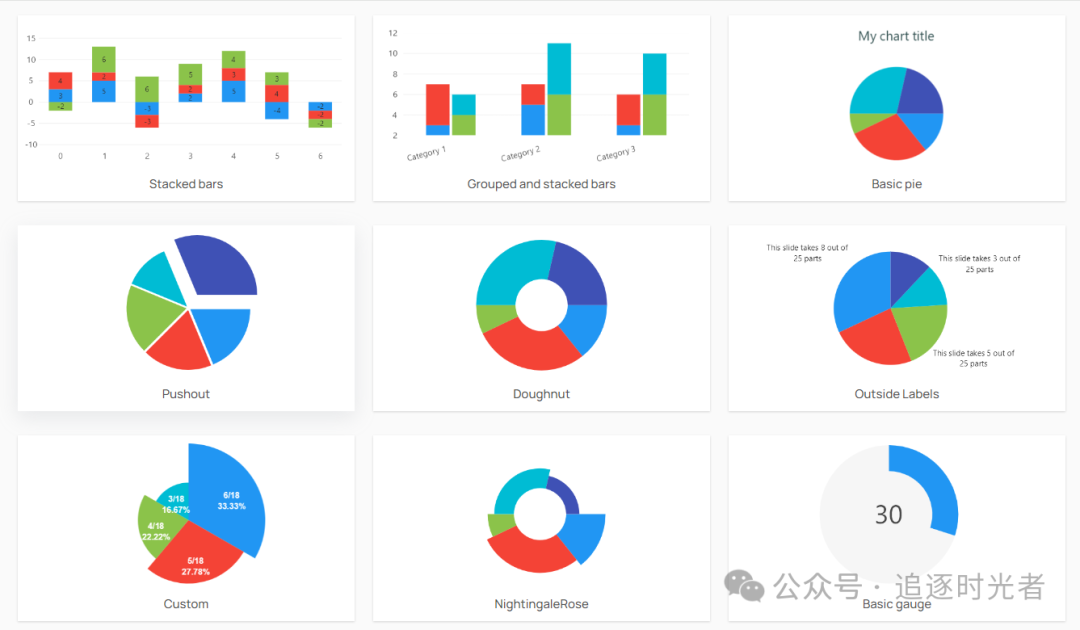
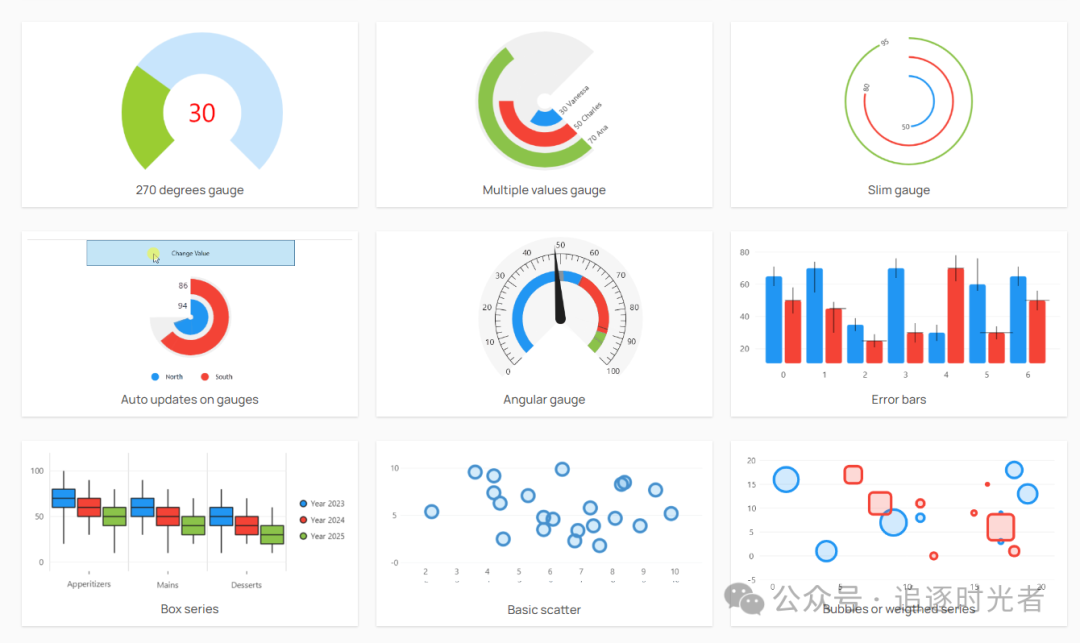
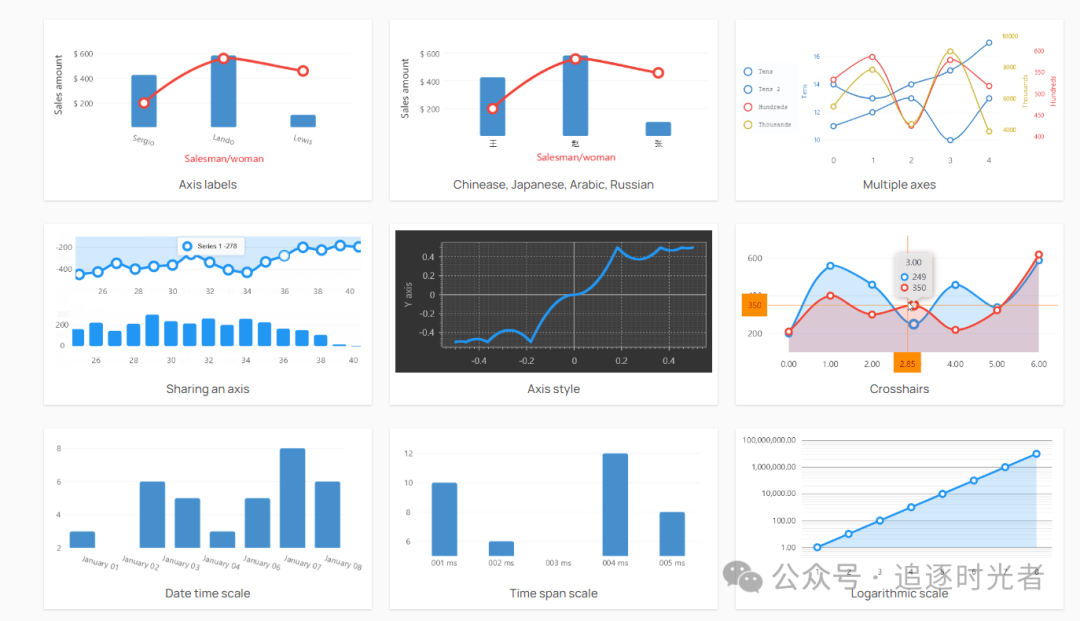
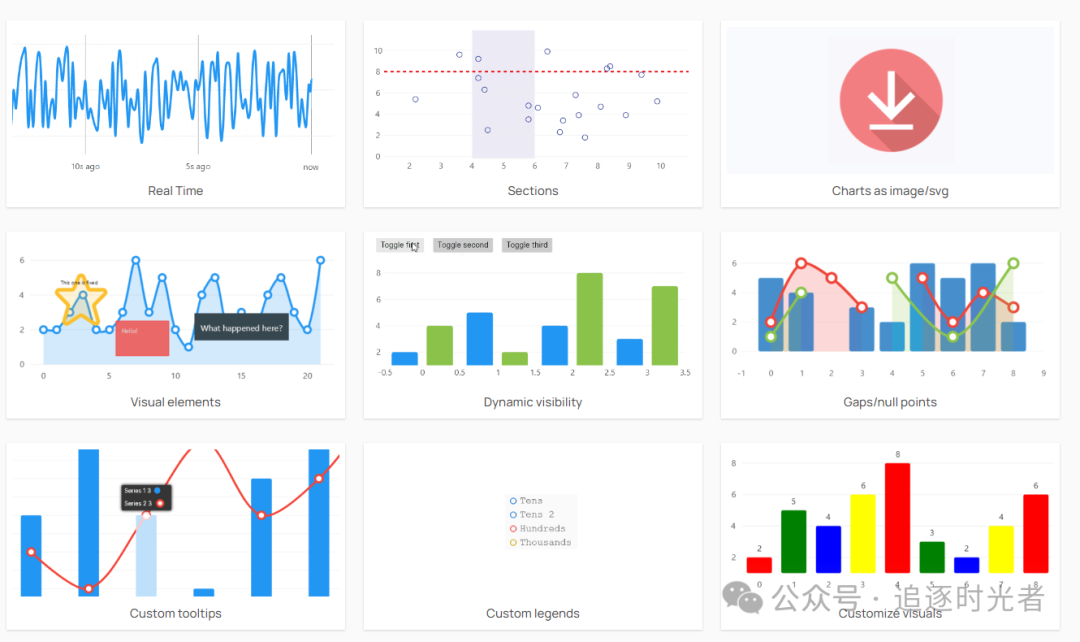
今天大姚给大家分享一个.NET开源(MIT License)、功能强大、简单、灵活、跨平台的图表、地图和仪表库:LiveCharts2。
项目介绍
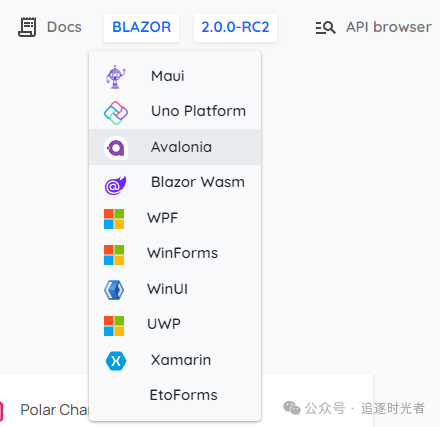
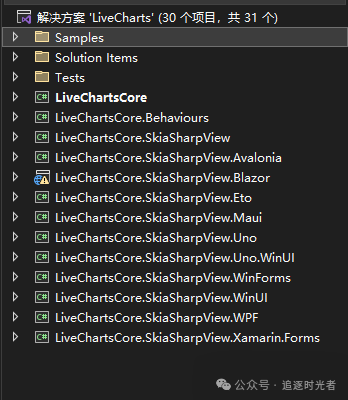
LiveCharts2是一个.NET开源、简单、灵活、交互式且功能强大的.NET图表、地图和仪表,现在几乎可以在任何地方运行如:Maui、Uno Platform、Blazor-wasm、WPF、WinForms、Xamarin、Avalonia、WinUI、UWP。
在线API文档:https://livecharts.dev/docs/blazor/2.0.0-rc2/gallery
项目源代码
Blazor Wasm中快速使用
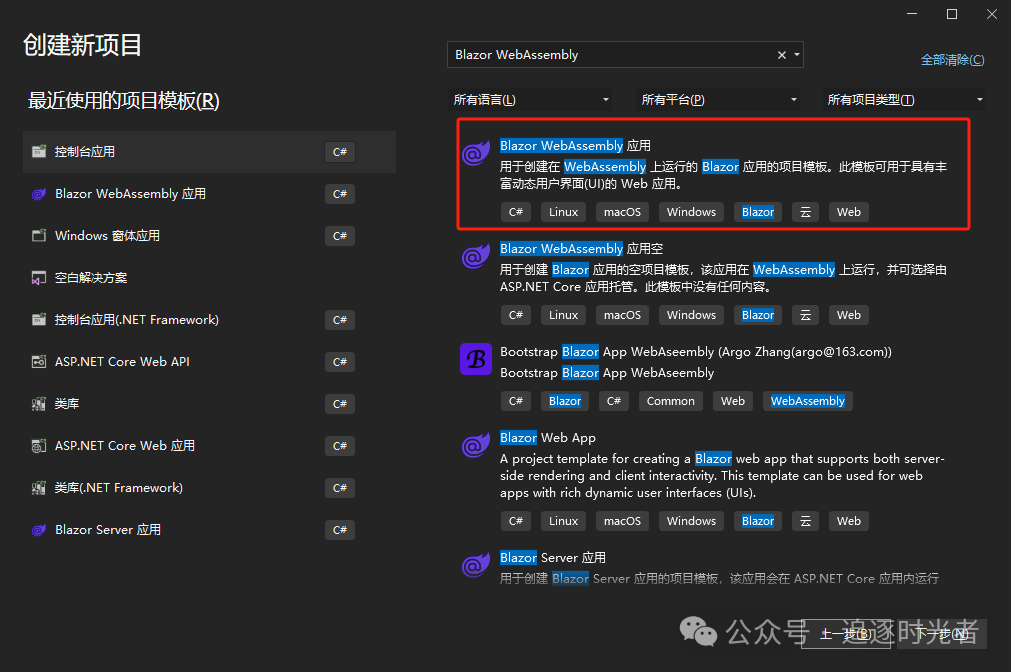
创建Blazor WebAssembly项目
安装NuGet
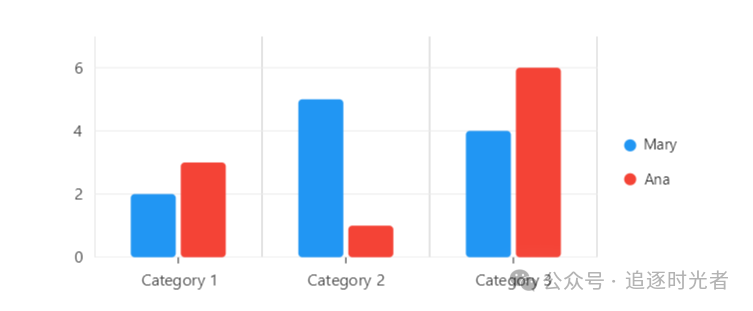
LiveChartsCore.SkiaSharpView.BlazorBasic Bars
View Model
using CommunityToolkit.Mvvm.ComponentModel;
using LiveChartsCore;
using LiveChartsCore.SkiaSharpView;
using LiveChartsCore.SkiaSharpView.Painting;
using SkiaSharp;

namespace ViewModelsSamples.Bars.Basic;

public partial class ViewModel : ObservableObject
{
    public ISeries[] Series { get; set; } =
    {
        new ColumnSeries<double>
        {
            Name = "Mary",
            Values = new double[] { 2, 5, 4 }
        },
        new ColumnSeries<double>
        {
            Name = "Ana",
            Values = new double[] { 3, 1, 6 }
        }
    };

    public Axis[] XAxes { get; set; } =
    {
        new Axis
        {
            Labels = new string[] { "Category 1", "Category 2", "Category 3" },
            LabelsRotation = 0,
            SeparatorsPaint = new SolidColorPaint(new SKColor(200, 200, 200)),
            SeparatorsAtCenter = false,
            TicksPaint = new SolidColorPaint(new SKColor(35, 35, 35)),
            TicksAtCenter = true,
            // By default the axis tries to optimize the number of
            // labels to fit the available space,
            // when you need to force the axis to show all the labels then you must:
            ForceStepToMin = true,
            MinStep = 1
        }
    };
}
HTML
@page "/Bars/Basic"
@using LiveChartsCore.SkiaSharpView.Blazor
@using ViewModelsSamples.Bars.Basic
<CartesianChart
Series="ViewModel.Series"
XAxes="ViewModel.XAxes"
LegendPosition="LiveChartsCore.Measure.LegendPosition.Right">
</CartesianChart>
@code {
public ViewModel ViewModel { get; set; } = new();
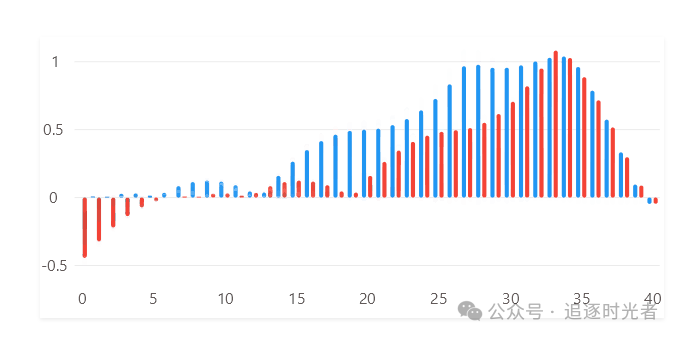
}Delayed Animations
View model
using System;
using System.Collections.Generic;
using CommunityToolkit.Mvvm.ComponentModel;
using LiveChartsCore;
using LiveChartsCore.Drawing;
using LiveChartsCore.Kernel;
using LiveChartsCore.SkiaSharpView;
using LiveChartsCore.SkiaSharpView.Drawing.Geometries;

namespace ViewModelsSamples.Bars.DelayedAnimation;

public partial class ViewModel : ObservableObject
{
    public ViewModel()
    {
        var values1 = new List<float>();
        var values2 = new List<float>();

        var fx = EasingFunctions.BounceInOut; // this is the function we are going to plot
        var x = 0f;

        while (x <= 1)
        {
            values1.Add(fx(x));
            values2.Add(fx(x - 0.15f));
            x += 0.025f;
        }

        var columnSeries1 = new ColumnSeries<float>
        {
            Values = values1,
            Stroke = null,
            Padding = 2
        };

        var columnSeries2 = new ColumnSeries<float>
        {
            Values = values2,
            Stroke = null,
            Padding = 2
        };

        columnSeries1.PointMeasured += OnPointMeasured;
        columnSeries2.PointMeasured += OnPointMeasured;

        Series = new List<ISeries> { columnSeries1, columnSeries2 };
    }

    private void OnPointMeasured(ChartPoint<float, RoundedRectangleGeometry, LabelGeometry> point)
    {
        var perPointDelay = 100; // milliseconds
        var delay = point.Context.Entity.MetaData!.EntityIndex * perPointDelay;
        var speed = (float)point.Context.Chart.AnimationsSpeed.TotalMilliseconds + delay;

        point.Visual?.SetTransition(
            new Animation(progress =>
            {
                var d = delay / speed;

                return progress <= d
                    ? 0
                    : EasingFunctions.BuildCustomElasticOut(1.5f, 0.60f)((progress - d) / (1 - d));
            },
            TimeSpan.FromMilliseconds(speed)));
    }

    public List<ISeries> Series { get; set; }
}
HTML
@page "/Bars/DelayedAnimation"
@using LiveChartsCore.SkiaSharpView.Blazor
@using ViewModelsSamples.Bars.DelayedAnimation
<CartesianChart
Series="ViewModel.Series">
</CartesianChart>
@code {
public ViewModel ViewModel { get; set; } = new();
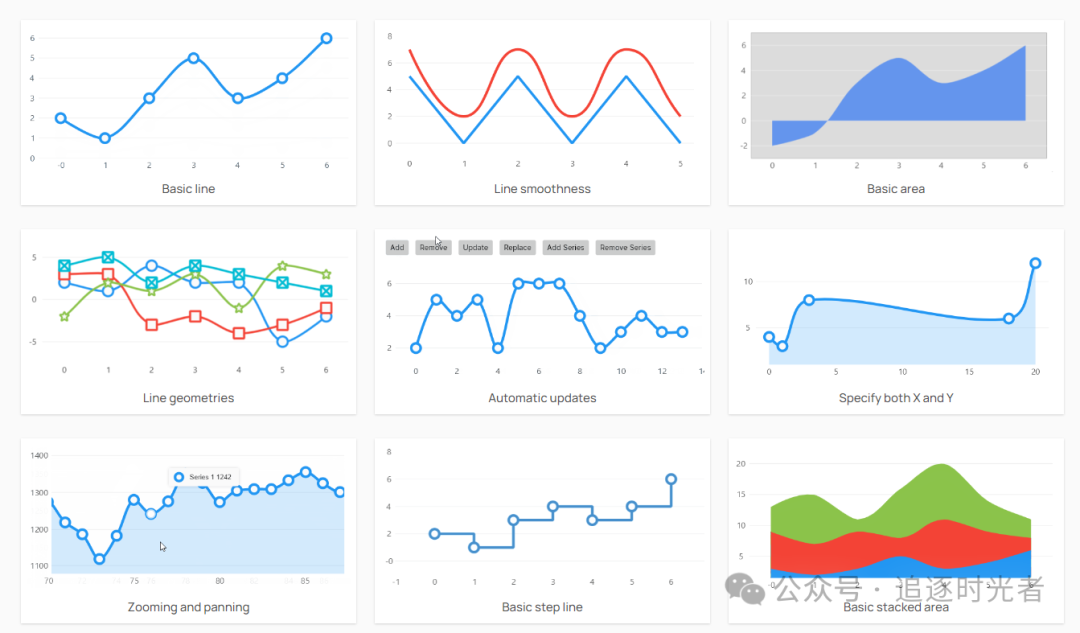
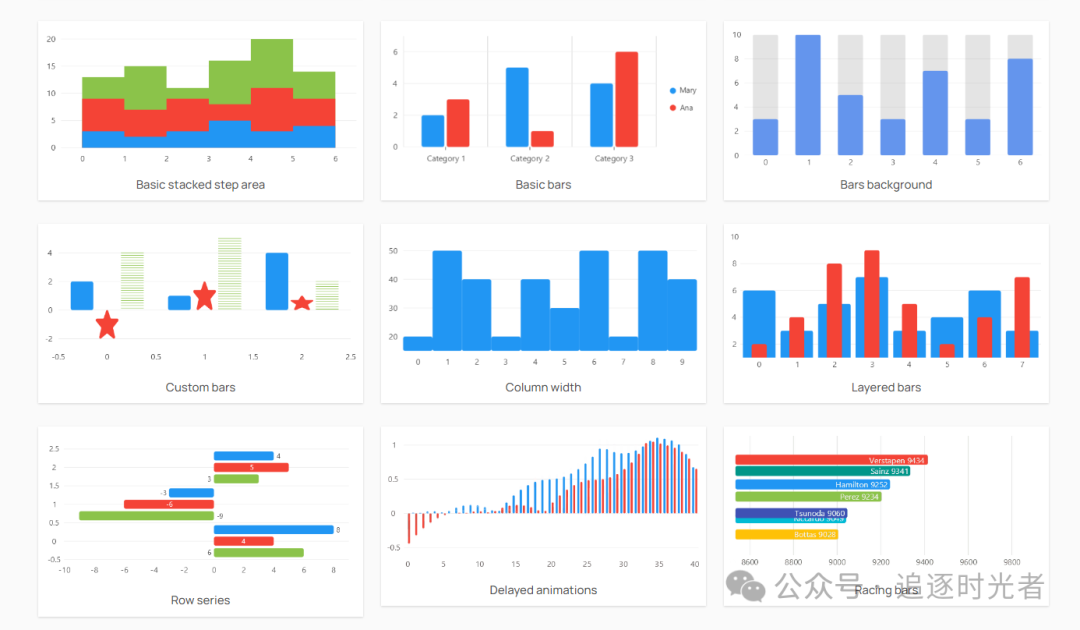
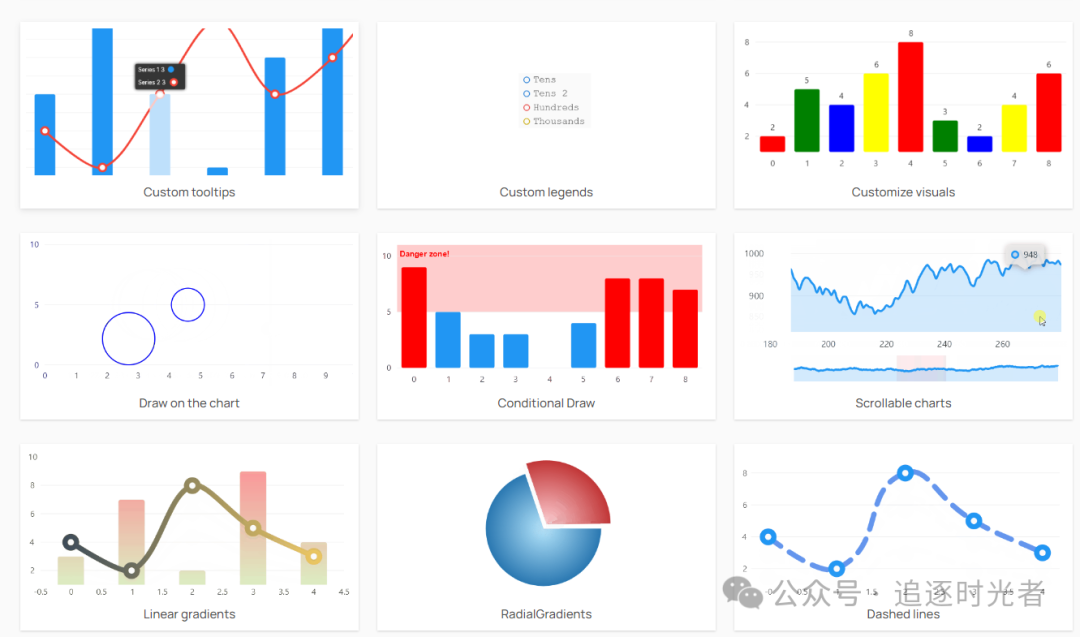
}项目更多图表截图

项目源码地址
更多项目实用功能和特性欢迎前往项目开源地址查看👀,别忘了给项目一个Star支持💖。
https://github.com/beto-rodriguez/LiveCharts2
优秀项目和框架精选
该项目已收录到C#/.NET/.NET Core优秀项目和框架精选中,关注优秀项目和框架精选能让你及时了解C#、.NET和.NET Core领域的最新动态和最佳实践,提高开发工作效率和质量。坑已挖,欢迎大家踊跃提交PR推荐或自荐(让优秀的项目和框架不被埋没🤞)。
https://github.com/YSGStudyHards/DotNetGuide/blob/main/docs/DotNet/DotNetProjectPicks.md

学习是一个永无止境的过程,你知道的越多,你不知道的也会越多,在有限的时间内坚持每天多学一点,你一定能成为你想要成为的那个人。不积跬步无以至千里,不积小流无以成江河!!!


 被折叠的 条评论
为什么被折叠?
被折叠的 条评论
为什么被折叠?
 到【灌水乐园】发言


