


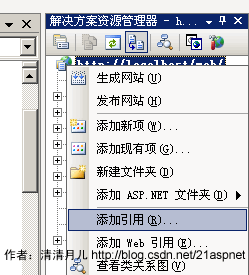
第一步:在网站中引用该组件。
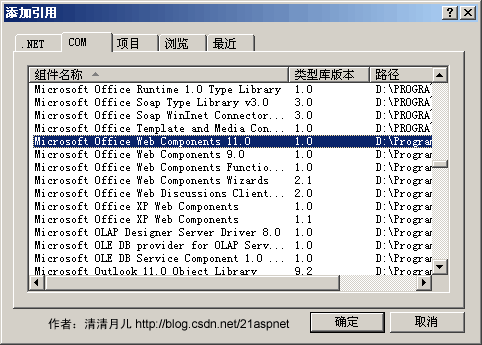
第二步:点击“添加引用”后弹出一个窗口,添加OWC的引用。如图所示:
第三步:代码中引用Microsoft.Office.Interop.Owc11。
注意:如果使用的是vs2010编译器,在引用成功之后owc11的引用属性:在“引用”中右击OWC11,点击“属性” 嵌入互操作类型:false
代码:
前台:
<html xmlns="http://www.w3.org/1999/xhtml">
<head runat="server">
<title></title>
</head>
<body>
<form id="form1" runat="server">
<div>
<asp:PlaceHolder ID="PlaceHolder1" runat="server"></asp:PlaceHolder>
</div>
</form>
</body>
</html>
后台:
using System;
using System.Collections.Generic;
using System.Linq;
using System.Web;
using System.Web.UI;
using System.Web.UI.WebControls;
using System.Web.UI.DataVisualization.Charting;
using Microsoft.Office.Interop.Owc11;
namespace Image
{
public partial class Image1 : System.Web.UI.Page
{
protected void Page_Load(object sender, EventArgs e)
{
string strSeriesName = "图例1";
//存放数据
string[] MonNum = new string[12] { "1", "2", "3", "4", "5", "6", "7", "8", "9", "10", "11", "12" };
string[] MonCount = new string[12] { "100", "200", "250", "150", "300", "400", "220", "350", "200", "180", "120", "280" };
//为X轴指定特定的字符串以显示数据
string strXdata = string.Empty;
foreach (string strData in MonNum)
{
strXdata += strData + "\t";
}
//为Y轴指定特定的字符串
string strYData = string.Empty;
foreach (string strValue in MonCount)
{
strYData += strValue + "\t";
}
//创建ChartSpace来放置图表
ChartSpace laySpace = new ChartSpaceClass();
//在ChartSpace对象中添加图表
ChChart InsertChart = laySpace.Charts.Add(0);
//指定绘图类型,可以通过ChartChartTypeEnum枚举值取得
InsertChart.Type = ChartChartTypeEnum.chChartTypeArea;//面积图
//指定图表是否需要图例标注
InsertChart.HasLegend = false;
//为图标添加标题
InsertChart.HasTitle = true;
InsertChart.Title.Caption = "流水账";
//为X轴添加图示说明
InsertChart.Axes[0].HasTitle = true;
InsertChart.Axes[0].Title.Caption = "";
//为Y轴添加图示说明
InsertChart.Axes[1].HasTitle = true;
//InsertChart.Axes[1].Scaling.SplitMinimum = 100;
InsertChart.Axes[1].Title.Caption = "数量";
//添加一个Series系列
InsertChart.SeriesCollection.Add(0);
//给定Series系列的名字
InsertChart.SeriesCollection[0].SetData(ChartDimensionsEnum.chDimSeriesNames, (int)ChartSpecialDataSourcesEnum.chDataLiteral, strSeriesName);
//给定分类
InsertChart.SeriesCollection[0].SetData(ChartDimensionsEnum.chDimCategories, (int)ChartSpecialDataSourcesEnum.chDataLiteral, strXdata);
//给定值
InsertChart.SeriesCollection[0].SetData(ChartDimensionsEnum.chDimValues, (int)ChartSpecialDataSourcesEnum.chDataLiteral, strYData);
//输出文件
string strAbsolutePath = Server.MapPath(".")+"\\ShowData.gif";
laySpace.ExportPicture(strAbsolutePath, "GIF", 400, 250);
string strRelativePath = "./ShowData.gif";
//把图片添加在PlaceHolder1中,并在页面上显示
string strImageTag = "<IMG SRC='" + strRelativePath + "'>";
this.PlaceHolder1.Controls.Add(new LiteralControl(strImageTag));
}
}
}
效果:


 1万+
1万+


 被折叠的 条评论
为什么被折叠?
被折叠的 条评论
为什么被折叠?
 到【灌水乐园】发言


