


2.绘图工具gnuplot,是一个命令驱动的交互式画图软件,功能是把数据资料和数学函数转换成容易观察的平面或立体的图形
这个工具是很有用的,在仿真中很有用处,下面介绍在Linux下的使用
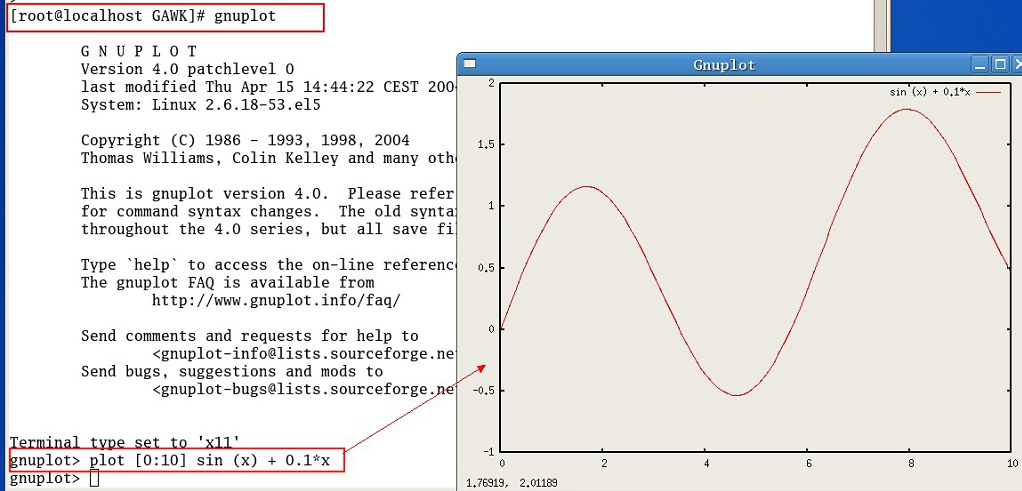
直接输入gnuplot 进入交互式方式 要是想退出输入exit或quit命令即可
命令格式:gnuplot file1 file2
(1) 简单绘图
plot [0:10] sin (x) + 0.1*x //运行截图如下
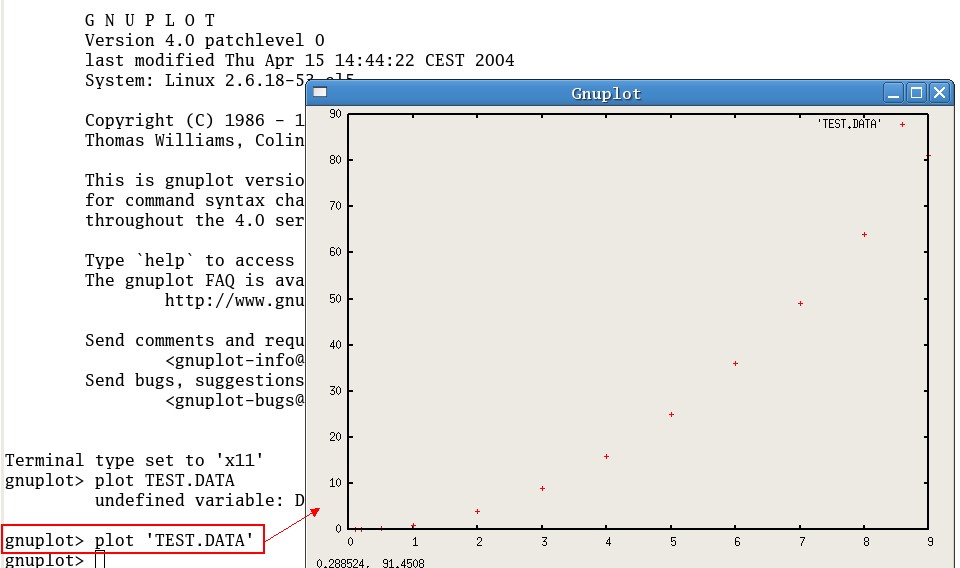
(2)有个文件叫TEST.DATA里面的数据为
#注释
0.1 0.01 -2.303
0.2 0.04 -1.609
0.5 0.25 -0.593
1 1 0
2 4 0.693
3 9 1.099
4 16 1.386
5 25 1.609
6 36 1.792
7 49 1.946
8 64 2.078
9 81 2.197
==================
运行命令: plot 'TEST.DATA' 出现一下截图 运行如下命令 plot 'TEST.DATA' with linespoints便可用先将图中的点连接起来
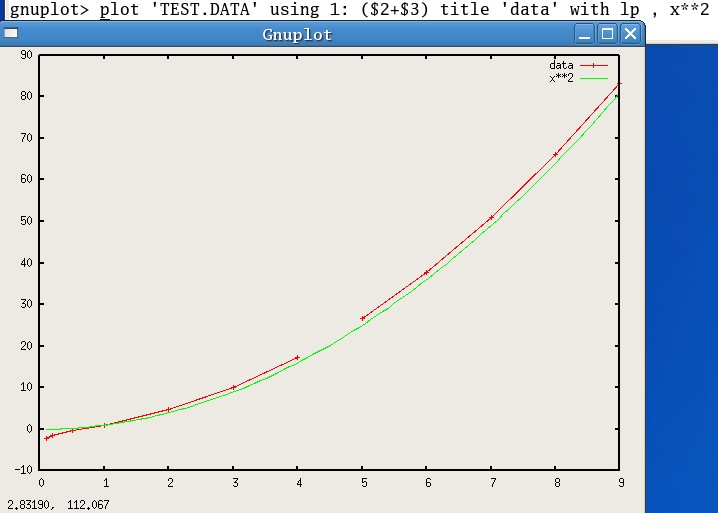
(3)同时绘制函数和数据的命令
plot 'TEST.DATA' using 1: ($2+$3) title 'data' with lp , x**2 运行截图如下 截图中红线有缺少是因为TEST.DATA中有一行空格、
(4) 给出一个三维绘图的例子 有兴趣的可以自己试试
splot [-1:1] [-1:1] (x*x-y*y) / (x*x+y*y) //splot 是plot的扩展是专门来画三维图像的命令 运行截图我就不给了 大家自己做做看吧 研究中还是二维用的比较多
3 NS-2有关的工具还有很多 我就不一一介绍了,例如cbrgen,setdest,threshold,nam,xgraph,Tracegraph等,有兴趣的同学查看徐雷鸣老师的《NS与网络模拟》,挺好的 我也是看着这本书一点一点做的
下面免费分享一个我个人觉的写的不错的ns-2 的文档,下面是csdn的下载页面
http://download.csdn.net/detail/shuoguo77/6323261


 3278
3278

 被折叠的 条评论
为什么被折叠?
被折叠的 条评论
为什么被折叠?
 到【灌水乐园】发言


