


A*算法 Python
A*算法基本思路如下:
1.将起点加入openlist;
2.重复一下过程:
a.遍历openlist,找列表中f值最小节点
b.把这个点移到closelist
c.对该节点周围8个方格进行遍历
if 节点不可抵达 or 在closelist中:
忽略
elif 不在openlist
将其加入openlist,并将当前节点设置为它的父节点
elif 它已在openlist中
检查其f值是否最小
3.当终点加入openlist,此路径已找到。
下面引用别人的程序:
import numpy
from pylab import *
import copy
import matplotlib.pyplot as plt

# 定义一个含有障碍物的20×20的栅格地图
# 10表示可通行点
# 0表示障碍物
# 7表示起点
# 5表示终点
map_grid = numpy.full((20, 20), int(10), dtype=numpy.int8)
map_grid[3, 3:8] = 0
map_grid[3:10, 7] = 0
map_grid[10, 3:8] = 0
map_grid[17, 13:17] = 0
map_grid[10:17, 13] = 0
map_grid[10, 13:17] = 0
map_grid[5, 2] = 7
map_grid[15, 15] = 5


class AStar(object):
    def __init__(self):
        self.g = 0  # g初始化为0
        self.start = numpy.array([5, 2])  # 起点坐标
        self.goal = numpy.array([15, 15])  # 终点坐标
        self.open = numpy.array([[], [], [], [], [], []])  # 先创建一个空的open表, 记录坐标,方向,g值,f值
        self.closed = numpy.array([[], [], [], [], [], []])  # 先创建一个空的closed表
        self.best_path_array = numpy.array([[], []])  # 回溯路径表

    def h_value_tem(self, son_p):
        """
        计算拓展节点和终点的h值
        :param son_p:子搜索节点坐标
        :return:
        """
        h = (son_p[0] - self.goal[0]) ** 2 + (son_p[1] - self.goal[1]) ** 2
        h = numpy.sqrt(h)  # 计算h
        return h

    def g_accumulation(self, son_point, father_point):
        """
        累计的g值
        :return:
        """
        g1 = father_point[0] - son_point[0]
        g2 = father_point[1] - son_point[1]
        g = g1 ** 2 + g2 ** 2
        g = numpy.sqrt(g) + father_point[4]  # 加上累计的g值
        return g

    def f_value_tem(self, son_p, father_p):
        """
        求出的是临时g值和h值加上累计g值得到全局f值
        :param father_p: 父节点坐标
        :param son_p: 子节点坐标
        :return:f
        """
        f = self.g_accumulation(son_p, father_p) + self.h_value_tem(son_p)
        return f

    def child_point(self, x):
        """
        拓展的子节点坐标
        :param x: 父节点坐标
        :return: 子节点存入open表,返回值是每一次拓展出的子节点数目,用于撞墙判断
        当搜索的节点撞墙后,如果不加处理,会陷入死循环
        """
        # 开始遍历周围8个节点
        for j in range(-1, 2, 1):
            for q in range(-1, 2, 1):

                if j == 0 and q == 0:  # 搜索到父节点去掉
                    continue
                m = [x[0] + j, x[1] + q]
                print(m)
                if m[0] < 0 or m[0] > 19 or m[1] < 0 or m[1] > 19:  # 搜索点出了边界去掉
                    continue

                if map_grid[int(m[0]), int(m[1])] == 0:  # 搜索到障碍物去掉
                    continue


                record_g = self.g_accumulation(m, x)
                record_f = self.f_value_tem(m, x)  # 计算每一个节点的f值

                x_direction, y_direction = self.direction(x, m)  # 每产生一个子节点,记录一次方向

                para = [m[0], m[1], x_direction, y_direction, record_g, record_f]  # 将参数汇总一下
                print(para)

                # 在open表中,则去掉搜索点,但是需要更新方向指针和self.g值
                # 而且只需要计算并更新self.g即可,此时建立一个比较g值的函数
                a, index = self.judge_location(m, self.open)
                if a == 1:
                    # 说明open中已经存在这个点

                    if record_f <= self.open[5][index]:
                        self.open[5][index] = record_f
                        self.open[4][index] = record_g
                        self.open[3][index] = y_direction
                        self.open[2][index] = x_direction

                    continue

                # 在closed表中,则去掉搜索点
                b, index2 = self.judge_location(m, self.closed)
                if b == 1:

                    if record_f <= self.closed[5][index2]:
                        self.closed[5][index2] = record_f
                        self.closed[4][index2] = record_g
                        self.closed[3][index2] = y_direction
                        self.closed[2][index2] = x_direction
                        self.closed = numpy.delete(self.closed, index2, axis=1)
                        self.open = numpy.c_[self.open, para]
                    continue

                self.open = numpy.c_[self.open, para]  # 参数添加到open中
                print(self.open)

    def judge_location(self, m, list_co):
        """
        判断拓展点是否在open表或者closed表中
        :return:返回判断是否存在,和如果存在,那么存在的位置索引
        """
        jud = 0
        index = 0
        for i in range(list_co.shape[1]):

            if m[0] == list_co[0, i] and m[1] == list_co[1, i]:

                jud = jud + 1

                index = i
                break
            else:
                jud = jud
        # if a != 0:
        #     continue
        return jud, index

    def direction(self, father_point, son_point):
        """
        建立每一个节点的方向,便于在closed表中选出最佳路径
        非常重要的一步,不然画出的图像参考1.1版本
        x记录子节点和父节点的x轴变化
        y记录子节点和父节点的y轴变化
        如(0,1)表示子节点在父节点的方向上变化0和1
        :return:
        """
        x = son_point[0] - father_point[0]
        y = son_point[1] - father_point[1]
        return x, y

    def path_backtrace(self):
        """
        回溯closed表中的最短路径
        :return:
        """
        best_path = [15, 15]  # 回溯路径的初始化
        self.best_path_array = numpy.array([[15], [15]])
        j = 0
        while j <= self.closed.shape[1]:
            for i in range(self.closed.shape[1]):
                if best_path[0] == self.closed[0][i] and best_path[1] == self.closed[1][i]:
                    x = self.closed[0][i]-self.closed[2][i]
                    y = self.closed[1][i]-self.closed[3][i]
                    best_path = [x, y]
                    self.best_path_array = numpy.c_[self.best_path_array, best_path]
                    break  # 如果已经找到,退出本轮循环,减少耗时
                else:
                    continue
            j = j+1
        # return best_path_array

    def main(self):
        """
        main函数
        :return:
        """
        best = self.start  # 起点放入当前点,作为父节点
        h0 = self.h_value_tem(best)
        init_open = [best[0], best[1], 0, 0, 0, h0]  # 将方向初始化为(0,0),g_init=0,f值初始化h0
        self.open = numpy.column_stack((self.open, init_open))  # 起点放入open,open初始化

        ite = 1  # 设置迭代次数小于200,防止程序出错无限循环
        while ite <= 1000:

                # open列表为空,退出
                if self.open.shape[1] == 0:
                    print('没有搜索到路径!')
                    return

                self.open = self.open.T[numpy.lexsort(self.open)].T  # open表中最后一行排序(联合排序)

                # 选取open表中最小f值的节点作为best,放入closed表

                best = self.open[:, 0]
                print('检验第%s次当前点坐标*******************' % ite)
                print(best)
                self.closed = numpy.c_[self.closed, best]

                if best[0] == 15 and best[1] == 15:  # 如果best是目标点,退出
                    print('搜索成功!')
                    return

                self.child_point(best)  # 生成子节点并判断数目
                print(self.open)
                self.open = numpy.delete(self.open, 0, axis=1)  # 删除open中最优点

                # print(self.open)

                ite = ite+1


class MAP(object):
    """
    画出地图
    """
    def draw_init_map(self):
        """
        画出起点终点图
        :return:
        """
        plt.imshow(map_grid, cmap=plt.cm.hot, interpolation='nearest', vmin=0, vmax=10)
        # plt.colorbar()
        xlim(-1, 20)  # 设置x轴范围
        ylim(-1, 20)  # 设置y轴范围
        my_x_ticks = numpy.arange(0, 20, 1)
        my_y_ticks = numpy.arange(0, 20, 1)
        plt.xticks(my_x_ticks)
        plt.yticks(my_y_ticks)
        plt.grid(True)
        # plt.show()

    def draw_path_open(self, a):
        """
        画出open表中的坐标点图
        :return:
        """
        map_open = copy.deepcopy(map_grid)
        for i in range(a.closed.shape[1]):
            x = a.closed[:, i]

            map_open[int(x[0]), int(x[1])] = 1

        plt.imshow(map_open, cmap=plt.cm.hot, interpolation='nearest', vmin=0, vmax=10)
        # plt.colorbar()
        xlim(-1, 20)  # 设置x轴范围
        ylim(-1, 20)  # 设置y轴范围
        my_x_ticks = numpy.arange(0, 20, 1)
        my_y_ticks = numpy.arange(0, 20, 1)
        plt.xticks(my_x_ticks)
        plt.yticks(my_y_ticks)
        plt.grid(True)
        # plt.show()

    def draw_path_closed(self, a):
        """
        画出closed表中的坐标点图
        :return:
        """
        print('打印closed长度:')
        print(a.closed.shape[1])
        map_closed = copy.deepcopy(map_grid)
        for i in range(a.closed.shape[1]):
            x = a.closed[:, i]

            map_closed[int(x[0]), int(x[1])] = 5

        plt.imshow(map_closed, cmap=plt.cm.hot, interpolation='nearest', vmin=0, vmax=10)
        # plt.colorbar()
        xlim(-1, 20)  # 设置x轴范围
        ylim(-1, 20)  # 设置y轴范围
        my_x_ticks = numpy.arange(0, 20, 1)
        my_y_ticks = numpy.arange(0, 20, 1)
        plt.xticks(my_x_ticks)
        plt.yticks(my_y_ticks)
        plt.grid(True)
        # plt.show()

    def draw_direction_point(self, a):
        """
        从终点开始,根据记录的方向信息,画出搜索的路径图
        :return:
        """
        print('打印direction长度:')
        print(a.best_path_array.shape[1])
        map_direction = copy.deepcopy(map_grid)
        for i in range(a.best_path_array.shape[1]):
            x = a.best_path_array[:, i]

            map_direction[int(x[0]), int(x[1])] = 6

        plt.imshow(map_direction, cmap=plt.cm.hot, interpolation='nearest', vmin=0, vmax=10)
        # plt.colorbar()
        xlim(-1, 20)  # 设置x轴范围
        ylim(-1, 20)  # 设置y轴范围
        my_x_ticks = numpy.arange(0, 20, 1)
        my_y_ticks = numpy.arange(0, 20, 1)
        plt.xticks(my_x_ticks)
        plt.yticks(my_y_ticks)
        plt.grid(True)

    def draw_three_axes(self, a):
        """
        将三张图画在一个figure中
        :return:
        """
        plt.figure()
        ax1 = plt.subplot(221)

        ax2 = plt.subplot(222)
        ax3 = plt.subplot(223)
        ax4 = plt.subplot(224)
        plt.sca(ax1)
        self.draw_init_map()
        plt.sca(ax2)
        self.draw_path_open(a)
        plt.sca(ax3)
        self.draw_path_closed(a)
        plt.sca(ax4)
        self.draw_direction_point(a)

        plt.show()


if __name__ == '__main__':

    a1 = AStar()
    a1.main()
    a1.path_backtrace()
    m1 = MAP()
    m1.draw_three_axes(a1)
对程序进行解释,同时自己也加深对程序的理解:
import numpy
from pylab import *
import copy
import matplotlib.pyplot as plt
numpy:主要是矩阵处理模块(opencv中用的比较图);matplotlib:类似matlab,主要是画图用。
map_grid = numpy.full((20, 20), int(10), dtype=numpy.int8)
map_grid[3, 3:8] = 0
map_grid[3:10, 7] = 0
map_grid[10, 3:8] = 0
map_grid[17, 13:17] = 0
map_grid[10:17, 13] = 0
map_grid[10, 13:17] = 0
map_grid[5, 2] = 7
map_grid[15, 15] = 5
创建地图矩阵
def __init__(self):
        self.g = 0  # g初始化为0
        self.start = numpy.array([5, 2])  # 起点坐标
        self.goal = numpy.array([15, 15])  # 终点坐标
        self.open = numpy.array([[], [], [], [], [], []])  # 先创建一个空的open表, 记录坐标,方向,g值,f值
        self.closed = numpy.array([[], [], [], [], [], []])  # 先创建一个空的closed表
        self.best_path_array = numpy.array([[], []])  # 回溯路径表
初始化类的属性,注意:open和closed表中,每个节点有6个参数描述,6个参数纵向排列,节点数量等于其列数。
def h_value_tem(self, son_p):
        """
        计算拓展节点和终点的h值
        :param son_p:子搜索节点坐标
        :return:
        """
        h = (son_p[0] - self.goal[0]) ** 2 + (son_p[1] - self.goal[1]) ** 2
        h = numpy.sqrt(h)  # 计算h
        return h
计算节点到终点的h值(评价函数值)
def g_accumulation(self, son_point, father_point):
        g1 = father_point[0] - son_point[0]
        g2 = father_point[1] - son_point[1]
        g = g1 ** 2 + g2 ** 2
        g = numpy.sqrt(g) + father_point[4]  # 加上累计的g值
        return g
计算节点的g值(代价函数值)(sqrt(x2+y2))
def f_value_tem(self, son_p, father_p):
        """
        求出的是临时g值和h值加上累计g值得到全局f值
        :param father_p: 父节点坐标
        :param son_p: 子节点坐标
        :return:f
        """
        f = self.g_accumulation(son_p, father_p) + self.h_value_tem(son_p)
        return f
计算节点f值
def child_point(self, x):
        """
        拓展的子节点坐标
        :param x: 父节点坐标
        :return: 子节点存入open表,返回值是每一次拓展出的子节点数目,用于撞墙判断
        当搜索的节点撞墙后,如果不加处理,会陷入死循环
        """
        # 开始遍历周围8个节点
        for j in range(-1, 2, 1):
            for q in range(-1, 2, 1):
                if j == 0 and q == 0:  # 搜索到父节点去掉
                    continue
                m = [x[0] + j, x[1] + q]
                print(m)
                if m[0] < 0 or m[0] > 19 or m[1] < 0 or m[1] > 19:  # 搜索点出了边界去掉
                    continue
                if map_grid[int(m[0]), int(m[1])] == 0:  # 搜索到障碍物去掉
                    continue
遍历该节点周围的8个点,去点边界外及障碍物内的点。
 record_g = self.g_accumulation(m, x)
                record_f = self.f_value_tem(m, x)  # 计算每一个节点的f值
                x_direction, y_direction = self.direction(x, m)  # 每产生一个子节点,记录一次方向
                para = [m[0], m[1], x_direction, y_direction, record_g, record_f]  # 将参数汇总一下
                print(para)
记录剩余每个符合要求点的参数
a, index = self.judge_location(m, self.open)
                if a == 1:
                    # 说明open中已经存在这个点
                    if record_f <= self.open[5][index]:
                        self.open[5][index] = record_f
                        self.open[4][index] = record_g
                        self.open[3][index] = y_direction
                        self.open[2][index] = x_direction
                    continue
                # 在closed表中,则去掉搜索点
                b, index2 = self.judge_location(m, self.closed)
                if b == 1:
                    if record_f <= self.closed[5][index2]:
                        self.closed[5][index2] = record_f
                        self.closed[4][index2] = record_g
                        self.closed[3][index2] = y_direction
                        self.closed[2][index2] = x_direction
                        self.closed = numpy.delete(self.closed, index2, axis=1)
                        self.open = numpy.c_[self.open, para]
                    continue
                self.open = numpy.c_[self.open, para]  # 参数添加到open中
                print(self.open)
检查节点是否已经在open列表中,如果不在,跳过。如果已经在列表中,且f值小于该节点之前已经在open列表中的f值,则用现有f值更小的节点参数替换掉(不用替换坐标x,y,因为坐标值一样)。
检查节点是否已经在closed列表中,如果不在,跳过。如果已经在列表中,且f值小于该节点之前已经在open列表中的f值,将其从列表中移除。
def judge_location(self, m, list_co):
        """
        判断拓展点是否在open表或者closed表中
        :return:返回判断是否存在,和如果存在,那么存在的位置索引
        """
        jud = 0
        index = 0
        for i in range(list_co.shape[1]):

            if m[0] == list_co[0, i] and m[1] == list_co[1, i]:

                jud = jud + 1

                index = i
                break
            else:
                jud = jud
        # if a != 0:
        #     continue
        return jud, index
判断节点是否在open closed列表中,上面引用到该方法
 def direction(self, father_point, son_point):
        """
        建立每一个节点的方向,便于在closed表中选出最佳路径
        非常重要的一步,不然画出的图像参考1.1版本
        x记录子节点和父节点的x轴变化
        y记录子节点和父节点的y轴变化
        如(0,1)表示子节点在父节点的方向上变化0和1
        :return:
        """
        x = son_point[0] - father_point[0]
        y = son_point[1] - father_point[1]
        return x, y
def path_backtrace(self):
        """
        回溯closed表中的最短路径
        :return:
        """
        best_path = [15, 15]  # 回溯路径的初始化
        self.best_path_array = numpy.array([[15], [15]])
        j = 0
        while j <= self.closed.shape[1]:
            for i in range(self.closed.shape[1]):
                if best_path[0] == self.closed[0][i] and best_path[1] == self.closed[1][i]:
                    x = self.closed[0][i]-self.closed[2][i]
                    y = self.closed[1][i]-self.closed[3][i]
                    best_path = [x, y]
                    self.best_path_array = numpy.c_[self.best_path_array, best_path]
                    break  # 如果已经找到,退出本轮循环,减少耗时
                else:
                    continue
            j = j+1
        # return best_path_array
对closed列表所有节点遍历,如果best_path在close表里面,则将它的父节点加入到best_path_array中。
x = self.closed[0][i]-self.closed[2][i]
y = self.closed[1][i]-self.closed[3][i]
表示父节点的坐标值
def main(self):
        """
        main函数
        :return:
        """
        best = self.start  # 起点放入当前点,作为父节点
        h0 = self.h_value_tem(best)
        init_open = [best[0], best[1], 0, 0, 0, h0]  # 将方向初始化为(0,0),g_init=0,f值初始化h0
        self.open = numpy.column_stack((self.open, init_open))  # 起点放入open,open初始化

        ite = 1  # 设置迭代次数小于200,防止程序出错无限循环
        while ite <= 1000:

                # open列表为空,退出
                if self.open.shape[1] == 0:
                    print('没有搜索到路径!')
                    return

                self.open = self.open.T[numpy.lexsort(self.open)].T  # open表中最后一行排序(联合排序)

                # 选取open表中最小f值的节点作为best,放入closed表

                best = self.open[:, 0]
                print('检验第%s次当前点坐标*******************' % ite)
                print(best)
                self.closed = numpy.c_[self.closed, best]

                if best[0] == 15 and best[1] == 15:  # 如果best是目标点,退出
                    print('搜索成功!')
                    return

                self.child_point(best)  # 生成子节点并判断数目
                print(self.open)
                self.open = numpy.delete(self.open, 0, axis=1)  # 删除open中最优点

                # print(self.open)

                ite = ite+1
对open列表节点按f值排序,取f值最小的节点名为best,将best加入closed列表,如果best是终点,则搜索成功,如果不是终点,遍历该点周围八个节点,更新open列表,再次循环,直到best加入closed列表,循环结束。
class MAP(object):
    """
    画出地图
    """
    def draw_init_map(self):
        """
        画出起点终点图
        :return:
        """
        plt.imshow(map_grid, cmap=plt.cm.hot, interpolation='nearest', vmin=0, vmax=10)
        # plt.colorbar()
        xlim(-1, 20)  # 设置x轴范围
        ylim(-1, 20)  # 设置y轴范围
        my_x_ticks = numpy.arange(0, 20, 1)
        my_y_ticks = numpy.arange(0, 20, 1)
        plt.xticks(my_x_ticks)
        plt.yticks(my_y_ticks)
        plt.grid(True)
        # plt.show()

    def draw_path_open(self, a):
        """
        画出open表中的坐标点图
        :return:
        """
        map_open = copy.deepcopy(map_grid)
        for i in range(a.closed.shape[1]):
            x = a.closed[:, i]

            map_open[int(x[0]), int(x[1])] = 1

        plt.imshow(map_open, cmap=plt.cm.hot, interpolation='nearest', vmin=0, vmax=10)
        # plt.colorbar()
        xlim(-1, 20)  # 设置x轴范围
        ylim(-1, 20)  # 设置y轴范围
        my_x_ticks = numpy.arange(0, 20, 1)
        my_y_ticks = numpy.arange(0, 20, 1)
        plt.xticks(my_x_ticks)
        plt.yticks(my_y_ticks)
        plt.grid(True)
        # plt.show()

    def draw_path_closed(self, a):
        """
        画出closed表中的坐标点图
        :return:
        """
        print('打印closed长度:')
        print(a.closed.shape[1])
        map_closed = copy.deepcopy(map_grid)
        for i in range(a.closed.shape[1]):
            x = a.closed[:, i]

            map_closed[int(x[0]), int(x[1])] = 5

        plt.imshow(map_closed, cmap=plt.cm.hot, interpolation='nearest', vmin=0, vmax=10)
        # plt.colorbar()
        xlim(-1, 20)  # 设置x轴范围
        ylim(-1, 20)  # 设置y轴范围
        my_x_ticks = numpy.arange(0, 20, 1)
        my_y_ticks = numpy.arange(0, 20, 1)
        plt.xticks(my_x_ticks)
        plt.yticks(my_y_ticks)
        plt.grid(True)
        # plt.show()

    def draw_direction_point(self, a):
        """
        从终点开始,根据记录的方向信息,画出搜索的路径图
        :return:
        """
        print('打印direction长度:')
        print(a.best_path_array.shape[1])
        map_direction = copy.deepcopy(map_grid)
        for i in range(a.best_path_array.shape[1]):
            x = a.best_path_array[:, i]

            map_direction[int(x[0]), int(x[1])] = 6

        plt.imshow(map_direction, cmap=plt.cm.hot, interpolation='nearest', vmin=0, vmax=10)
        # plt.colorbar()
        xlim(-1, 20)  # 设置x轴范围
        ylim(-1, 20)  # 设置y轴范围
        my_x_ticks = numpy.arange(0, 20, 1)
        my_y_ticks = numpy.arange(0, 20, 1)
        plt.xticks(my_x_ticks)
        plt.yticks(my_y_ticks)
        plt.grid(True)

    def draw_three_axes(self, a):
        """
        将三张图画在一个figure中
        :return:
        """
        plt.figure()
        ax1 = plt.subplot(221)

        ax2 = plt.subplot(222)
        ax3 = plt.subplot(223)
        ax4 = plt.subplot(224)
        plt.sca(ax1)
        self.draw_init_map()
        plt.sca(ax2)
        self.draw_path_open(a)
        plt.sca(ax3)
        self.draw_path_closed(a)
        plt.sca(ax4)
        self.draw_direction_point(a)

        plt.show()
基本都是matplotlib模块里面的API
if __name__ == '__main__':

    a1 = AStar()
    a1.main()
    a1.path_backtrace()
    m1 = MAP()
    m1.draw_three_axes(a1)
顶层运行程序
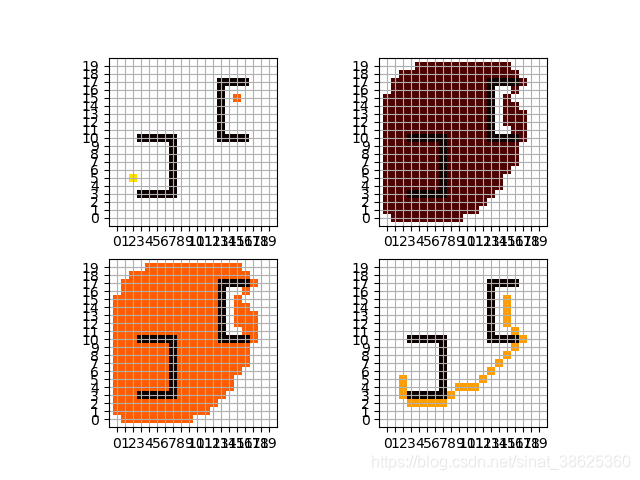
运行结果如下图:


 669
669


 被折叠的 条评论
为什么被折叠?
被折叠的 条评论
为什么被折叠?
 到【灌水乐园】发言


