


a linux trace/probe tool.
官网:https://sourceware.org/systemtap/
简介
SystemTap是我目前所知的最强大的内核调试工具,有些家伙甚至说它无所不能:)
(1) 发展历程
Debuted in 2005 in Red Hat Enterprise Linux 4 Update 2 as a technology preview.
After four years in development, System 1.0 was released in 2009.
As of 2011 SystemTap runs fully supported in all Linux distributions.
(2) 官方介绍
SystemTap provides free software(GPL) infrastructure to simplify the gathering of information about the
running Linux system. This assists diagnosis of a performance or functional problem. SystemTap eliminates
the need for the developer to go through the tedious and disruptive instrument, recompile, install, and reboot
sequence that may be otherwise required to collect data.
SystemTap provides a simple command line interface and scripting language for writing instrumentation for
a live running kernel plus user-space application. We are publishing samples, as well as enlarging the internal
"tapset" script library to aid reuse and abstraction.
Among other tracing/probing tools, SystemTap is the tool of choice for complex tasks that may require live analysis,
programmable on-line response, and whole-system symbolic access. SystemTap can also handle simple tracing
jobs.
Current project members include Red Hat, IBM, Hitachi, and Oracle.
(3) 获取源码
git clone git://sourceware.org/git/systemtap.git
安装
(1) Ubuntu发行版
1. 安装systemtap包
apt-get install systemtap
2. 安装依赖包
gcc:C语言编译器
elfutils:提供分析调试信息的库函数
linux-headers-generic:编译内核模块所需的内核头文件以及模块配置信息
3. 安装内核调试信息(kernel-debuginfo)
kernel-debuginfo提供了调试内核所需的符号表,如果没有安装的话SystemTap的威力就会大打折扣,
只能提供kprobes系列的功能。
下载地址:http://ddebs.ubuntu.com/pool/main/l/linux/
下载对应的内核版本,我的是linux-image-3.11.0-12-generic-dbgsym_3.11.0-12.19_amd64.ddeb
下载后安装:dpkg -i linux-image-3.11.0-12-generic-dbgsym_3.11.0-12.19_amd64.ddeb
4. 验证
stap -ve 'probe kernel.function("do_fork") { print("hello world\n") exit() }'
如果没有提示错误,就是安装成功了。
(2) CentOS/RedHat发行版
使用yum安装下列rpm包即可:
systemtap:SystemTap包
gcc:C语言编译器
elfutils:提供库函数来分析调试信息
kernel-devel:编译内核模块所需的内核头文件及模块配置信息
kernel-debuginfo:提供所需的内核调试信息来定位内核函数和变量的位置
使用
一些例子SystemTap的简单例子。
(1) stap
通常直接使用stap执行用SystemTap语法编写的脚本即可。
stap - systemtap script translator/driver
stap test.stp // .stp后缀的文件是用SystemTap语法编写的脚本
脚本主要元素:probe point + probe handler
stap [options] FILE // Run script in file
stap [options] -e SCRIPT // Run given script.
stap [options] -l PROBE // List matching probes.
stap [options] -L PROBE // List matching probes and local variables.
常用选项
-h:帮助
-g:guru模式,嵌入式C代码需要
-m:指定编译成的模块名称
-v:add verbosity to all passes
-k:不删除临时目录
-p NUM:stop after pass NUM 1-5, instead of 5 (parse, elaborate, translate, compile, run)
-b:bulk (percpu file) mode, 使用RelayFS将数据从内核空间传输到用户空间
-o FILE:输出到指定文件,而不是stdout
-c CMD:start the probes, run CMD, and exit when it finishes
stap是SystemTap的前端,当出现以下情况时退出:
1. The user interrupts the script with a CTRL-C.
2. The script executes the exit() function.
3. The script encounters a sufficient number of soft errors.
4. The monitored command started with the stap program's -c option exits.
(2) staprun
如果我们的输入不是.stp脚本,而是一个用stap生成的模块,那么就用staprun来执行。
staprun - systemtap runtime
staprun [OPTIONS] MODULE [MODULE-OPTIONS]
staprun的作用:
The staprun program is the back-end of the Systemtap tool. It expects a kernel module produced by
the front-end stap tool.
Splitting the systemtap tool into a front-end and a back-end allows a user to compile a systemtap script
on a development machine that has the kernel debugging information (need to compile the script) and
then transfer the resulting kernel module to a production machine that doesn't have any development
tools or kernel debugging information installed.
staprun is a part of the SystemTap package, dedicated to module loading and unloading and kernel-to-user
data transfer.
常用选项
-o FILE:Send output to FILE.
-D:Run in background. This requires '-o' option.
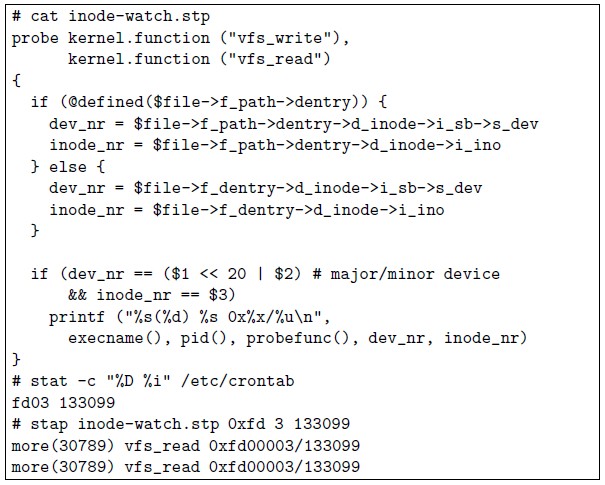
(3) 监测内核函数
一个简单脚本,每当内核函数do_fork()被调用时,显示调用它的进程名、进程ID、函数参数。
- global proc_counter
- probe begin {
- print("Started monitoring creation of new processes...Press ^C to terminate\n")
- printf("%-25s %-10s %-s\n", "Process Name", "Process ID", "Clone Flags")
- }
- probe kernel.function("do_fork") {
- proc_counter++
- printf("%-25s %-10d 0x%-x\n", execname(), pid(), $clone_flags)
- }
- probe end {
- printf("\n%d processes forked during the observed period\n", proc_counter)
- }
global proc_counter

probe begin {
	print("Started monitoring creation of new processes...Press ^C to terminate\n")
	printf("%-25s %-10s %-s\n", "Process Name", "Process ID", "Clone Flags")
}

probe kernel.function("do_fork") {
	proc_counter++
	printf("%-25s %-10d 0x%-x\n", execname(), pid(), $clone_flags)
}

probe end {
	printf("\n%d processes forked during the observed period\n", proc_counter)
}
(4) 监测系统调用
一个简单脚本,显示4秒内open系统调用的信息:调用进程名、进程ID、函数参数。
- probe syscall.open
- {
- printf("%s(%d) open(%s)\n", execname(), pid(), argstr)
- }
- probe timer.ms(4000) # after 4 seconds
- {
- exit()
- }
probe syscall.open
{
	printf("%s(%d) open(%s)\n", execname(), pid(), argstr)
}

probe timer.ms(4000) # after 4 seconds
{
	exit()
}
(5) 监测源文件中所有函数入口和出口
括号内的探测点描述包含三个部分:
function name part:函数名
@file name part:文件名
function line part:所在行号
例如:
- probe kernel.function("*@net/socket.c") {}
- probe kernel.function("*@net/socket.c").return {}
probe kernel.function("*@net/socket.c") {}
probe kernel.function("*@net/socket.c").return {}
这里指定函数名为任意(用*表示),指定文件名为net/socket.c,探测函数的入口和返回。
还可以用“:行号”来指定行号。
(6) 查找匹配的内核函数和变量
查找名字中包含nit的内核函数:
stap -l 'kernel.function("*nit*")'
查找名字中包含nit的内核函数和变量:
stap -L 'kernel.function("*nit*")'
(7) 自带的用例集
/root/systemtap/testsuite/systemtap.examples/,包含了许多用例脚本。
主要有几个方面:
network、io、interrupt、locks、memory、process、virtualization等
(8) 监控所有进程的收发包情况
- global recv, xmit
- probe begin {
- printf("Starting network capture...Press ^C to terminate\n")
- }
- probe netdev.receive {
- recv[dev_name, pid(), execname()] <<< length
- }
- probe netdev.transmit {
- xmit[dev_name, pid(), execname()] <<< length
- }
- probe end {
- printf("\nCapture terminated\n\n")
- printf("%-5s %-15s %-10s %-10s %-10s\n",
- "If", "Process", "Pid", "RcvPktCnt", "XmtPktCnt")
- foreach([dev, pid, name] in recv) {
- recvcnt = @count(recv[dev, pid, name])
- xmtcnt = @count(xmit[dev, pid, name])
- printf("%-5s %-15s %-10d %-10d %-10d\n", dev, name, pid, recvcnt, xmtcnt)
- }
- }
global recv, xmit

probe begin {
	printf("Starting network capture...Press ^C to terminate\n")
}

probe netdev.receive {
	recv[dev_name, pid(), execname()] <<< length
}

probe netdev.transmit {
	xmit[dev_name, pid(), execname()] <<< length
}

probe end {
	printf("\nCapture terminated\n\n")
	printf("%-5s %-15s %-10s %-10s %-10s\n",
		"If", "Process", "Pid", "RcvPktCnt", "XmtPktCnt")

	foreach([dev, pid, name] in recv) {
		recvcnt = @count(recv[dev, pid, name])
		xmtcnt =  @count(xmit[dev, pid, name])
		printf("%-5s %-15s %-10d %-10d %-10d\n", dev, name, pid, recvcnt, xmtcnt)
	}
}
(9) Systemtap usage stories and interesting demos
https://sourceware.org/systemtap/wiki/WarStories
官网提供的很多例子。
探测点
SystemTap脚本主要是由探测点和探测点处理函数组成的,来看下都有哪些探测点可用。
The essential idea behind a systemtap script is to name events, and to give them handlers.
Systemtap works by translating the script to C, running the system C compiler to create a kernel module from that.
When the module is loaded, it activates all the probed events by hooking into the kernel.
(1) where to probe
Built-in events (probe point syntax and semantics)
begin:The startup of the systemtap session.
end:The end of the systemtap session.
kernel.function("sys_open"):The entry to the function named sys_open in the kernel.
syscall.close.return:The return from the close system call.
module("ext3").statement(0xdeadbeef):The addressed instruction in the ext3 filesystem driver.
timer.ms(200):A timer that fires every 200 milliseconds.
timer.jiffies(200):A timer that fires every 200 jiffies.
timer.profile:A timer that fires periodically on every CPU.
perf.hw.cache_misses:A particular number of CPU cache misses have occurred.
procfs("status").read:A process trying to read a synthetic file.
process("a.out").statement("*@main.c:200"):Line 200 of the a.out program.
更多信息,可见stapprobes mannual page:
https://sourceware.org/systemtap/man/stapprobes.3stap.html
http://linux.die.net/man/5/stapprobes
(2) what to print
Systemtap provides a variety of such contextual data, ready for formatting.
The usually appear as function calls within the handler.
tid():The id of the current thread.
pid():The process (task group) id of the current thread.
uid():The id of the current user.
execname():The name of the current process.
cpu():The current cpu number.
gettimeofday_s():Number of seconds since epoch.
get_cycles():Snapshot of hardware cycle counter.
pp():A string describing the probe point being currently handled.
probefunc():If known, the name of the function in which this probe was placed.
$$vars:If available, a pretty-printed listing of all local variables in scope.
print_backtrace():If possible, print a kernel backtrace.
print_ubacktrace():If possible, print a user-space backtrace.
$$parms:表示函数参数
$$return:表示函数返回值
thread_indent():tapset libary中一个很有用的函数,它的输出格式:
A timestamp (number of microseconds since the initial indentation for the thread)
A process name and the thread id itself.
更多信息,可见stapfuncs mannual page:
https://sourceware.org/systemtap/man/stapfuncs.3stap.html
http://linux.die.net/man/5/stapfuncs
(3) Built-in probe point types (DWARF probes)
内置的探测点,安装debuginfo后可使用。
This family of probe points uses symbolic debugging information for the target kernel or module,
as may be found in executables that have not been stripped, or in the separate debuginfo packages.
目前支持的内置探测点类型:
kernel.function(PATTERN) // 在函数的入口处放置探测点,可以获取函数参数$PARM
kernel.function(PATTERN).return // 在函数的返回处放置探测点,可以获取函数的返回值$return,以及可能被修改的函数参数$PARM
kernel.function(PATTERN).call // 取补集,取不符合条件的函数
kernel.function(PATTERN).inline // 只选择符合条件的内联函数,内联函数不能使用.return
kernel.function(PATTERN).exported // 只选择导出的函数
module(MPATTERN).function(PATTERN)
module(MPATTERN).function(PATTERN).return
module(MPATTERN).function(PATTERN).call
module(MPATTERN).function(PATTERN).inline
kernel.statement(PATTERN)
kernel.statement(ADDRESS).absolute
module(MPATTERN).statement(PATTERN)
示例:
# Refers to all kernel functions with "init" or "exit" in the name
kernel.function("*init*"), kernel.function("*exit*")
# Refers to any functions within the "kernel/time.c" file that span line 240
kernel.function("*@kernel/time.c:240")
# Refers to all functions in the ext3 module
module("ext3").function("*")
# Refers to the statement at line 296 within the kernel/time.c file
kernel.statement("*@kernel/time.c:296")
# Refers to the statement at line bio_init+3 within the fs/bio.c file
kernel.statement("bio_init@fs/bio.c+3")
部分在编译单元内可见的源码变量,比如函数参数、局部变量或全局变量,在探测点处理函数中同样是可见的。
在脚本中使用$加上变量的名字就可以饮用了。
变量的引用有两种风格:
$varname // 引用变量varname
$var->field // 引用结构的成员变量
$var[N] // 引用数组的元素
&$var // 变量的地址
@var("varname") // 引用变量varname
@var("var@src/file.c") // 引用src/file.c在被编译时的全局变量varname
@var("varname@file.c")->field // 引用结构的成员变量
@var("var@file.c")[N] // 引用数组的元素
&@var("var@file.c") // 变量的地址
$var$ // provide a string that includes the values of basic type values
$var$$ // provide a string that includes all values of nested data types
$$vars // 一个包含所有函数参数、局部变量的字符串
$$locals // 一个包含所有局部变量的字符串
$$params // 一个包含所有函数参数的字符串
(4) DWARF-less probing
当没有安装debuginfo时,不能使用内置的探测点。
In the absence of debugging information, you can still use the kprobe family of probes to examine the
entry and exit points of kernel and module functions. You cannot lookup the arguments or local variables
of a function using these probes.
当目标内核或模块缺少调试信息时,虽然不能使用内置的探测点,但仍然可以使用kprobe来探测函数的入口点
和退出点。此时不能使用“$+变量名”来获取函数参数或局部变量的值。
SystemTap仍然提供了一种访问参数的方法:
当函数因被探测而停滞在它的进入点时,可以使用编号来引用它的参数。
例如,假设被探测的函数声明如下:
ssize_t sys_read(unsigned int fd, char __user *buf, size_t count)
可以分别使用unit_arg(1)、pointer_arg(2)、ulong_arg(3)来获取fd、buf和count的值。
此种探测点虽然不支持$return,但可以通过调用returnval()来获取寄存器的值,函数的返回值通常是保存在
这一寄存器里的,也可以调用returnstr()来获取返回值的字符串形式。
在处理函数代码里面,可以调用register("regname")来获取它被调用时特定CPU寄存器的值。
使用格式(不能用通配符):
kprobe.function(FUNCTION)
kprobe.function(FUNCTION).return
kprobe.module(NAME).function(FUNCTION)
kprobe.module(NAME).function(FUNCTION).return
kprobe.statement(ADDRESS).absolute
语法
(1) 基本格式
probe probe-point probe- handler,即probe Probe-Point { statement }
用probe指定一个探测点(probe-point),以及在这个探测点处执行的处理函数(probe-handler)。
每条语句不用结束符,分号“;”表示空语句。函数用{}括起来。
允许多种注释语句:
Shell-stype:#
C-style:/* */
C++-style://
next语句用于提前退出Probe-handler。
String连接符是“.”,比较符为“==”。
例如:"hello" . "world" ,连接成"helloword"
变量属于弱数据类型,不用事先声明,不用指定数据类型。
字符串类型和数字类型的转换:
s = sprint(123) # s becomes the string "123"
probe-handler中定义的变量是局部的,不能在其它探测点处理函数中使用。
global符号用于定义全局变量。
Because of possible concurrency (multiple probe handlers running on different CPUs, each global variable
used by a probe is automatically read-locked or write-locked while the handler is running.
next语句:执行到next语句时,会马上从探测点处理函数中返回。
(2) 函数
function name(param1, param2)
{
statements
return ret
}
Recursion is possible, up to a nesting depth limit.
(3) 条件语句
if (EXPR) STATEMENT [else STATEMENT]
(4) 循环语句
while (EXPR) STATEMENT
for (A; B; C) STATEMENT
break可以提前退出循环,continue可以跳过本次循环。
(5) 上下文变量
Allow access to the probe point context. To know which variables are likely to be available, you will need to
be familiar with the kernel source you are probing.
You can use stap -L PROBEPOINT to enumerate the variables available there.
使用stap -L probe-point,来查看执行到这个探测点时,哪些上下文变量是可用的。
Two functions, user_string and kernel_string, can copy char *target variables into systemtap strings.
实例:
(6) 关联数组
These arrays are implemented as hash tables with a maximum size that is fixed at startup.
Because they are too large to be created dynamically for individual probes handler runs, they must be
declared as global.
关联数组是用哈希表实现的,最大大小在一开始就设定了。
关联数组必须是全局的,不能在探测点处理函数内部定义。
数组的索引最多可以有9个,用逗号隔开,可以是数字或字符串。
例如:global array[400]
6.1 数组
可以用多个索引来定位数组元素。
元素的数据类型有三种:数值、字符串、统计类型。
如果不指定数组的大小,那么默认设为最大值MAXMAPENTRIES(2048)。
例如:
foo[4, "hello"]++
processusage[uid(), execname()]++
6.2 元素是否存在
例如:if ([4, "hello"] in foo) { }
6.3 元素删除
例如:delete
delete times[tid()] # deletion of a single element
delete times # deletion of all elements
6.4 删除变量
例如:delete var
如果var是一个数值型变量,那么它被重置为0;如果var是一个字符串型变量,那么它被重置为"",
如果var是一个统计类型变量,那么它所在的集合被清空。
6.4 遍历
使用foreach关键字,允许使用break/continue,在遍历期间不允许修改数组。
foreach (x = [a, b] in foo) { fuss_with(x) } # simple loop in arbitrary sequence
foreach ([a, b] in foo+ limit 5) {} # loop in increasing sequence of value, stop after 5
foreach ([a-, b] in foo) {} # loop in decreasing sequence of first key
# Print the first 10 tuples and values in the array in decreasing sequence
foreach(v = [i, j] in foo- limit 10)
printf("foo [%d, %s] = %d\n", i, j, v)
三中遍历形式:
foreach (VAR in ARRAY) STMT // 按值遍历,VAR为元素值
foreach ([VAR1, VAR2, ...] in ARRAY) STMT // 按索引遍历
foreach (VAR = [VAR1, VAR2, ...] in ARRAY) STMT // 同时得到元素值和元素索引
6.5 覆盖
%表示当数组容量不够时,允许新的元素覆盖掉旧的元素。
global ARRAY%[<size>], ARRAY2%
(7) 统计类型
statistics aggregates是SystemTap特有的数据类型,用于统计全局变量。
操作符为“<<<”
例如:g_value <<< b # 相当于C语言的g_value += b
这种变量只能用特定函数操作,主要包括:
@count(g_value):所有统计操作的操作次数
@sum(g_value):所有统计操作的操作数的总和
@min(g_value):所有统计操作的操作数的最小值
@max(g_value):所有统计操作的操作数的最大值
@avg(g_value):所有统计操作的操作数的平均值
(8) 语言安全性
8.1 时间限制
探测点处理函数是有执行时间限制的,不能占用太多时间,否则SystemTap在把脚本编译为C语言时会报错。
每个探测点处理函数只能执行1000条语句,这个数量是可配置的。
8.2 动态内存分配
探测点处理函数中不允许动态内存分配。
No dynamic memory allocation whatsoever takes place during the execution of probe handlers.
Arrays, function contexts, and buffers are allocated during initialization.
8.3 锁
多个探测点处理函数抢占一个全局变量锁时,某几个探测点处理函数可能会超时,被放弃执行。
访问全局变量时会加锁,防止它被并发的修改。
If multiple probes seek conflicting locks on the same global variables, one or more of them will time out and be
aborted. Such events are tailed as skipped probes, and a count is displayed at session end.
8.4 bug
内核中少数对时间非常敏感的地方(上下文切换、中断处理),是不能设为探测点的。
Putting probes indiscriminately into unusually sensitive parts of the kernel (low level context switching, interrupt
dispatching) has reportedly caused crashes in the past. We are fixing these bugs as they are found, and
constructing a probe "blacklist", but it is not complete.
8.5 修改限制
通过-D选项可以修改默认的一些限制。
-D NM=VAL emit macro definition into generated C code.
MAXNESTING - The maximum number of recursive function call levels. The default is 10.
MAXSTRINGLEN - The maximum length of strings. The default is 256 bytes for 32 bit machines and
512 bytes for all other machines.
MAXTRYLOCK - The maximum number of iterations to wait for locks on global variables before declaring
possible deadlock and skipping the probe. The default is 1000.
MAXACTION - The maximum number of statements to execute during any single probe hit. The default is 1000.
MAXMAPENTRIES - The maximum number of rows in an array if the array size is not specified explicitly when
declared. The default is 2048.
MAXERRORS - The maximum number of soft errors before an exit is triggered. The default is 0.
MAXSKIPPED - The maximum number of skipped reentrant probes before an exit is triggered. The default is 100.
MINSTACKSPACE - The minimum number of free kernel stack bytes required in order to run a probe handler.
This number should be large enough for the probe handler's own needs, plus a safety margin. The default is 1024.
(9) 命令行参数
可以从命令行传递两种类型的参数:“字符串”和数值。
9.1 数值
$1 ... $<N> 用于在脚本中引用传入的数值参数。
9.2 字符串
@1 ... @<N> 用于在脚本中引用传入的字符串参数。
(10) 条件编译
%( CONDITION %? TRUE-TOKENS %)
%( CONDITION %? TRUE-TOKENS %: FALSE-TOKENS %)
编译条件可以是:
@defined($var) // 目标变量是否可用
kernel_v > "2.6.37" // 比较版本号
kernel_vr // 比较版本号(包括后缀)
arch == "x86_64" // CPU架构
kernel CONFIG option,编译选项:
%( CONFIG_UTRACE == "y" %?
do something
%)
用户空间
SystemTap探测用户空间程序需要utrace的支持,3.5以上的内核版本默认支持。
对于3.5以下的内核版本,需要自己打相关补丁。
更多信息:http://sourceware.org/systemtap/wiki/utrace
需要:
debugging information for the named program
utrace support in the kernel
(1) Begin/end
探测点:
进程/线程创建时
进程/线程结束时
process.begin
process("PATH").begin
process(PID).begin
process.thread.begin
process("PATH").thread.begin
process(PID).thread.begin
process.end
process("PATH").end
process(PID).end
process.thread.end
process("PATH").thread.end
process(PID).thread.end
(2) Syscall
探测点:
系统调用开始
系统调用返回
process.syscall
process("PATH").syscall
process(PID).syscall
process.syscall.return
process("PATH").syscall.return
process(PID).syscall.return
可用的进程上下文变量:
$syscall // 系统调用号
$argN ($arg1~$arg6) // 系统调用参数
$return // 系统调用返回值
(3) Function/statement
探测点:
函数入口处
函数返回处
文件中某行
函数中的某个标签
process("PATH").function("NAME")
process("PATH").statement("*@FILE.c:123")
process("PATH").function("*").return
process("PATH").function("myfunc").label("foo")
(4) Absolute variant
探测点:
进程的虚拟地址
process(PID).statement(ADDRESS).absolute
A non-symbolic probe point uses raw, unverified virtual addresses and provide no $variables.
The target PID parameter must identify a running process and ADDRESS must identify a valid instruction address.
This is a guru mode probe.
(5) Target process
探测点:
动态链接库中的函数(比如glibc)
Target process mode (invoked with stap -c CMD or -x PID) implicitly restricts all process.* probes to the given child
process.
If PATH names a shared library, all processes map that shared library can be probed.
If dwarf debugging information is installed, try using a command with this syntax:
probe process("/lib64/libc-2.8.so").function("...") { ... }
(6) Instruction probes
探测点:
单条指令
指令块
process("PATH").insn
process(PID).insn
process("PATH").insn.block
process(PID).insn.block
The .insn probe is called for every single-stepped instruction of the process described by PID or PATH.
The .insn.block probe is called for every block-stepped instruction of the process described by PID or PATH.
Using this feature will significantly slow process execution.
统计一个进程执行了多少条指令:
stap -e 'global steps; probe process("/bin/ls").insn {steps++}; probe end {printf("Total instruction: %d\n", steps)}' \
-c /bin/ls
(7) 使用
gcc -g3 -o test test.c
stap -L 'process("./test").function("*")' // 显示程序中的函数和变量
调试等级:
Request debugging information and also use level to specify how much information. The default level is 2.
Level 0 produces no debug information at all. Thus, -g0 negates -g.
Level 1 produces minimal information, enough for making backtraces in parts of the program that you don't
plan to debug. This includes descriptions of functions and external variables, but no information about local
variables and no line numbers.
Level 3: includes extra information, such as all the macro definitions present in the program.
高级功能
(1) 自建脚本库
A tapset is just a script that designed for reuse by installation into a special directory.
Systemtap attempts to resolve references to global symbols (probes, functions, variables) that are not defined
within the script by a systematic search through the tapset library for scripts that define those symbols.
A user may give additional directories with the -I DIR option.
构建自己的库:
1. 创建库目录mylib,添加两个库文件
time-default.stp
- function __time_value() {
- return gettimeofday_us()
- }
function __time_value() {
	return gettimeofday_us()
}
time-common.stp
- global __time_vars
- function timer_begin(name) {
- __time_vars[name] = __time_value()
- }
- function timer_end(name) {
- return __time_value() - __time_vars[name]
- }
global __time_vars

function timer_begin(name) {
	__time_vars[name] = __time_value()
}

function timer_end(name) {
	return __time_value() - __time_vars[name]
}
2. 编写应用脚本
tapset-time-user.stp
- probe begin {
- timer_begin("bench")
- for(i=0; i<1000; i++) ;
- printf("%d cycles\n", timer_end("bench"))
- exit()
- }
probe begin {
	timer_begin("bench")
	for(i=0; i<1000; i++) ;
	printf("%d cycles\n", timer_end("bench"))
	exit()
}
3. 执行
stap -I mylib/ tapset-time-user.stp
(2) 探测点重命名
主要用于在探测点之上提供一个抽象层。
Probe point aliases allow creation of new probe points from existing ones.
This is useful if the new probe points are named to provide a higher level of abstraction.
格式:
probe new_name = existing_name1, existing_name2[, ..., existing_nameN]
{
prepending behavior
}
实例:
- probe syscallgroup.io = syscall.open, syscall.close,
- syscall.read, syscall.write
- {
- groupname = "io"
- }
- probe syscallgroup.process = syscall.fork, syscall.execve
- {
- groupname = "process"
- }
- probe syscallgroup.*
- {
- groups[execname() . "/" . groupname]++
- }
- global groups
- probe end
- {
- foreach (eg in groups+)
- printf("%s: %d\n", eg, groups[eg])
- }
probe syscallgroup.io = syscall.open, syscall.close,
	  	     syscall.read, syscall.write
{
	groupname = "io"
}

probe syscallgroup.process = syscall.fork, syscall.execve
{
	groupname = "process"
}

probe syscallgroup.*
{
	groups[execname() . "/" . groupname]++
}

global groups

probe end
{
	foreach (eg in groups+)
		printf("%s: %d\n", eg, groups[eg])
}
(3) 嵌入C代码
SystemTap provides an "escape hatch" to go beyond what the language can safely offer.
嵌入的C代码段用%{和%}括起来,执行脚本时要加-g选项。
提供一个THIS宏,可以用于获取函数参数和保存函数返回值。
实例:
- %{
- #include <linux/sched.h>
- #include <linux/list.h>
- %}
- function process_list()
- %{
- struct task_struct *p;
- struct list_head *_p, *_n;
- printk("%-20s%-10s\n", "program", "pid");
- list_for_each_safe(_p, _n, ¤t->tasks) {
- p = list_entry(_p, struct task_struct, tasks);
- printk("%-20s%-10d\n", p->comm, p->pid);
- }
- %}
- probe begin {
- process_list()
- exit()
- }
%{
#include <linux/sched.h>
#include <linux/list.h>
%}
function process_list()
%{
struct task_struct *p;
struct list_head *_p, *_n;
printk("%-20s%-10s\n", "program", "pid");
list_for_each_safe(_p, _n, ¤t->tasks) {
p = list_entry(_p, struct task_struct, tasks);
printk("%-20s%-10d\n", p->comm, p->pid);
}
%}
probe begin {
process_list()
exit()
}stap -g embeded-c.stp
dmesg可看到打印出的所有进程。
C代码用%{ ... %}括起来,可以是独立的一个段,可以作为函数的一部分,也可以只是一个表达式。
(4) 已有脚本库
SystemTap默认提供了非常强大的脚本库,主要类别如下:
Context Functions
Timestamp Functions
Time utility functions
Shell command functions
Memory Tapset
Task Time Tapset
Secheduler Tapset
IO Scheduler and block IO Tapset
SCSI Tapset
TTY Tapset
Interrupt Request (IRQ) Tapset
Networking Tapset
Socket Tapset
SNMP Information Tapset
Kernel Process Tapset
Signal Tapset
Errno Tapset
Device Tapset
Directory-entry (dentry) Tapset
Logging Tapset
Queue Statistics Tapset
Random functions Tapset
String and data retrieving functions Tapset
String and data writing functions Tapset
Guru tapsets
A collection of standard string functions
Utility functions for using ansi control chars in logs
SystemTap Translator Tapset
Network File Storage Tapsets
Speculation
实现原理
(1) SystemTap脚本的执行流程

pass1
During the parsing of the code, it is represented internally in a parse tree.
Preprocessing is performed during this step, and the code is checked for semantic and syntax errors.
pass2
During the elaboration step, the symbols and references in the SystemTap script are resolved.
Also, any tapsets that are referenced in the SystemTap script are imported.
Debug data that is read from the DWARF(a widely used, standardized debugging data format) information,
which is produced during kernel compilation, is used to find the addresses for functions and variables
referenced in the script, and allows probes to be placed inside functions.
pass3
Takes the output from the elaboration phase and converts it into C source code.
Variables used by multiple probes are protected by locks. Safety checks, and any necessary locking, are
handled during the translation. The code is also converted to use the Kprobes API for inserting probe points
into the kernel.
pass4
Once the SystemTap script has been translated into a C source file, the code is compiled into a module that
can be dynamically loaded and executed in the kernel.
pass5
Once the module is built, SystemTap loads the module into the kernel.
When the module loads, an init routine in the module starts running and begins inserting probes into their
proper locations. Hitting a probe causes execution to stop while the handler for that probe is called.
When the handler exits, normal execution continues. The module continues waiting for probes and executing
handler code until the script exits, or until the user presses Ctrl-c, at which time SystemTap removes the
probes, unloads the module, and exits.
Output from SystemTap is transferred from the kernel through a mechanism called relayfs, and sent to STDOUT.
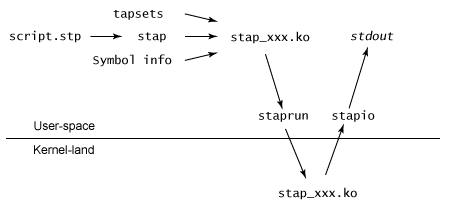
(2) 从用户空间和内核空间来看SystemTap脚本的执行
(3) kprobes
断点指令(breakpoint instruction):__asm INT 3,机器码为CC。
断点中断(INT3)是一种软中断,当执行到INT 3指令时,CPU会把当时的程序指针(CS和EIP)压入堆栈保存起来,
然后通过中断向量表调用INT 3所对应的中断例程。
INT是软中断指令,中断向量表是中断号和中断处理函数地址的对应表。
INT 3即触发软中断3,相应的中断处理函数的地址为:中断向量表地址 + 4 * 3。
A Kprobe is a general purpose hook that can be inserted almost anywhere in the kernel code.
To allow it to probe an instruction, the first byte of the instruction is replaced with the breakpoint
instruction for the architecture being used. When this breakpoint is hit, Kprobe takes over execution,
executes its handler code for the probe, and then continues execution at the next instruction.
(4) 依赖的内核特性
kprobes/jprobes
return probes
reentrancy
colocated (multiple)
relayfs
scalability (unlocked handlers)
user-space probes


 2435
2435

 被折叠的 条评论
为什么被折叠?
被折叠的 条评论
为什么被折叠?
 到【灌水乐园】发言


