


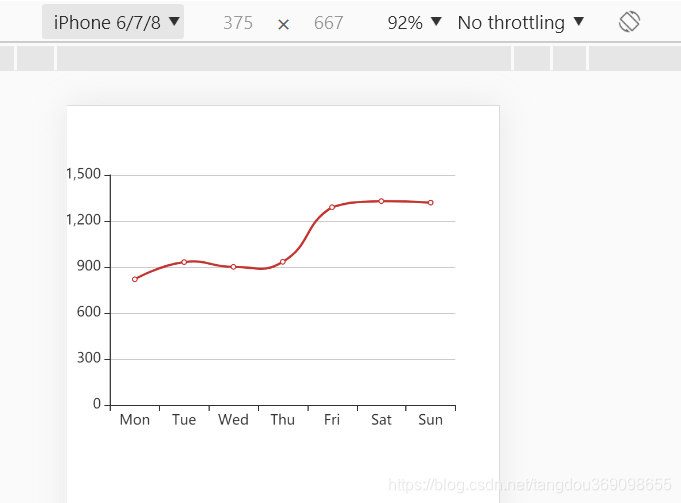
vue-echarts数据可视化实现自适应屏幕进行缩放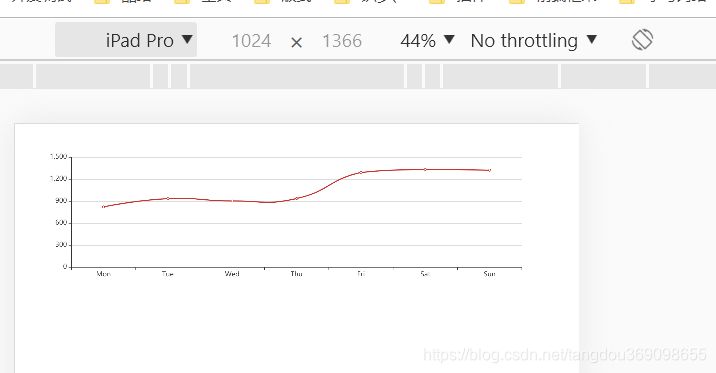
<template>
  <div style="width:100%;height:20rem" ref="res1">
    <!-- <v-chart :options="polar" style="width: 100%;height:100%;" ref="echarts1" id="chart1"/> -->
    <v-chart
      :options="orgOptions"
      :auto-resize="true"
      style="width: 100%;height:100%;"
      ref="echarts1"
      id="chart1"
    />
  </div>
</template>

<style>
.echarts {
  width: 100%;
  height: 100%;
}
</style>

<script>
import ECharts from "vue-echarts";
import "echarts/lib/chart/line";
import "echarts/lib/component/polar";

export default {
  components: {
    "v-chart": ECharts
  },
  data() {
    let data = [];

    for (let i = 0; i <= 360; i++) {
      let t = (i / 180) * Math.PI;
      let r = Math.sin(2 * t) * Math.cos(2 * t);
      data.push([r, i]);
    }

    return {
      orgOptions: {},
      polar: {
        title: {
          text: "极坐标双数值轴"
        },
        legend: {
          data: ["line"]
        },
        polar: {
          center: ["50%", "54%"]
        },
        tooltip: {
          trigger: "axis",
          axisPointer: {
            type: "cross"
          }
        },
        angleAxis: {
          type: "value",
          startAngle: 0
        },
        radiusAxis: {
          min: 0
        },
        series: [
          {
            coordinateSystem: "polar",
            name: "line",
            type: "line",
            showSymbol: false,
            data: data
          }
        ],
        animationDuration: 2000
      }
    };
  },
  mounted() {
    this.orgOptions = {
      xAxis: {
        type: "category",
        data: ["Mon", "Tue", "Wed", "Thu", "Fri", "Sat", "Sun"]
      },
      yAxis: {
        type: "value"
      },
      series: [
        {
          data: [820, 932, 901, 934, 1290, 1330, 1320],
          type: "line",
          smooth: true
        }
      ]
    };
    // 以下两种方案均可
    window.addEventListener("resize", this.resizeTheChart);
    //  setInterval(() => {
    //     window.onresize = function () {
    //      if (this.$refs && this.$refs.echarts1 ) {
    //         this.resizeTheChart()
    //     }
    //     }
    //   }, 100)
  },
  methods: {
    resizeTheChart() {
      if (this.$refs && this.$refs.echarts1) {
        this.$refs.echarts1.resize();
      }
    }
  },
  beforeDestroy() {
    window.removeEventListener("resize", this.resizeTheChart);
  }
};
</script>


 1727
1727


 被折叠的 条评论
为什么被折叠?
被折叠的 条评论
为什么被折叠?
 到【灌水乐园】发言


