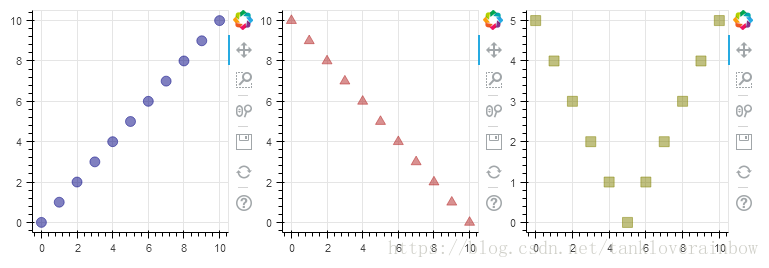
如果希望在同一张图上显示多个图像,可以使用bokeh.layouts类中的方法:
- row()
- column()
- gridplot()
- widgetbox()
- layout()
row()
row()的作用是将多个图像以行的方式放到同一张图中。
from bokeh.io import output_file, show
from bokeh.layouts import row
from bokeh.plotting import figure

output_file("layout.html")

x = list(range(11))
y0 = x
y1 = [10 - i for i in x]
y2 = [abs(i - 5) for i in x]

# create a new plot
s1 = figure(plot_width=250, plot_height=250, title=None)
s1.circle(x, y0, size=10, color="navy", alpha=0.5)

# create another one
s2 = figure(plot_width=250, plot_height=250, title=None)
s2.triangle(x, y1, size=10, color="firebrick", alpha=0.5)

# create and another
s3 = figure(plot_width=250, plot_height=250, title=None)
s3.square(x, y2, size=10, color="olive", alpha=0.5)

# put the results in a row
show(row(s1, s2, s3))
column()
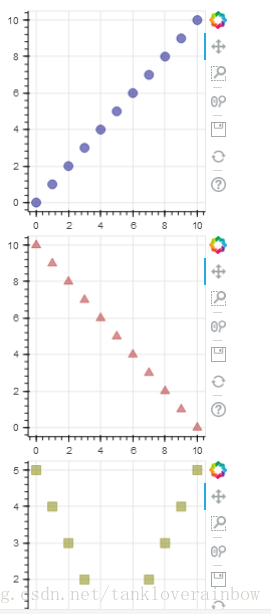
column()的作用是将多个图像以列的方式放到同一张图像中。
from bokeh.io import output_file, show
from bokeh.layouts import column
from bokeh.plotting import figure

output_file("layout.html")

x = list(range(11))
y0 = x
y1 = [10 - i for i in x]
y2 = [abs(i - 5) for i in x]

# create a new plot
s1 = figure(plot_width=250, plot_height=250, title=None)
s1.circle(x, y0, size=10, color="navy", alpha=0.5)

# create another one
s2 = figure(plot_width=250, plot_height=250, title=None)
s2.triangle(x, y1, size=10, color="firebrick", alpha=0.5)

# create and another
s3 = figure(plot_width=250, plot_height=250, title=None)
s3.square(x, y2, size=10, color="olive", alpha=0.5)

# put the results in a column and show
show(column(s1, s2, s3))
gridplot()
如果希望以矩阵的方式将多个图像放到同一张图上,可以使用gridplot()函数,如果某个位置的图像为空,可以设定为None。
from bokeh.io import output_file, show
from bokeh.layouts import gridplot
from bokeh.palettes import Viridis3
from bokeh.plotting import figure

output_file("layout_grid.html")

x = list(range(11))
y0 = x
y1 = [10 - i for i in x]
y2 = [abs(i - 5) for i in x]

# create three plots
p1 = figure(plot_width=250, plot_height=250, title=None)
p1.circle(x, y0, size=10, color=Viridis3[0])
p2 = figure(plot_width=250, plot_height=250, title=None)
p2.triangle(x, y1, size=10, color=Viridis3[1])
p3 = figure(plot_width=250, plot_height=250, title=None)
p3.square(x, y2, size=10, color=Viridis3[2])

# make a grid
grid = gridplot([[p1, p2], [None, p3]])

# show the results
show(grid)
要注意的是,gridplot()函数只能接受figure类,不能接受widget类,如果希望一张图像中既有figure类也有widget类,就需要用layout()方法。文档中关于gridplot()的介绍如下,可以看到输入参数只能是Plot类,即figure类:

widgetbox()
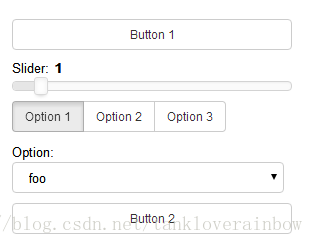
如果希望在图像中插入widgets(小部件),可以使用widgetbox()函数。
from bokeh.io import output_file, show
from bokeh.layouts import widgetbox
from bokeh.models.widgets import Button, RadioButtonGroup, Select, Slider

output_file("layout_widgets.html")

# create some widgets
slider = Slider(start=0, end=10, value=1, step=.1, title="Slider")
button_group = RadioButtonGroup(labels=["Option 1", "Option 2", "Option 3"], active=0)
select = Select(title="Option:", value="foo", options=["foo", "bar", "baz", "quux"])
button_1 = Button(label="Button 1")
button_2 = Button(label="Button 2")

# put the results in a row
show(widgetbox(button_1, slider, button_group, select, button_2, width=300))
layout()
layout()函数的作用有两个:
- 将多个图像按照矩阵样式摆放到同一张图中
- 输入参数可以是Plot, Widget, WidgetBox, Row, Column, ToolbarBox, Spacer,不仅限于Plot类
官网文档中的介绍如下:

来自github中的一个例子如下:
import numpy as np

from bokeh.layouts import layout
from bokeh.models import CustomJS, Slider, ColumnDataSource, WidgetBox
from bokeh.plotting import figure, output_file, show

output_file('dashboard.html')

tools = 'pan'


def bollinger():
    # Define Bollinger Bands.
    upperband = np.random.random_integers(100, 150, size=100)
    lowerband = upperband - 100
    x_data = np.arange(1, 101)

    # Bollinger shading glyph:
    band_x = np.append(x_data, x_data[::-1])
    band_y = np.append(lowerband, upperband[::-1])

    p = figure(x_axis_type='datetime', tools=tools)
    p.patch(band_x, band_y, color='#7570B3', fill_alpha=0.2)

    p.title.text = 'Bollinger Bands'
    p.title_location = 'left'
    p.title.align = 'left'
    p.plot_height = 600
    p.plot_width = 800
    p.grid.grid_line_alpha = 0.4
    return [p]


def slider():
    x = np.linspace(0, 10, 100)
    y = np.sin(x)

    source = ColumnDataSource(data=dict(x=x, y=y))

    plot = figure(
        y_range=(-10, 10), tools='', toolbar_location=None,
        title="Sliders example")
    plot.line('x', 'y', source=source, line_width=3, line_alpha=0.6)

    callback = CustomJS(args=dict(source=source), code="""
        var data = source.data;
        var A = amp.value;
        var k = freq.value;
        var phi = phase.value;
        var B = offset.value;
        var x = data['x']
        var y = data['y']
        for (var i = 0; i < x.length; i++) {
            y[i] = B + A*Math.sin(k*x[i]+phi);
        }
        source.change.emit();
    """)

    amp_slider = Slider(start=0.1, end=10, value=1, step=.1, title="Amplitude", callback=callback, callback_policy='mouseup')
    callback.args["amp"] = amp_slider

    freq_slider = Slider(start=0.1, end=10, value=1, step=.1, title="Frequency", callback=callback)
    callback.args["freq"] = freq_slider

    phase_slider = Slider(start=0, end=6.4, value=0, step=.1, title="Phase", callback=callback)
    callback.args["phase"] = phase_slider

    offset_slider = Slider(start=-5, end=5, value=0, step=.1, title="Offset", callback=callback)
    callback.args["offset"] = offset_slider

    widgets = WidgetBox(amp_slider, freq_slider, phase_slider, offset_slider)
    return [widgets, plot]


def linked_panning():
    N = 100
    x = np.linspace(0, 4 * np.pi, N)
    y1 = np.sin(x)
    y2 = np.cos(x)
    y3 = np.sin(x) + np.cos(x)

    s1 = figure(tools=tools)
    s1.circle(x, y1, color="navy", size=8, alpha=0.5)
    s2 = figure(tools=tools, x_range=s1.x_range, y_range=s1.y_range)
    s2.circle(x, y2, color="firebrick", size=8, alpha=0.5)
    s3 = figure(tools='pan, box_select', x_range=s1.x_range)
    s3.circle(x, y3, color="olive", size=8, alpha=0.5)
    return [s1, s2, s3]

l = layout([
    bollinger(),
    slider(),
    linked_panning(),
], sizing_mode='stretch_both')

show(l)


 2083
2083

 被折叠的 条评论
为什么被折叠?


