


 本文介绍如何使用SQL Server 2005 Profiler创建跟踪来捕捉慢查询,并通过分析跟踪数据来定位和解决性能问题。
As DBAs, one of the problems we face on an almost daily basis is slow-running queries. These are the ones that:
- Take 1 minute, 5 minutes, even 30 minutes to complete.
- Spike CPU utilization to 90% or more.
- Block other users from getting their work done.
- Result in your boss being called by an end-user's boss to find out why the problem hasn't been fixed yet.
Most of all, however, these are the kinds of queries that keep us up late at night, ruining our sleep and turning us into zombies. What can we do to fix this problem, once and for all? The answer: employ SQL Server 2005 Profiler, and our experience as a DBA.
One of the most powerful ways to use Profiler is to identify slow running queries; what's more, it is a simple and straightforward process that every DBA can master very quickly. Once poorly performing queries are identified, we need to figure out how to speed them up. This is not as easy as finding them in the first place, but Profiler can provide a lot of information that can help diagnose and resolve these performance problems.
So, in this article, we discuss the following:
- How to create a Profiler trace to capture all the information we need to identify and analyze slow running queries
- How to analyze the poorly-performing queries identified by Profiler
Creating a Trace to Identify Slow Running Queries
This section covers the mechanics of how to create a Profiler trace template to capture and analyze slow running queries. The same approach can be applied to resolving many other SQL Server problems, so what you learn here can be applied to Profiler-based troubleshooting generally.
Selecting Events
Before you can choose which events to include in your trace, you first need to decide what information you want to capture. Well, we already have said we want to capture slow-running queries. Isn't that enough information to go on? Not really. Queries can come to a SQL Server instance in the form of stored procedures, batches of queries, or individual queries, so it's essential that you include the necessary events to capture all three forms in which a slow-running query can appear.
Also, keep in mind that stored procedures can be executed in two different ways:
- An RPC event – i.e. as a result of a Remote Procedure Call
- A Transact-SQL event – i.e. as a result of a call to the T-SQL EXECUTE statement
So you might need to capture both types of stored procedure events.
Last of all, you need to include any additional events that will provide clues why a particular query is slow, such as events that provide information about how a query performs, and "context" events that help put the query in perspective. Context events are those events that happen directly before and after other events, helping us understand more fully what is going on inside SQL Server.
So which events should you select? There is no single "correct combination" of events to include in a trace such as this. While one DBA may want to use seven different events to identify and analyze slow running queries, another DBA might use nine events, or only five. As the DBA, you must know Profiler events well enough in order to determine which events are needed for a particular situation.
NOTE: See my book. 'Mastering SQL Server Profiler' which can be downloaded free here. In Chapter 11 of the book, Profiler Events and Data Columns Reference, there are descriptions of all the events and data columns likely to be of interest to the DBA.
In this case, I am going to describe the events I think are needed to identify long-running queries. Feel free to modify my suggestions when performing your own traces. Just keep in mind that in order to minimize the load the trace will put on your SQL Server instance, you should minimize the number of events you collect.
When I troubleshoot slow-performing queries, I like to capture the following events:
- RPC:Completed
- SP:StmtCompleted
- SQL:BatchStarting
- SQL:BatchCompleted
- Showplan XML
Let's look at each one to see what the event does, and why I have chosen to collect it for this particular trace.
RPC:Completed
The RPC: Completed event fires after a stored procedure is executed as a remote procedure call.
This event includes useful information about the execution of the stored procedure, including the Duration, CPU, Reads, Writes, together with the name of the stored procedure that ran. If a stored procedure is called by the Transact-SQL EXECUTE statement, then this event will not fire. In addition, this event does not fire for Transact-SQL statements that occur outside a stored procedure.
SP:StmtCompleted
The SP:StmtCompleted event tells us when a statement within a stored procedure has completed.
It also provides us the text (the Transact-SQL code) of the statement, along with the event's Duration, CPU, Reads, and Writes. Keep in mind that a single stored procedure may contain a single, or many, individual statements. For example, if a stored procedure executes five SELECT statements, then there will be five SP:StmtCompleted events for that stored procedure. This event does not fire for Transact-SQL statements that occur outside a stored procedure.
SQL:BatchStarting
A SQL: BatchStarting event is fired whenever a new Transact-SQL batch begins. This can include a batch inside or outside a stored procedure.
I use this as a context event because it fires anytime a new stored procedure or Transact-SQL statement fires, allowing me to better see where a new chain of query-related events begins.
SQL:BatchCompleted
The SQL: BatchCompleted event occurs when a Transact-SQL statement completes, whether the Transact-SQL statement is inside or outside a stored procedure.
If the event is a stored procedure, SQL:BatchCompleted provides the name of the stored procedure (but not the actual Transact-SQL code), together with the Duration, CPU, Reads, and Writes of the statement. It may seem as if this event is somewhat redundant, in that it produces very similar results to the SP:StmtCompleted event. Unfortunately, you need to capture both events:SQL:BatchCompleted to provide Duration, CPU, Reads, and Writes event data when a Transact-SQL statement is run outside a stored procedure, and SP:StmtCompleted to see more easily what the code is inside a stored procedure.
ShowPlan XML
This event displays the graphical execution plan of a query.
While ShowPlan XML is not required to identify slow running queries, it is critical to understanding why a query is performing poorly and it needs to be included with the trace.
If you are a little confused about what each of these event do, don't worry, as we will see them in action very soon, when their use will make much more sense.
Analyzing Captured Events
Figure 4-1 shows an example trace, displaying the captured events relating to the firing of a single stored procedure. Let's examine each event in turn and see how they "fit" together.
NOTE: This example focuses on tracing a stored procedure called by the EXECUTE statement, and not called as a Remote Procedure Call (RPC).
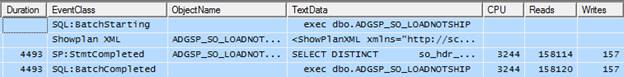
Figure 4-1: Trace results of a stored procedure.
Row 1 shows the SQL:BatchStarting event. The main reason I use this context event is because it indicates when a stored procedure is called, along with its name. In this case, the stored procedure isdbo.ADGSP_SO_LOADNOTSHIP.
Row 2 shows the Showplan XML event, which provides a graphical execution plan of the Transact-SQL statement shown in the next event (Row 3). We'll discuss graphical execution plans in more detail a little later in this article.
Row 3 is the SP:StmtCompleted event, which shows the actual code that has run (you can see part of it in theTextData data column in figure 4-1 above), together with the time taken by the event (Duration), the amount of CPU time, and the number of logical Reads and physical disk Writes. While this example has a singleSP:StmtCompleted event, as noted earlier, if a stored procedure has more than one statement in it, you will see a SP:StmtCompleted event for each individual statement within the stored procedure.
The SQL:BatchCompleted event in Row 4 indicates that this stored procedure has completed, and that all statements within it have fired. It also displays the name of the stored procedure (again), and the Duration, CPU, Reads, and Writes for the entire stored procedure. Since there is only a single statement in the stored procedure, the values for the Duration, CPU, Reads, and Writes for the SQL:BatchCompleted event are very similar to those for SP:StmtCompleted event in row 3. If there were multiple statements within the stored procedure, then the Duration, CPU, Reads, and Writes for the SQL:BatchCompleted event would be the sum (or a very close approximation) of all the SP:StmtCompleted events that occurred during the execution of the stored procedure.
Let's now look at a different example. Figure 4-2 show a captured event related to the firing of a single Transact-SQL statement that is not inside a stored procedure.
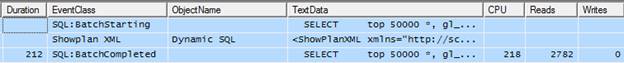
Figure 4-2: Traces results of a query not inside a stored procedure.
When this single T-SQL query executes, it generates three events.
Row 1 shows the SQL:BatchStarting event, but because we're looking at the execution of a single T-SQL statement, rather than a stored procedure, the TextData data column of the SQL:BatchStarting event shows the T-SQL code of the query that is executing, not the name of a stored procedure, as we saw in the previous example.
Row 2 shows the Showplan XML event, which provides a graphical execution plan of the Transact-SQL statement that was executed.
Row 3 shows the SQL:BatchCompleted event, which repeats the T-SQL code in the TextData data column we saw in the SQL:BatchStarting event in Row 1, but it also includes the Duration, CPU, Reads, and Writes for the event.
By this time, hopefully you are beginning to see why I have selected the events I did, and how they are used. The more you use Profiler to analyze trace results like this, the easier it will for you to become familiar with the various events and how they can best provide the information you need when analyzing them.
Selecting Data Columns
Having discussed the Profiler events needed to identify slow queries and why, it's time to do the same for the data columns. I reiterate: it's important to select only those data columns you really need, in order to minimize the amount of resources consumed by the trace. The fewer data columns you select, the less overhead there is in collecting it.
As with events, the data columns regarded as necessary will vary from DBA to DBA. In my case, I choose to collect these data columns when identifying slow queries:
- Duration
- ObjectName
- TextData
- CPU
- Reads
- Writes
- IntegerData
- DatabaseName
- ApplicationName
- StartTime
- EndTime
- SPID
- LoginName
- EventSequence
- BinaryData
Let's look at each one to see what it collects. While I might not use all the information found in all columns for every analysis, I generally end up using all of them at some point in time as I analyze various queries.
Duration
This very useful data column provides the length of time in microseconds that an event takes from beginning to end, but what is curious is than when Duration is displayed from the Profiler GUI, it is shown, by default, in milliseconds. So internally, SQL Server stores Duration data as microseconds, but displays it as milliseconds in Profiler. If you want, you can change this default behavior by going to Tools|Options in Profiler and select "Show values in Duration column in microseconds". I prefer to leave it to the default display of milliseconds, as it is easier to read. All the examples will be shown in milliseconds.
Since our goal in this trace is to identify long-running queries, the Duration data column is central to our analysis. Later, we will create both a filter and an aggregation on this data column to help with our analysis.
Note that the Duration data column only exists for the RPC:Completed, SP:StmtCompleted andSQL:BatchCompleted events.
ObjectName
This is the logical name of the object being referenced during an event. If a stored procedure is being executed, then the name of the stored procedure is displayed. If an isolated query is being executed, then the message "Dynamic SQL" is inserted in this data column. This column therefore provides a quick means of telling whether or not a query is part of a stored procedure.
Note that this data column is not captured for the SQL:BatchStarting or theSQL:BatchCompleted events.
TextData
As our previous examples have indicated, the contents of the TextData column depend on the event that is being captured and in what context.
For the SQL:BatchStarting or SQL:BatchCompleted events, the TextData column will either contain the name of the executing stored procedure or, for a query outside a stored procedure, the Transact-SQL code for that query.
If the event is SP:StmtCompleted, the TextData column contains the Transact-SQL code for the query executed within the stored procedure.
For the Showplan XML event, it includes the XML code used to create the graphical execution plan for the query.
CPU
This data column shows the amount of CPU time used by an event (in milliseconds). Obviously, the smaller this number, the fewer CPU resources were used for the query. Note that CPU data column is only captured for the RPC:Completed, SP:StmtCompleted, and the SQL:BatchCompleted events.
Reads
This data column shows the number of logical page reads that occurred during an event. Again, the smaller this number, the fewer disk I/O resources were used for the event. Note that Reads are only captured for the RPC:Completed, SP:StmtCompleted and the SQL:BatchCompleted events.
Writes
This data column shows the number of physical writes that occurred during an event and provides an indication of the I/O resources that were used for an event. Again, Writes is only captured for theRPC:Completed, SP:StmtCompleted and the SQL:BatchCompleted events.
IntegerData
The value of this column depends on the event. For the SP:StmtCompleted event, the value is the actual number of rows that were returned for the event. For the ShowPlan XML event, it shows the estimated number of rows that were to be returned for the event, based on the query's execution plan. The other events don't use this data column. Knowing how many rows a query actually returns can help you determine how hard a query is working. If you know that a query returns a single row, then it should use a lot less resources than a query that returns 100,000 rows. If you notice that the actual number or rows returned is significantly different that the estimated value of rows returned, this may indicate that the statistics used by the Query Optimizer to create the execution plan for the query is out of date. Out of date statistics can result in poorly performing queries and they should be updated for optimal query performance.
DatabaseName
This is the name of the database the event occurred in. Often, you will want to filter on this data column so that you only capture those events that occur in a specific database.
ApplicationName
This is the name of the client application that is communicating with SQL Server. Some applications populate this data column; others don't. Assuming this data column is populated, you can use it to filter events on a particular application.
StartTime
Virtually every event has a StartTime data column and, as you would expect, it includes the time the event started. Often, the start time of an event can be matched to other related events to identify their order of execution. It can also be compared to the stop time of events to determine the differences in time between when one event started and another completed.
EndTime
The EndTime data column is used for those events that have a specific end time associated with them. It can be used to help identify when a particular query or transaction runs at a specific point in time.
SPID
This data column is mandatory for every event, and contains the number of the server process ID (SPID) that is assigned to the client process creating the event. It can help identify what connections are being used for an event, and can also be used as a filter to limit the number of events returned to those of particular interest.
LoginName
Most events include the LoginName data column. It stores the login of the user that triggered the event. Depending on the type of login used, this column can contain either the SQL Server login ID or the Windows Login ID (domain\username). This very useful data column helps you identify who is causing potential problems. It is a good column to filter on, in order to limit trace results to those of a specific user.
EventSequence
Every event produced by SQL Server Profiler is assigned a sequence number that indicates the order that events occurred in SQL Server. Much of the time, you will capture traces in default order, which means the events are displayed in the order they occurred in the Profiler GUI. EventSequence numbers appear in ascending order.
However, should you choose to apply a custom grouping, based on a certain data column such as Duration, then the EventSequence data column makes it easier for you to see which events occurred before, or after, other events.
BinaryData
This data column is only populated for the Showplan XML event and includes the estimated cost of a query, which is used for displaying the graphical execution plan of the query. This data is not human-readable, and is used by Profiler internally to help display the graphical execution plan.
Creating a Filter
When creating a trace to identify long-running queries, I generally include two or more filters in order to minimize the number of rows returned in my trace.
The first, and most important, filter I create is on the Duration data column, which returns the length of time it takes for a particular event (query) to run. I use this filter to exclude queries that execute very quickly (which is most queries). The hard part is determining the threshold at which a query becomes "long-running". For example, is a long-running query one that takes more than 1 second, more than 5 seconds, more than 15 seconds?
I generally use 5000 milliseconds (5 seconds), although this is just a personal preference and you will want to adjust this to best meet your needs. In this example, however, I am going to use 100 milliseconds as my limit, just because it is easier to create illustrative examples using a smaller value.
In addition to the Duration filter, I generally add additional ones in order to reduce the number of events captured. For example, I might only want to collect queries for a specific database, a specific application, or a specific user. In this example, I have created a second filter on the DatabaseName column, in order to limit my trace data to events raised in a specific database, as shown in Figure 4-3:
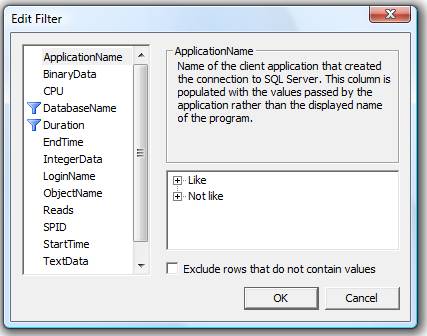
Figure 4-3: Create whatever filters you need to limit the amount of events returned.
Organizing Columns
When you use the "Organize Columns" window, you have two major decisions to make:
- Whether or not you want to group any of the data columns and aggregate the results
- The order in which you want the data columns arranged when the trace results are returned.
Judicious column organization can make the analysis of the results much easier to perform. When creating a trace to identify long running queries, I always group by Duration, as shown in figure 4-4, so that I can quickly identify the longest-running queries:
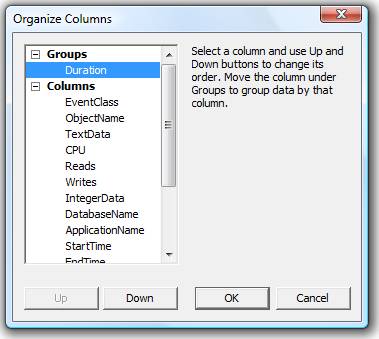
Figure 4-4:
I like to group by Duration, and arrange the other data columns in the order that makes the most sense for me.I also like to rearrange the order of the data columns so that the most useful columns appear to the left, and the less useful columns to the right. Figure 4-4 above shows my personal preferences.
Creating a Template
I run this trace a lot, so I have created it as a custom trace template, which includes all the events, data columns, column filters and column organization described previously. I suggest you do the same, as described in the "Custom Profiler Trace Templates" section of Chapter 2 of the book from which this article is taken.
Running the Trace
Once you have created your trace template, it is time to run it. Ideally this will be on a production server, otherwise on a test server and a stress test tool, or a simple load-generation script (see Chapter 1 of the book).
Keep the following in mind when you run this trace to identify slow running queries:
- Select a day that represents a typical workload.
- Run the trace for an entire day. This might seem like a long time, but if your filters are effective, you should not collect too much data. If this is the first time you have run it, you may want to monitor the trace file size throughout the day to ensure that it is not using up too much space.
- Before you start the trace, choose to save it to a file as the trace runs.
- Start the trace manually and set it to stop automatically after 24 hours.
Up to this point, we have only discussed running traces from the Profiler GUI. However, you can also run this same trace using system stored procedures. By doing so, you will reduce the load on the server. You will learn how to use system-stored procedures to run a trace in the book, in the chapter on "How to Capture Profiler Traces Programmatically".
Once you have captured the trace, you are ready to analyze it.
Analyzing the Poorly Performing Queries Identified by Profiler
Let's assume that you have just created and run a trace similar to the one just described. What do the results look like, and how do you use this trace to identify and troubleshoot slow-performing queries?
The following sections set out my preferred way of performing an analysis on slow-performing queries. As always, through practice, you will develop a methodology that works best for you.
The Big Picture
Before drilling down into statement-level analysis, I always start by looking at the big picture. When I ran our example trace template on my sample database, I got trace screen that looked as shown in Figure 4-5:
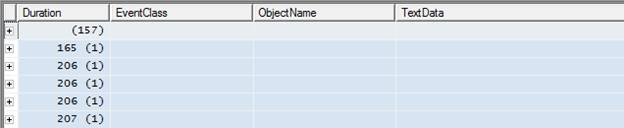
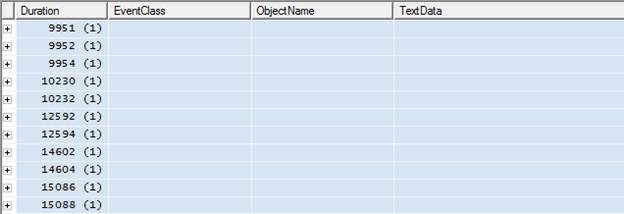
Figure 4-5:
After you have completed the trace, scroll through the events to get a feeling for the results you got back. Note that, since the events are grouped by Duration, each event is aggregated by Duration. Also, all one can see are the Duration times; no other data. Given the absence of any data beyond duration, you may be tempted to drill quickly down to individual events. However, it is definitely worth spending a little time analyzing this "big picture" screen.
In Figure 4-5, for ease of presentation, I've actually split one big screen into two smaller ones. The top screen shows 5 events that marginally exceeded the 100-millisecond threshold and the lower screen shows 11 events that exceeded it substantially. This information, on its own, can be informative. What if, for example, there were several hundred events that "marginally" exceeded the threshold? You would very quickly be overwhelmed with data – an indication that the Duration threshold on your filter is not set appropriately. The next time you run this trace, you should increase the Duration threshold on your filter so that you can focus your efforts on a manageable number of events and on those that need the most urgent attention. Having fixed these queries you can then rerun the trace with a lower Duration limit and start work on the slow-running queries that did not make the first cut.
Conversely, you may find that only very few events have been captured. If this is the case, then you may want to rerun the trace using a lower Duration threshold, in order to identify more queries. Of course, this also may be a sign that you don't have any long-running queries, which would be a good thing.
Finding Slow-Running Procedures and Queries
The next step is to review each event in the trace, starting with those at the bottom – i.e. the slowest-running events that took the most time to execute. To do this, click on the plus sign next to each of the events you want to examine, as shown in figure 4-6:
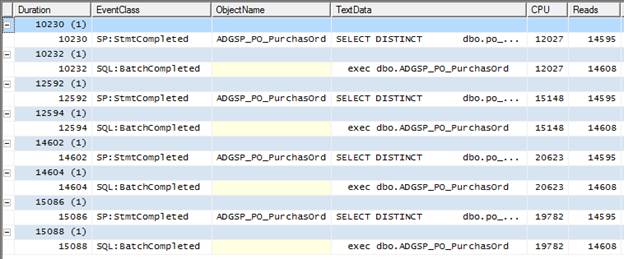
Figure 4-6:
Once the events are revealed, an entirely different representation of your data may appear.The first thing to do is analyze this screen for any obvious "patterns".
NOTE: The rows highlighted in blue aren't events, but aggregated results of events. The rows in white are the actual events captured by Profiler and this is where you should focus your attention.
The most obvious pattern is that the same stored procedure, ADGSP_PO_PurchasOrd, occurs in theObjectName data column for each of the four SP:StmtCompleted events, including the longest running event, which takes over 15 seconds. This is a strong indication that this stored procedure would be a good place to start your investigations.
The second pattern, a little more subtle, is that each execution of this stored procedure appears to be associated with two events: SP:StmtCompleted and SQL:BatchCompleted. The first SP:StmtCompleted event in Figure 4-6, for example, is related to completion of the execution of a SELECT DISTINCT…query within theADGSP_PO_PurchasOrd stored procedure. Its duration was 10230, the CPU time was 12027 and there were 14595 reads. Following that is a SQL:BatchCompleted event relating to completion of the execution of the theADGSP_PO_PurchasOrd stored procedure, with a duration of 10232, CPU time of 12027 and 14608 reads.
If the Duration, CPU and Reads times for these two events look suspiciously similar. That is because, in this case, they are in effect the same event. So, the 8 events that we see here represent the execution of 4 queries – not 8 queries, as you may initially suspect. In fact, what we are seeing here is 4 executions of a stored procedure that contains a single T-SQL statement. The SP:StmtCompleted is fired when the Transact-SQL statement within the stored procedure has completed; the SQL:BatchCompleted event is fired whenever a Transact-SQL statement is fired, whether or not it is inside or outside a stored procedure, and it also fires at the end of the execution of every stored procedure. In this case, these two events occur more or less simultaneously.
You may be thinking that this is an unnecessary duplication of data, and we should just collect one event or the other. However, there are several reasons why it is essential to capture both events. The most obvious one is that, if we omitted the SQL:BatchCompleted event, then we would miss any T-SQL statements that occurred outside of a stored procedure.
Furthermore, consider a different set of trace results, as shown in Figure 4-7:
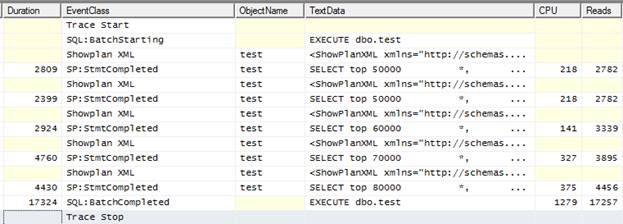
Figure 4-7: This is an example with a stored procedure that has five queries within it.
Here, we see:
- One SQL:BatchStarting event, relating the start of the execution of a dbo.test stored procedure
- Five SP:StmtCompleted events, each with a different duration, and each representing the execution of a separate query within a single stored procedure
- One SQL:BatchCompleted event relating the end of the execution of a dbo.test stored procedure
If you add up the Duration, CPU, and Reads for each query within the stored procedure, the sum total will be very close to the total found in the SQL:BatchCompleted event.
This is another example of why it is important to include both the SQL:BatchCompleted (andSQL:BatchStarting) event as well as the SP:StmtCompleted event, when performing an analysis of slow-performing queries. The former gives you the big picture for the stored procedure and the latter the details.
To summarize what we have learned so far: we have identified eight events that took over 10 seconds each to execute. We discovered that a single stored procedure was the cause of all 8 events that exceeded 10 seconds. We then drilled down into the data and discovered that there were not really eight queries but only four, as each execution of the stored procedure was represented by two events and what we were seeing was four executions of a stored procedure containing a single T-SQL statement.
While, for our simple example, it seemed as if we were collecting duplicate data, we also saw that for more complex traces it was vital to collect all these events, in order to get the complete picture.
Finding Queries and Procedures that Execute Frequently
It is important not only to identify long-running queries, but also to identify those queries that execute the most often. For example, which is worse, a query that runs once an hour and takes 30 seconds to run, or a query that runs 100 times a second that takes 1 second to run? I think you would agree that the shorter query would probably have more effect on the overall performance of the system than the longer one.
So how do we determine how often a query runs? Unfortunately, the tools that accompany SQL Server don't make this easy. One option would be use the SQL Server 2005 SP2 Performance Dashboard tool. This tool automatically calculates the twenty most resource-hogging queries that are currently in the plan cache. It does this by summing up the total duration of queries each time they run, which identifies those queries that use the most resources overall. The problem with this tool is that it only accounts for queries that are currently in the plan cache. This means that the results don't fairly represent all the queries that have run all day on your SQL Server instance.
Alternatively, we can export our profiler trace data into a SQL Server table, as described in Chapter 2 of the book, and use a little SQL code to produce the report we need, as shown in figure 4-8:
SELECT [ObjectName],
COUNT(*) AS [SP Count]
FROM [dbo].[Identify_query_counts]
WHERE [Duration] > 100
AND [ObjectName] IS NOT NULL
GROUP BY [ObjectName]
ORDER BY [SP Count] DESC
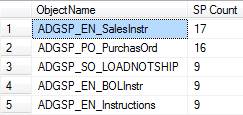
Figure 4-8: You can manually perform your own analysis on trace data stored in a SQL Server table.
NOTE: This code sample only counts stored procedures, not other T-SQL that may have been captured in your trace. You will need to modify the query in order to extract information on these queries.
This code simply counts the number of times a stored procedure has run with a duration longer than 100 milliseconds. We can immediately see that the ADGSP_PO_PurchasOrd stored procedure, which we identified as the home of our longest running queries, is the second most commonly run query in this trace. This is a confirmation that this procedure, and the query within it, needs our attention
Once we have dealt with it, we can then use the information from figure 4-6 (long-running queries) and figure 4-8 (how often queries run) to help us prioritize what other queries we should focus on.
As you can see, you have many options about how to analyze your data. It is impossible to explore them all. What I hope to accomplish is for you to be aware of your options and then, based on your current skill set and available tools, for you decide the best approach to identify those queries that need the greatest attention.
Analyzing Problem Queries
Now that we have identified a specific stored procedure, ADGSG_PO_PurchasOrd, that needs work, let's start analyzing it so that we can identify what is the cause of its slowness, with the presumption that it will enable us to fix the problem.
Drilling in to the Trace Data
At this point, within Profiler, our data has been aggregated by Duration. This is a useful way to get started on our analysis, as we have already discovered. In the next step, what I often do is to disaggregate the data, so that the events are displayed in the order they actually occurred. This allows me to examine the stored procedure in question in the context of actual events occurring on the server.
To disaggregate trace data, select from the main menu, View|Aggregated View, as shown in Figure 4-9:
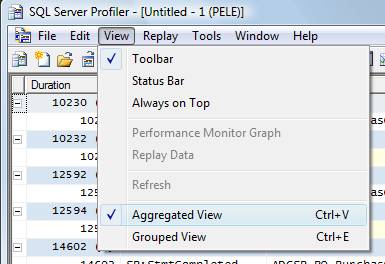
Figure 4-9:
Turn off the aggregated view by unselecting the option. This will remove the checkmark next to "Aggregated View" and the data you see in Profiler changes appearance, as shown in Figure 4-10:

Figure 4-10: Events are now ordered in the way they were captured.
In Figure 4-10, I have scrolled the window to display three distinct stored procedure events. The first one is highlighted in blue, which shows all the events we captured that are associated with theADGSP_PO_PurchasOrd stored procedure. We also see another four events associated with a second execution of the same stored procedure, and we see a third stored procedure that's not related to our current analysis. To keep our analysis simple, let's focus on the four events highlighted in blue.
Together, these four events describe what happens to the stored procedure as it is executed. In row 1, we see that a SQL:BatchStarting event has occurred. By expanding the TextData column, or just by clicking on the event row and examining the window in the bottom half of the Profiler screen, as shown in Figure 4-11, we can see that it relates to the execution of our problem ADGSP_PO_PurchasOrd stored procedure:
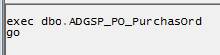
Figure 4-11:
Whenever you click on an event row, the value of the TextData data column is displayed in the window at the bottom of the Profiler screen.
As mentioned earlier in this article, the SQL:BatchStarting event is a context event. It is not strictly required for analysis of slow queries, but it helps us to keep track of where we are in an analysis.
Row 2 in Figure 4-10 is a Showplan XML event, providing a graphical execution plan of the Transact-SQL that is about to be executed. To view the graphical execution plan, click on this row and you will see it at the bottom of the screen, as shown in Figure 4-12:
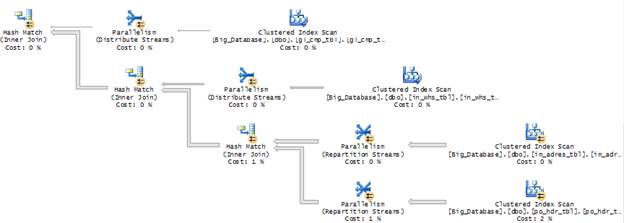
Figure 4-12:
This figure only shows part of the execution plan. The entire plan would not fit on the screen.
The graphical execution plan is our main tool for determining why a particular query may be slow. For the moment, however, let's hold off on how to interpret it and look at row 3 of Figure 4-10.
Row 3 shows the SP:StmtCompleted event, indicating the end of a Transact-SQL statement within a stored procedure. It also includes the Duration, CPU, Reads and Writes for the statement. What is useful about this event is found in the TextData column. When you click on this row, the code that just ran is displayed at the bottom window of the screen, as shown in Figure 4-13:
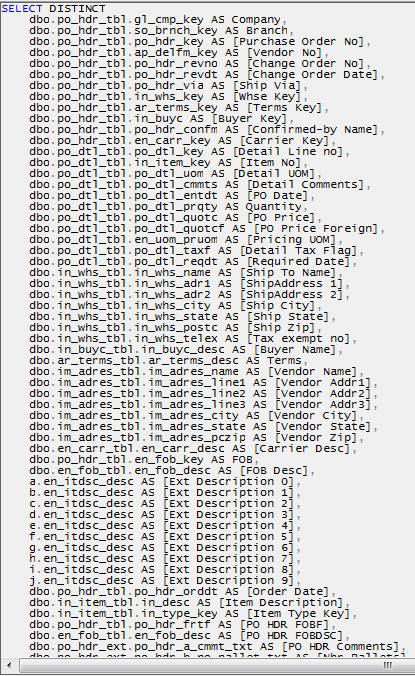
Figure 4-13: The code for this stored procedure is so long that only a small portion of it appears in this figure.
If I did not collect this event as part of my trace, then I would have to manually go to Management Studio, find the stored procedure code within the stored procedure itself, and then look at it there. As it is now displayed in Profiler, I can view the full T-SQL code right alongside the execution plan, which we will soon find is very useful.
Row 4 is the SQL:BatchCompleted event; it includes the Duration, CPU, Reads, and Writes data columns summed for the entire stored procedure. In this case, since there is only one Transact-SQL statement in the stored procedure, the SP:StmtCompleted and SQL:BatchCompleted events are almost identical.
In these cases, I use the values from the SQL:BatchCompleted event as they tend to be a little larger than the same values from the SP:StmtCompleted event. However, in reality, the differences between them are so small it is unimportant which one you end up using.
Does a Query Run Slowly Every Time?
Let's recap what we know for certain at this stage:
- We know that the longest-running T-SQL statement (>15 seconds) arose from the execution of theADGSP_PO_PurchasOrd stored procedure (Figure 4-6).
- We know for sure that this stored procedure ran 16 times over our examination period (Figure 4-8)
- We know which four events make up the execution of this stored procedure
What we don't know is whether this procedure always runs slowly, or just occasionally. Generally, we would expect the same Transact-SQL code to run in about the same amount of time each time it runs, although we would have to allow for variations in the overall server load.
However, what if we discovered cases where the duration was radically different? For example, we know the longest time it ran was about 15 seconds, but what if we found that sometimes this stored procedure only takes 1 second to run? This is important to know.
Assuming the trace is not large, one quick and dirty way to find out the 16 individual durations for each execution of ADGSP_PO_PurchasOrd stored procedure would be to search for the stored procedure name in the Profiler trace, using the "Find" command. For example, from the main menu, select Edit|Find, then type inADGSP_PO_PurchasOrd and have Profiler search the ObjectName Column, as shown in Figure 4-14:
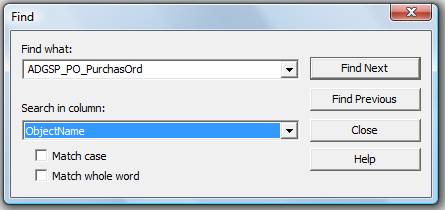
Figure 4-14: Use the Find option to search through your trace from within Profiler.
Having found the first instance of the stored procedure, note its Duration and then click "Find Next" until you have recorded each of the 16 durations for that stored procedure, as shown in Figure 4-15:
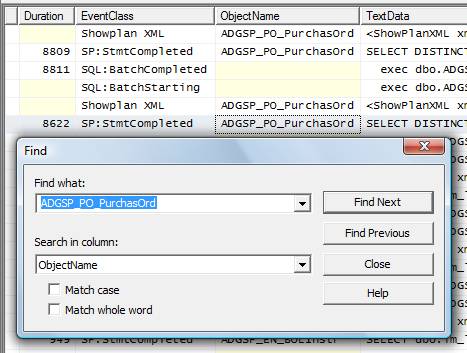
Figure 4-15: Use "Find Next" to continue searching through the trace.
In my example, I recorded 8901 milliseconds as the fastest time in which the stored procedure ran, and 15088 milliseconds as the slowest. This duration range, from 8901 through 15088, may or may not be significant. The only way to know for sure is to investigate further.
NOTE: As traces increase in size, using "Find" becomes more laborious. It is easier to create some Transact-SQL code yourself and run it against the trace data, stored in a database table, to identify the duration of each execution of the stored procedure.
The next step in the investigation is to compare the CPU, Reads, Writes, Transact-SQL code and the execution plans for the slowest and fastest durations, as shown in figure 4-16 and 4-17:
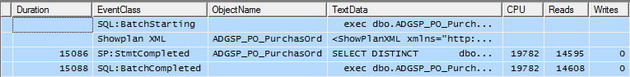
Figure 4-16: The four events that make up the longest-running instance of the stored procedure.
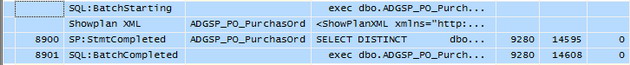
Figure 4-17: The four events that make up the shortest-running instance of the stored procedure.
The most obvious difference is in the CPU times. The CPU time for 8900-duration execution is about half the 15088-duration. So, how do we account for these differences in Duration and CPU, and are they significant?
Examining the data more closely, we see that the Reads in each case are identical. Though I am not showing all the screens here, the TextData columns for the SP:StmtCompleted event reveal the code executed to be identical in each case, as are the execution plans. Also, the same number of rows, 72,023, is returned each time (more on this shortly).
Given all this, it is fair to assume that the differences in Duration and CPU time are based on different server loads at the time of each execution, not on differences in the query, or how the query was executed.
NOTE: Another possible explanation why there was a difference in duration between different executions of the same query is that blocking may be affecting some executions of a query, but not other executions of the same query. In chapter 5 of the book, you would learn how to identify potential blocking issues.
Now, if we had seen differences in the code (different input parameters), a different execution plan, different numbers of logical Reads, and different numbers of rows returned, then our conclusion would be different. These observations would indicate that SQL Server is doing different work (using different resources) each time the stored procedure is run. This could mean that column or index statistics may not have been updated as they should, or perhaps they were updated between runs of the instances. It could mean that the parameters of the stored procedure affected the amount of work needed, and so on. In other words, we would need to investigate further the root cause of these differences.
In our simple case, however, we can assume these variations in duration are insignificant and can move on to our next step, which is evaluating the query for performance; we can also assume that the work we do for a single instance of the stored procedure will affect all other instances of its running in a similar way.
Tuning Slow Queries
Now that we have established that we need to tune our single stored procedure, what information does Profiler provide? For the most part, we have already talked about the most useful data, namely the Duration, CPU, Read and Writes columns, the actual code, and the execution plan. All this information is helpful in determining why a particular query may be slower than it needs to be.
In addition, one of the first things I look at is how many rows are returned by the query. You can obtain this data from the IntegerData column, as shown in Figure 4-18:
![]()
Figure 4-18: The IntegerData data column of the SP:StmtCompleted event shows you how many rows were actually returned by the query.
It is important to realize that the IntegerData column shows the actual number of rows returned by the query, while the execution plan, which we will look at next, only provides the estimated number of rows returned.
The next step is to figure out if the number of rows returned seems reasonable. Time and again, I see queries that return tens, or hundreds, of thousands of rows that aren't needed by the client application. So SQL Server has to do all this extra work returning unnecessary rows and then the client application filters out only the handful it really needs.
In this particular example, 72023 rows are returned. On the surface, this sounds like a high number. Rarely would you need to return this many rows to a client application; of course, there are always exceptions.
Nevertheless, this number of rows sets alarm bells ringing and I would investigate further the purpose of this query. In this particular case, the purpose of the stored procedure is to return all the line items for a single purchase order. I really doubt that there are any purchase orders that have 72023 rows of detailed information. Returning too much data tells me something very important: it tells me that the WHERE clause of the query is not well written, allowing too many rows to being returned and slowing the query.
When too many rows are being returned, you need to look at the WHERE clause of the query to see how it is written. Here's the WHERE clause for this stored procedure.
![]()
Figure 4-19: This is the entire WHERE clause for this query.
If you have any experience at all with writing queries, it is obvious that this WHERE clause has problems. It tells SQL Server to return all rows where the "in_buyc" column is not empty. This is not a very restrictive WHERE clause because it is based on a single column, and because it is essentially looking for an either/or condition. One way to improve the performance of this query would be to rewrite the WHERE clause so that is it more restrictive, so fewer rows are returned.
Another major problem is that the WHERE clause is non-sargeble. This means that it cannot make use of an index to find the data it needs to return. In other words, an index scan will be performed to return the data. While the specifics of how to write a sargeble WHERE clause is beyond the scope of this article, it is worth noting that any time you use a “not equals” in a WHERE clause, the query optimizer must review every record in the table to find out whether or not each row satisfies the not equals condition.
To support the conclusion that the WHERE clause is not sargeble, let's look at the graphical execution plan that is provided to us from the Profiler trace.
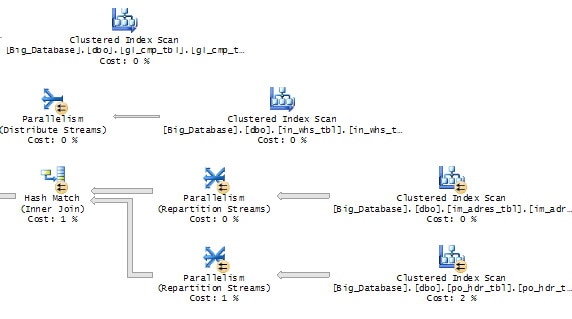
Figure 4-20: This is only a small portion of the entire execution plan for this query.
While figure 4-20 only shows part of the graphical execution plan, notice that there are four index scans occurring in this small portion of the query plan. Index scans occur when a clustered index has to be scanned, row by row, one row at a time, in order to identify the rows that need to be returned.
At this point, it may seem that analyzing why this query is performing slowly is complete. As usual, it depends. On one hand, we have barely looked at the code or the execution plan. There is still a lot of useful information that can be gleaned from it. How to do this is outside the scope of this article, as our goal here is to show you how to gather the data you need help you troubleshoot slow-performing queries, not to be able to analyze all of it. On the other hand, we have discovered two key pieces of information that, if acted on, could greatly speed up the query without doing any further analysis. First, we learned that too much data is being returned and that we need to make the WHERE clause more restrictive. Second, we learned that the current WHERE clause is non-sargeble, so we need to find a way to make it sargeble (assuming we can). With just these two pieces of data, we have a good start on what needs to be done to optimize the performance of this query.
Summary
Let's review what we have learned in this article.
- We learned how to create a trace that can be used to help identify slow-running queries.
- We learned how to take the results of our trace and analyze them in such a way that we can identify which queries are slow-running.
- We have learned that Profiler can provide us with a wealth of information about our slow-running queries that can be used to help troubleshoot and optimize them.
As you can see, while Profiler is a great tool for uncovering problems, it still requires knowledge and experience on the part of the DBA or developer to analyze its output. The more you practice, the better you will become.


 2085
2085

 被折叠的 条评论
为什么被折叠?
被折叠的 条评论
为什么被折叠?
 到【灌水乐园】发言


