


 该文介绍了一种在Vue应用中利用Echarts和从阿里云DataV获取的GeoJSON数据,创建省级地图并精确到市级的方法。通过注册地图、设置坐标和数据,实现了地图上的信息悬浮展示,并讨论了地图文件的压缩问题。
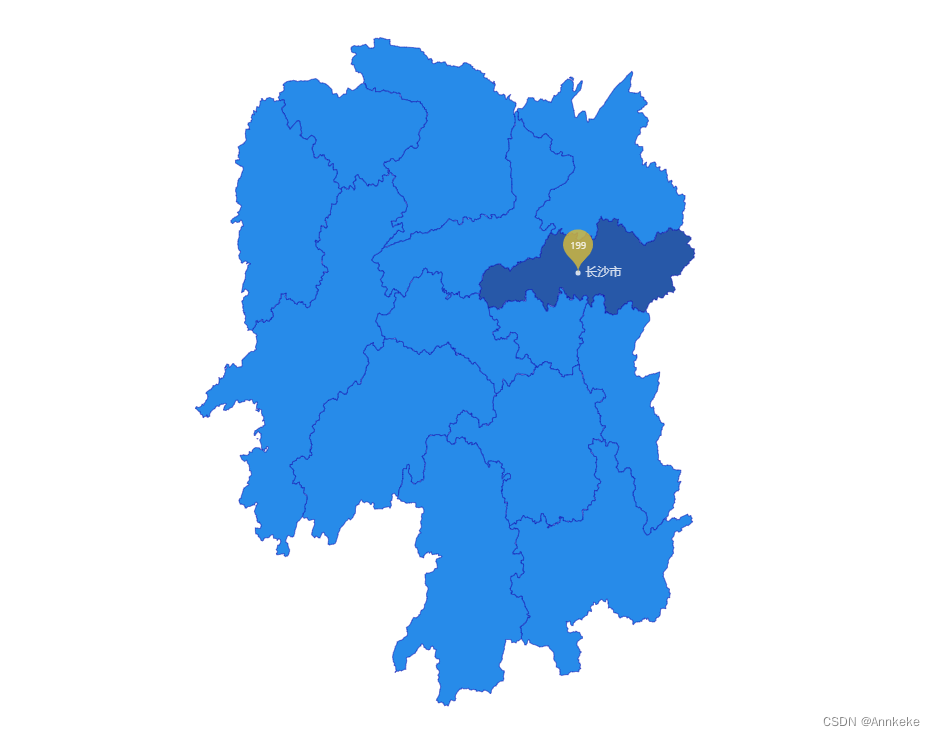
最近做的页面中需要展示省级地图精确到市级且悬浮到地区上时会显示一些信息
然后参考了网址:
首先我们要获取对应的区域的地图,可以在阿里云数据可视化平台获取地图文件:
我是选择了其它类型下的FeatureCollection类型然后直接下载到本地,在项目里面引入的
到vue里面实现代码的方式会和样例中有一些不同。
效果图类似:
<template>
<div :style="{height: scrollerHeight,width: scrollerWidth}" ref="charts"></div>
</template>
<script>
import * as echarts from "echarts";
import geoJson from './hunan.json' //地图包
export default {
data() {
return {
scrollerHeight: '100%',
scrollerWidth: '100%'
}
},
created() {
this.$nextTick(() => {
setTimeout(() => {
this.initCharts();
}, 600)
})
},
methods: {
initCharts() {
const myChart = echarts.init(this.$refs["charts"]);
myChart.showLoading();
echarts.registerMap('hunan', geoJson);
myChart.hideLoading();
var geoCoordMap = {
......
'娄底市':[111.014813,27.747083],
'湘西土家族苗族自治州':[109.186525,28.759389],
}
var data = [
.......
{name: '娄底市', value: 2},
{name: '湘西土家族苗族自治州', value: 2},
];
var convertData = function (data) {
var res = [];
for (var i = 0; i < data.length; i++) {
var geoCoord = geoCoordMap[data[i].name];
if (geoCoord) {
res.push({
name: data[i].name.length>=5 ? `${data[i].name.slice(0,5)}\n${data[i].name.slice(data[i].name.length - 5)}`: data[i].name,
value: geoCoord.concat(data[i].value)
});
}
}
return res;
};
const option = {
tooltip: {
trigger: 'item',
formatter: function (params) {
if(typeof(params.value)[2] == "undefined"){
return params.name + ' : ' + params.value;
}else{
return params.name + ' : ' + params.value[2];
}
}
},
legend: {
orient: 'vertical',
y: 'bottom',
x: 'right',
data: ['credit_pm2.5'],
textStyle: {
color: '#fff'
}
},
visualMap: {
show: false,
min: 0,
max: 500,
left: 'left',
// top: 'bottom',
top: 50,
bottom: 50,
text: ['高', '低'], // 文本,默认为数值文本
calculable: true,
seriesIndex: [1],
inRange: {
color: ['#74c856'] // 黑紫黑
}
},
geo: {
show: true,
map: 'hunan',
zoom: 1.24,
label: {
normal: {
show: false
},
emphasis: {
show: false,
}
},
roam: true,
itemStyle: {
normal: {
areaColor: '#74c856',
borderColor: '#f8b62b',
},
emphasis: {
areaColor: '#f8b62b',
}
}
},
series : [{
name: 'credit_pm2.5',
type: 'scatter',
coordinateSystem: 'geo',
data: convertData(data),
// symbolSize: 5,
symbolSize: 1,
label: {
normal: {
formatter: '{b}',
position: 'right',
show: true
},
emphasis: {
show: true
}
},
itemStyle: {
normal: {
color: '#fff'
}
}
},
{
type: 'map',
map: 'hunan',
geoIndex: 0,
// aspectScale: 0.75, //长宽比
aspectScale: 1.1, //长宽比
showLegendSymbol: false, // 存在legend时显示
label: {
normal: {
show: false
},
emphasis: {
show: false,
textStyle: {
color: '#fff'
}
}
},
roam: true,
itemStyle: {
normal: {
areaColor: '#031525',
borderColor: '#3B5077',
},
emphasis: {
areaColor: '#2B91B7'
}
},
animation: false,
data: data
},
// {
// name: '点',
// type: 'scatter',
// coordinateSystem: 'geo',
// symbol: 'pin',
// symbolSize: [50,50],
// label: {
// normal: {
// show: true,
// textStyle: {
// color: '#fff',
// fontSize: 9,
// },
// formatter (value){
// return value.data.value[2]
// }
// }
// },
// itemStyle: {
// normal: {
// color: '#6cb3e4', //标志颜色
// }
// },
// zlevel: 6,
// data: convertData(data),
// }
]
};
myChart.setOption(option);
},
}
}
</script>
直接贴出了用到的代码,希望可以提供帮助。
但是实现的时候发现了一个问题平台下载下来的地图文件是有一百多kb的有点大。我们可以尝试使用某些方式来压缩来避免一些可能的问题。


 1万+
1万+

 被折叠的 条评论
为什么被折叠?
被折叠的 条评论
为什么被折叠?
 到【灌水乐园】发言


