option = {
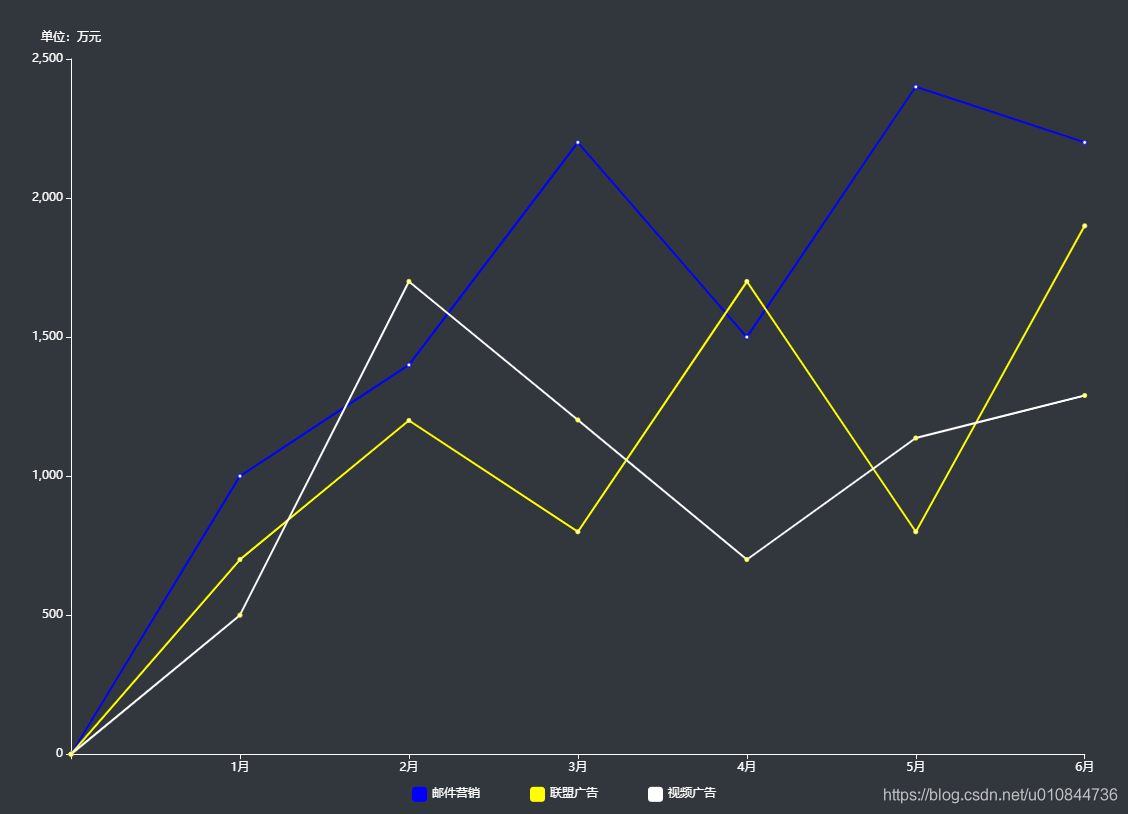
backgroundColor: "#32373e",
color:['blue','yellow','','#11fef6'],
tooltip: {
trigger: 'axis'
},
legend: {
bottom: '1%',
textStyle: {
color: 'white'
},
icon: "roundRect",
itemGap: 50,
itemWidth: 15,
itemHeight: 15,
data: ['邮件营销', '联盟广告', '视频广告']
},
grid: {
left: '3%',
right: '4%',
bottom: '5%',
containLabel: true
},
xAxis: {
type: 'category',
boundaryGap: false,
axisLine: {
show: true,
lineStyle: {
color: 'white'
}
},
data: ["", '1月', '2月', '3月', '4月', '5月', '6月']
},
yAxis: {
type: 'value',
name: "单位:万元",
splitArea: {
show: false
},
splitLine: {
show: false
},
axisLine: {
show: true,
lineStyle: {
color: 'white'
}
},
},
series: [
{
name: '邮件营销',
type: 'line',
data: [0,1000, 1400, 2200, 1500, 2400, 2200]
},
{
name: '联盟广告',
type: 'line',
data: [0,700, 1200, 800, 1700, 800, 1900]
},
{
name: '视频广告',
type: 'line',
data: [0,500, 1700, 1202, 700, 1137, 1290]
}
]
};


 1万+
1万+


 被折叠的 条评论
为什么被折叠?
被折叠的 条评论
为什么被折叠?
 到【灌水乐园】发言


