


Create a multicolored line with markers at each vertex. Interpolate the colors and use a colorbar to show how the values map to the colormap.
Create the data. Set the last entry of y to NaN so that patch creates a line instead of a closed polygon. Define a color for each vertex using the y values. The values in c map to colors in the colormap.
x = linspace(1,10,15);
y = sin(x);
y(end) = NaN;
c = y;
Create the line. Show markers at each vertex and set the EdgeColor to 'interp' to interpolate the colors between vertices. Add a colorbar.
figure
patch(x,y,c,'EdgeColor','interp','Marker','o','MarkerFaceColor','flat');
colorbar;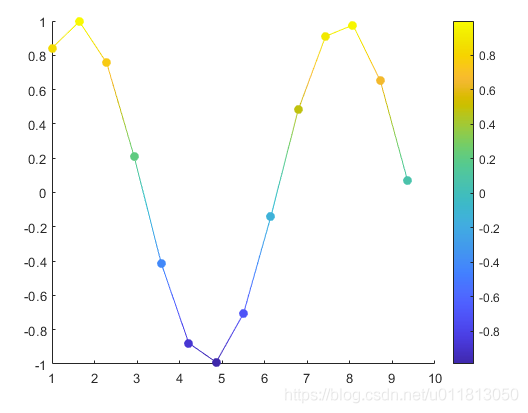


 132
132


 被折叠的 条评论
为什么被折叠?
被折叠的 条评论
为什么被折叠?
 到【灌水乐园】发言


