


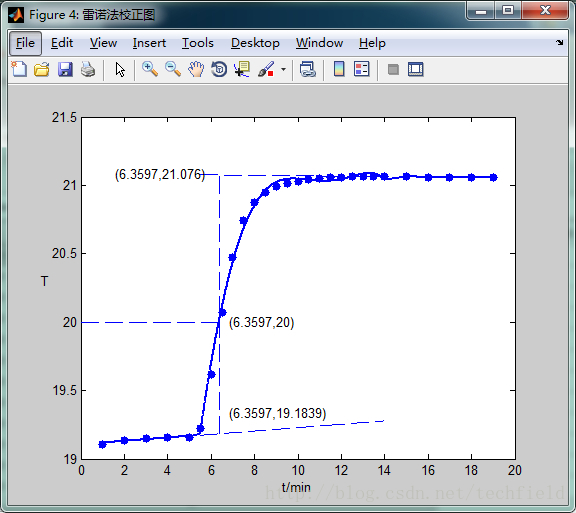
思路是,最前面五个点和最后面五个点都用线性拟合,中间的点用多项式。
作代表室温的水平线交曲线部分得坐标,将横坐标代入两个直线方程即可得相应的y,差值就出来了,也就是把温度差算出来了。
输出的图像好多锯齿啊。。。点取得再多都没用。。。找了找发现运行时这样没问题,只要保存时存为eps就行~
最后效果如图:
代码(数据中一列为时间,一列为温度,分别改名time,T即可调用脚本得到结果):
%% Data process
TFirst5=T(1:5);
timeFirst5=time(1:5);
TLast5=T(end-4:end);
timeLast5=time(end-4:end);
TMedium=T(6:end-5);
timeMedium=time(6:end-5);
%% Fitting
[fitresultFirst5, gofFirst5]=createFit1(timeFirst5, TFirst5);
[fitresultMedium, gofMedium] = createFit3(timeMedium, TMedium);
%fit时如果选了center and scale,直接使用算出的系数会不正常
[fitresultLast5, gofLast5]=createFit1(timeLast5, TLast5);
%% Calculate the deltaY
y=20.0;%室温
x=fzero(@(x)y-(fitresultMedium.p1*x^5 + fitresultMedium.p2*x^4+...
    fitresultMedium.p3*x^3 + fitresultMedium.p4*x^2 +...
    fitresultMedium.p5*x + fitresultMedium.p6),6);
interPoint=x;
interPointy=y;
deltaY=fitresultLast5.p1*x+fitresultLast5.p2-(fitresultFirst5.p1*x+fitresultFirst5.p2);
disp(['温差为: ',num2str(deltaY)]);
%% draw the result
t=[time(1):0.01:time(5),time(6):0.01:time(end-5),time(end-4):0.01:time(end)];
x=time(6):0.01:time(end-5);
xFirst=time(1):0.01:time(5);
xLast=time(end-4):0.01:time(end);
y1=fitresultFirst5.p1*xFirst+fitresultFirst5.p2;
y2=fitresultMedium.p1*x.^5 + fitresultMedium.p2*x.^4+...
    fitresultMedium.p3*x.^3 + fitresultMedium.p4*x.^2 +...
    fitresultMedium.p5*x + fitresultMedium.p6;
y3=fitresultLast5.p1*xLast+fitresultLast5.p2;
y=[y1,y2,y3];%不这样分列就出现元素增加的情况。。。。不知道是什么原因。。。。
figure( 'Name', '雷诺法校正图' );
h = plot(t,y,'LineWidth',2);
xlabel('t/min');
ylabel('T','Rotation',0);
% grid on
hold on
plot(x,fitresultFirst5.p1*x+fitresultFirst5.p2,'--');
plot(x,fitresultLast5.p1*x+fitresultLast5.p2,'--');
plot([0,interPoint],[interPointy,interPointy],'--');
plot([interPoint,interPoint],[fitresultFirst5.p1*interPoint+fitresultFirst5.p2,fitresultLast5.p1*interPoint+fitresultLast5.p2],'--');
plot(time,T,'.b','MarkerSize',18)

text(interPoint+0.5,interPointy,['(',num2str(interPoint),',',num2str(20.0),')']);
text(interPoint+0.5,fitresultFirst5.p1*interPoint+fitresultFirst5.p2+0.15,...
    ['(',num2str(interPoint),',',num2str(fitresultFirst5.p1*interPoint+fitresultFirst5.p2),')']);
text(interPoint-4.75,fitresultLast5.p1*interPoint+fitresultLast5.p2,...
    ['(',num2str(interPoint),',',num2str(fitresultLast5.p1*interPoint+fitresultLast5.p2),')']);
1	19.522
2	19.552
3	19.562
4	19.567
5	19.57
5.5	19.64
6	20.221
6.5	20.852
7	21.184
7.5	21.339
8	21.422
8.5	21.473
9	21.503
9.5	21.525
10	21.539
10.5	21.548
11	21.555
11.5	21.559
12	21.561
12.5	21.563
13	21.563
13.5	21.563
14.5	21.562
15.5	21.559
16.5	21.556
17.5	21.553
18.5	21.55
参考资料:
人人网- 日志分享 物化实验答案
http://blog.renren.com/share/262469705/3502647736
人人网- 日志分享 物化实验思考题答案
http://blog.renren.com/share/267864049/5535201961
如何用matlab求用ployfit拟合的两条曲线的交点_百度知道
http://zhidao.baidu.com/question/409120840.html?qbl=relate_question_0&word=Matlab%C7%F3%C4%E2%BA%CF%C7%FA%CF%DF%BD%BB%B5%E3
matlab画图如何消除锯齿? - MATLAB 图像处理与计算机视觉 - MATLAB中文论坛 - Powered by Discuz!
http://www.ilovematlab.cn/thread-54619-1-1.html
Matlab默认画的图怎么这么难看(如何消除锯齿) - 开源中国社区
http://www.oschina.net/question/817257_90911?sort=default&p=2#answers
matlab怎样标记两条拟合曲线的交点以及怎样直接显示其交点坐标的值,哪位高手详细指点下,谢谢_百度知道
http://zhidao.baidu.com/question/560524055.html?qbl=relate_question_2&word=Matlab%C7%F3%C4%E2%BA%CF%C7%FA%CF%DF%BD%BB%B5%E3
如何用matlab求用ployfit拟合的两条曲线的交点_百度知道
http://zhidao.baidu.com/question/409120840.html?qbl=relate_question_0&word=Matlab%C7%F3%C4%E2%BA%CF%C7%FA%CF%DF%BD%BB%B5%E3
雷诺校正图形的优化处理方法_百度文库
http://wenku.baidu.com/link?url=iu485CTU45uj_W0AorLHMqpwq6STXuFSdVLpcHtmlorb12354vGWVI7wZ2wgbnizrNgEqF_Q-Hww9ximD3a1XYrHUh6k-b49LM7R2OpKBUK
物化实验思考题答案全集_考试前很有用 - 豆丁网
http://www.docin.com/p-424016940.html


 2345
2345


 被折叠的 条评论
为什么被折叠?
被折叠的 条评论
为什么被折叠?
 到【灌水乐园】发言


