


Android绘图机制(四)——使用HelloCharts开源框架搭建一系列炫酷图表,柱形图,折线图,饼状图和动画特效,抽丝剥茧带你认识图表之美
这里为什么不继续把自定义View写下去呢,因为最近项目很急,个人能力也有限,所以就在网上找到一些开源的框架使用,不是MPAndroidChart,也不是AChartEngine ,而是HelloCharts
开源地 址:https://github.com/lecho/hellocharts-android
这次主要是翻译了一些注释和简化了一下项目的结构,我也是照着开源项目来的,但是我相信你看完本篇,也是可以直接把项目拿过来用的,最好是使用我提供的的Demo,这样就跟本文一一对照了,我们一步步来
首先我们来看看官方的
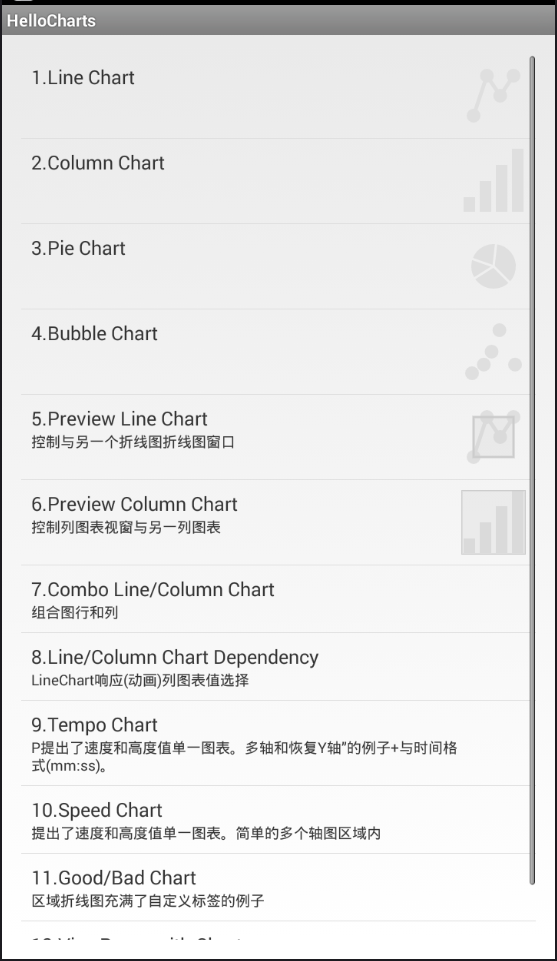
一.官方截图
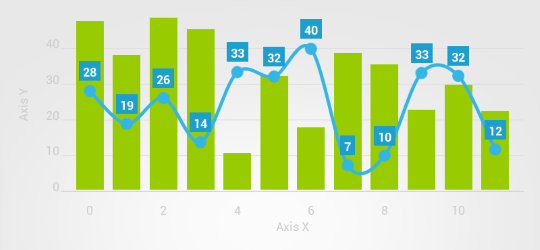
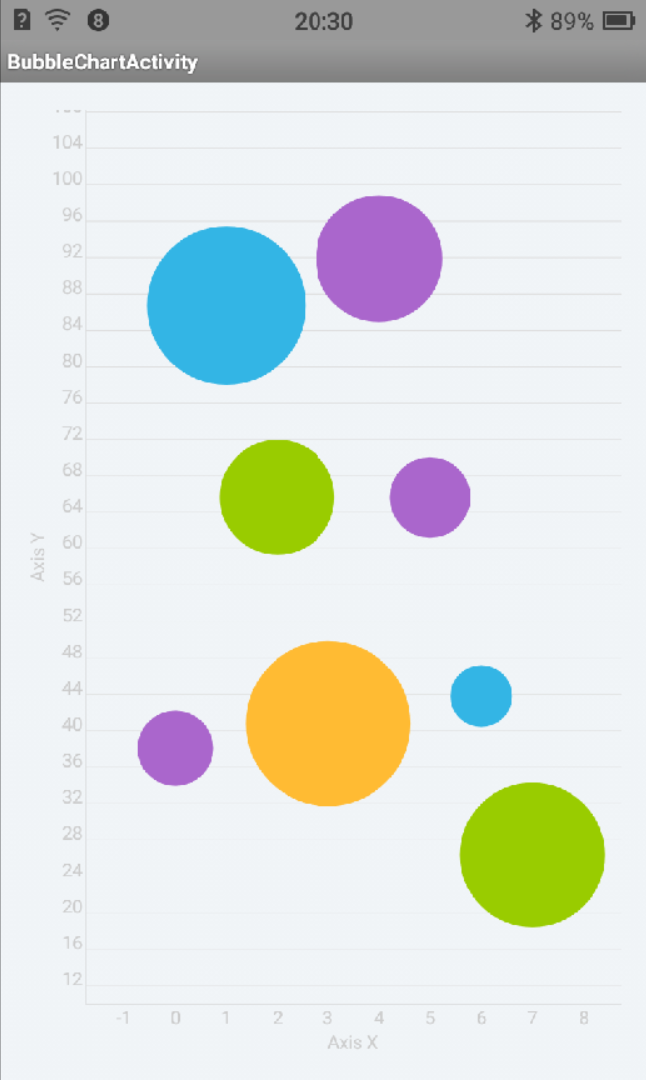
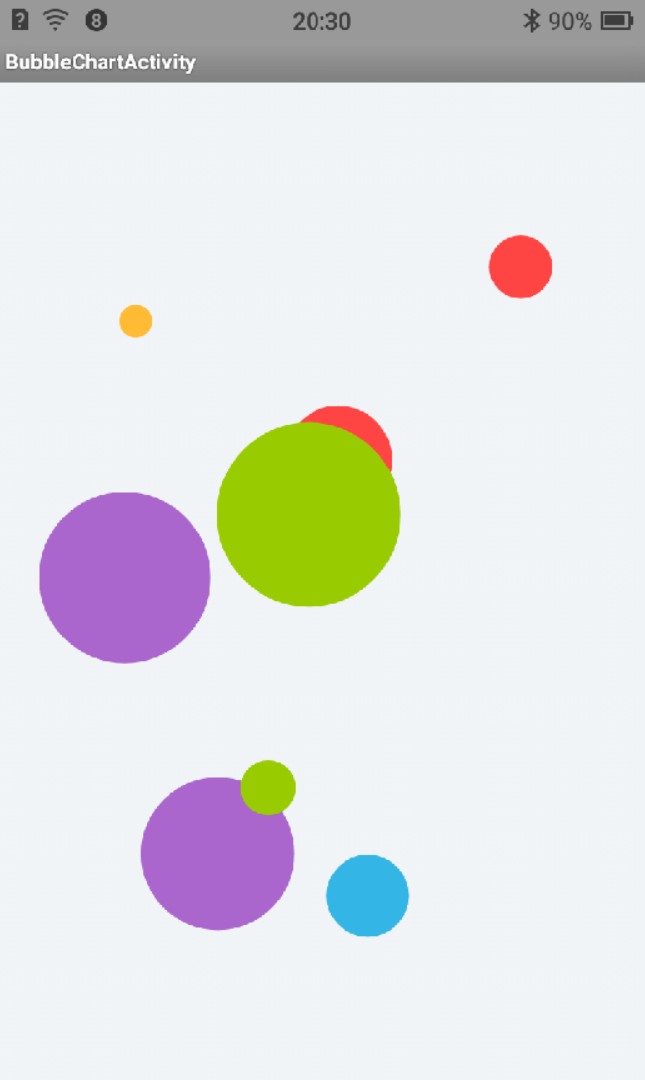
1.Bubble Chart

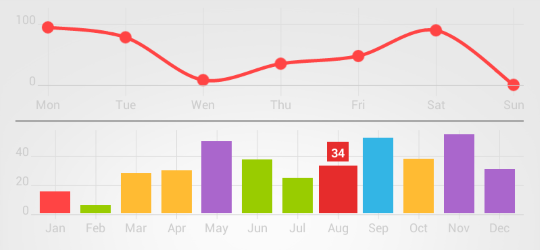
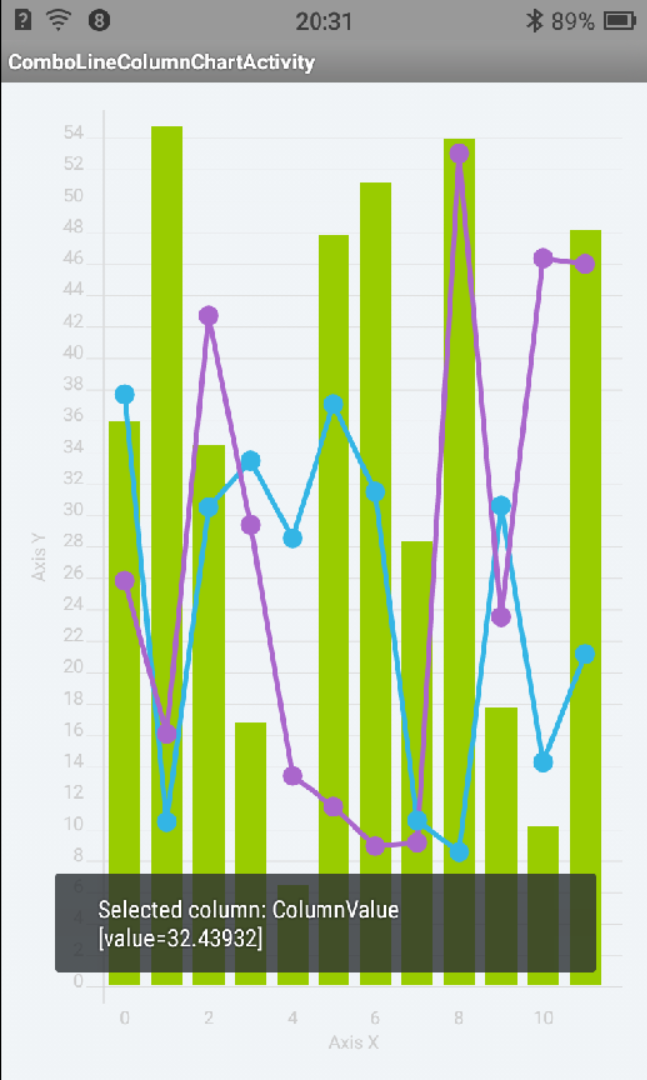
2.Combo Chart
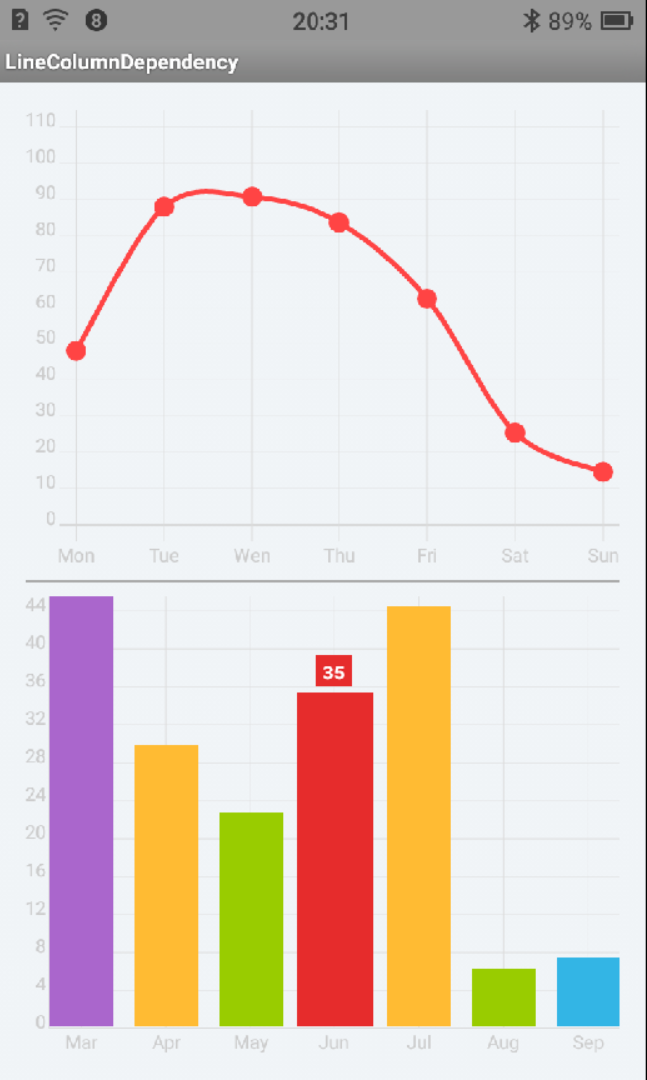
3.Line Column Dependency
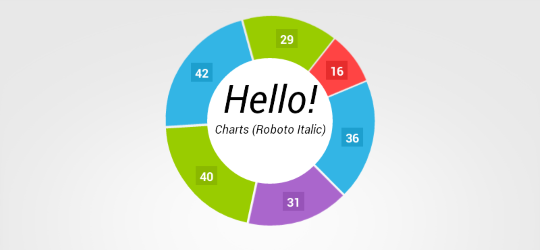
4.Pie Chart
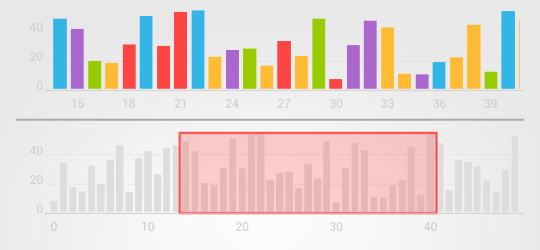
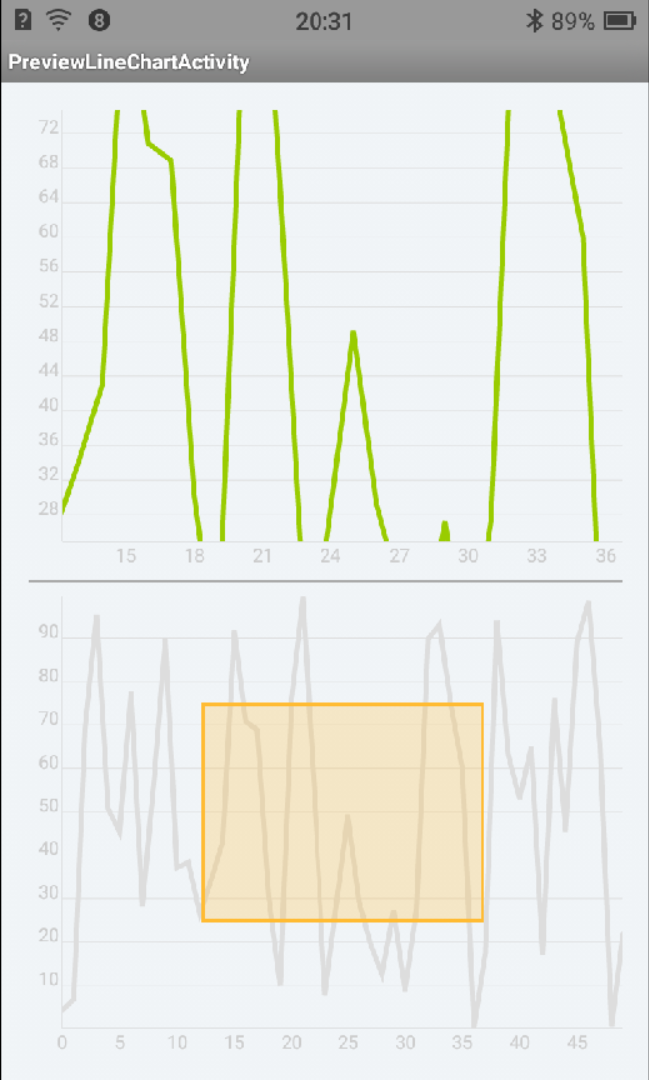
5.Preview Column Chart
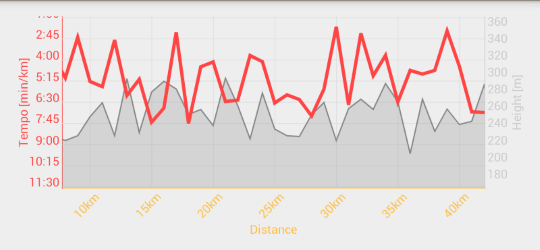
6.Tempo line chart
二.项目架构
这里我们首先来看一下我排版的思维导图
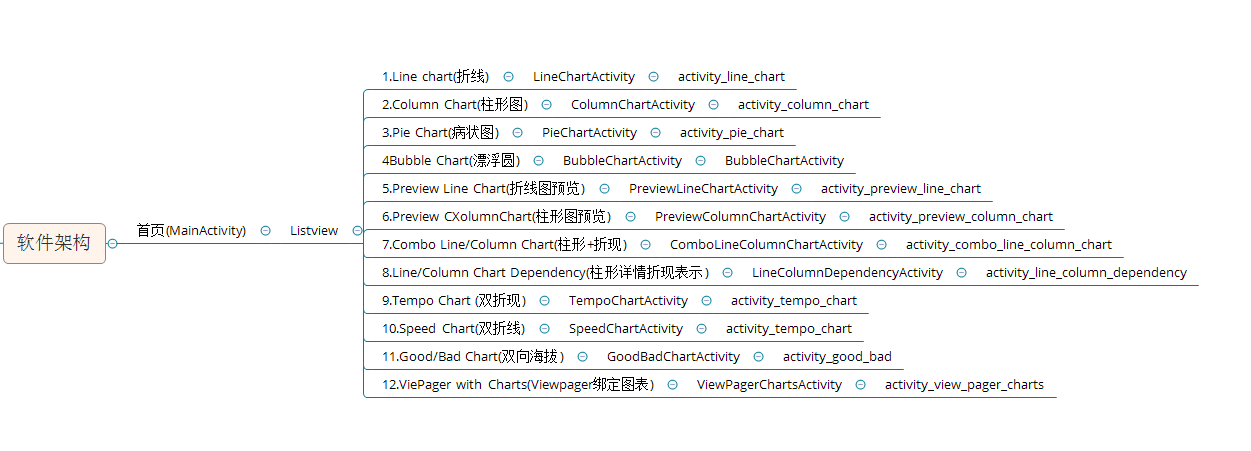
上面比较明确的说明了,首先我们主页是一个ListView
然后跳转一个Activity
@Override
        public void onItemClick(AdapterView<?> adapter, View view,
                int position, long id) {
            Intent intent;

            switch (position) {
            case 0:
                // Line Chart;
                intent = new Intent(getActivity(), LineChartActivity.class);
                startActivity(intent);
                break;
            case 1:
                // Column Chart;
                intent = new Intent(getActivity(), ColumnChartActivity.class);
                startActivity(intent);
                break;
            case 2:
                // Pie Chart;
                intent = new Intent(getActivity(), PieChartActivity.class);
                startActivity(intent);
                break;
            case 3:
                // Bubble Chart;
                intent = new Intent(getActivity(), BubbleChartActivity.class);
                startActivity(intent);
                break;
            case 4:
                // Preview Line Chart;
                intent = new Intent(getActivity(),
                        PreviewLineChartActivity.class);
                startActivity(intent);
                break;
            case 5:
                // Preview Column Chart;
                intent = new Intent(getActivity(),
                        PreviewColumnChartActivity.class);
                startActivity(intent);
                break;
            case 6:
                // Combo Chart;
                intent = new Intent(getActivity(),
                        ComboLineColumnChartActivity.class);
                startActivity(intent);
                break;
            case 7:
                // Line Column Dependency;
                intent = new Intent(getActivity(),
                        LineColumnDependencyActivity.class);
                startActivity(intent);
                break;
            case 8:
                // Tempo line chart;
                intent = new Intent(getActivity(), TempoChartActivity.class);
                startActivity(intent);
                break;
            case 9:
                // Speed line chart;
                intent = new Intent(getActivity(), SpeedChartActivity.class);
                startActivity(intent);
                break;
            case 10:
                // Good Bad filled line chart;
                intent = new Intent(getActivity(), GoodBadChartActivity.class);
                startActivity(intent);
                break;
            case 11:
                // Good Bad filled line chart;
                intent = new Intent(getActivity(),
                        ViewPagerChartsActivity.class);
                startActivity(intent);
                break;
            default:
                break;
            }
        }
- 1
- 2
- 3
- 4
- 5
- 6
- 7
- 8
- 9
- 10
- 11
- 12
- 13
- 14
- 15
- 16
- 17
- 18
- 19
- 20
- 21
- 22
- 23
- 24
- 25
- 26
- 27
- 28
- 29
- 30
- 31
- 32
- 33
- 34
- 35
- 36
- 37
- 38
- 39
- 40
- 41
- 42
- 43
- 44
- 45
- 46
- 47
- 48
- 49
- 50
- 51
- 52
- 53
- 54
- 55
- 56
- 57
- 58
- 59
- 60
- 61
- 62
- 63
- 64
- 65
- 66
- 67
- 68
- 69
- 70
- 71
- 72
- 73
- 74
- 75
Activity继承的是FragmentActivity,我们在FragmentActivity内部编写一个Fragment这样就可以绑定主Activity而不用继承自View去多写一个类了
public static class PlaceholderFragment extends Fragment
- 1
所以你看到的项目也是非常简洁的
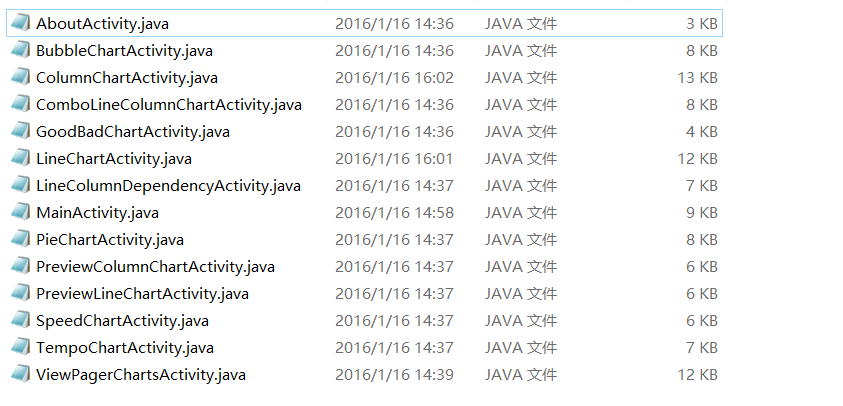
项目只有一个主Activity——MainActivity和一个关于软件的AboutActivity,然后就是十二个对应的类了
好了,我们可以编写了
三,实现图标
1.折线图
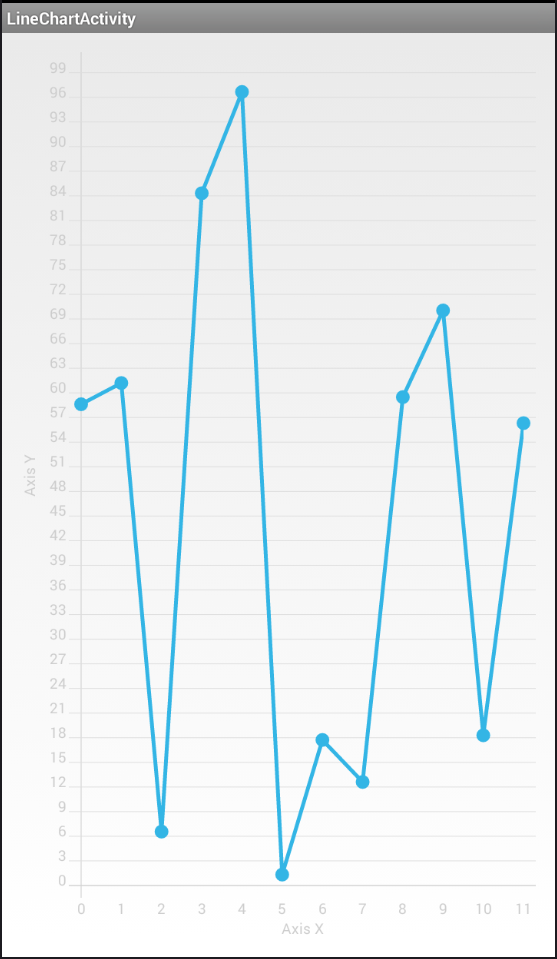
简单的实现折线图是可以的,这里多了几个注意的地方
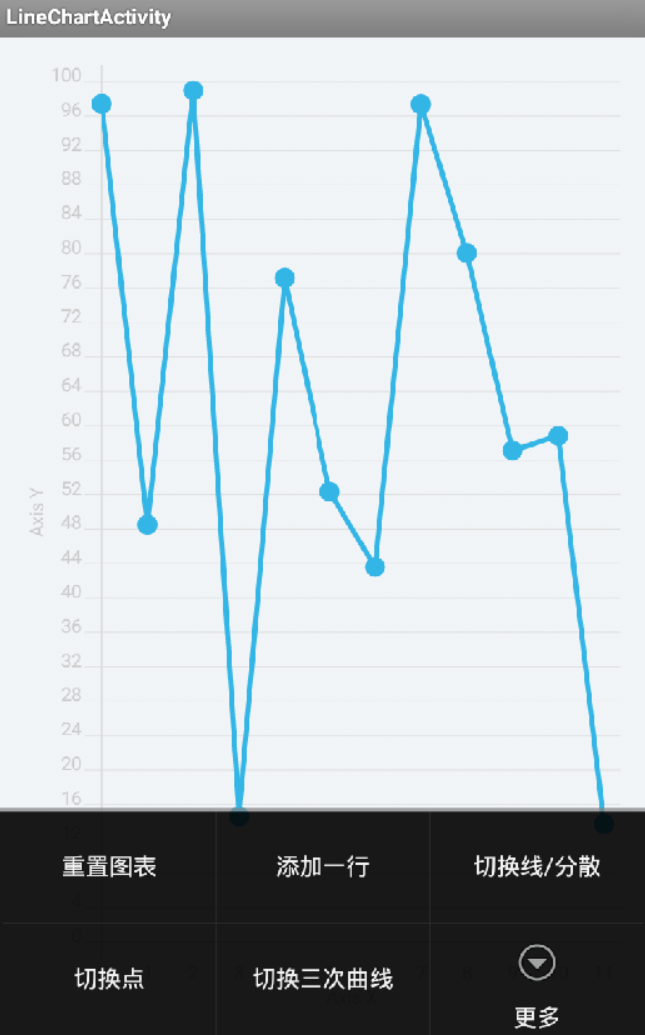
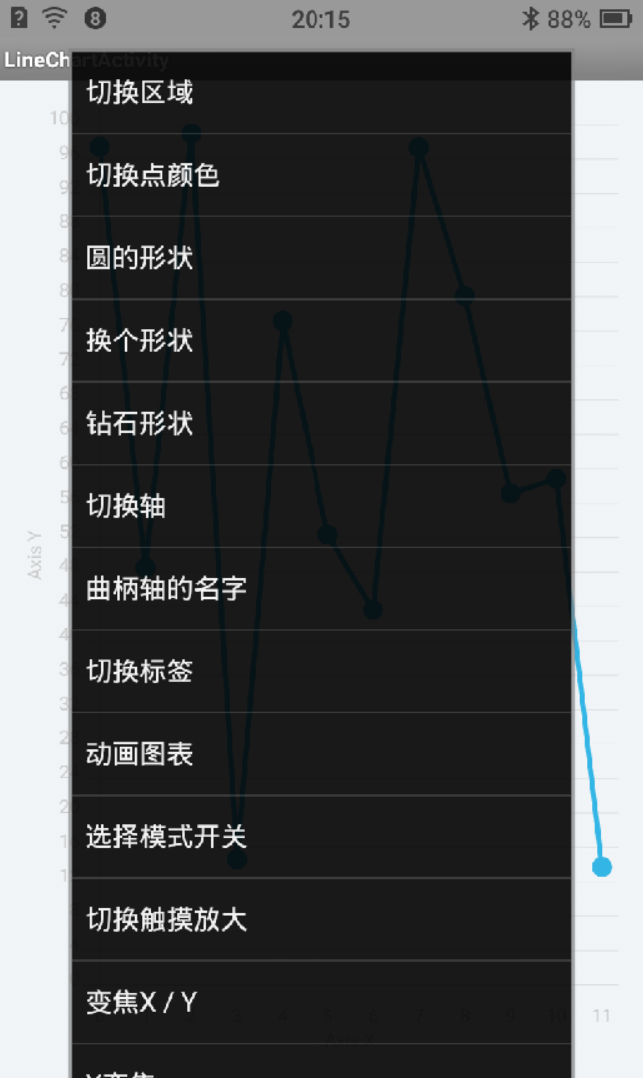
从这里我们就可以看出,其实图表操作主要还是看menu菜单,所以,我们先实现
我们fragment要绑定的布局
fragment_line_chart
<lecho.lib.hellocharts.view.LineChartView
        android:id="@+id/chart"
        android:layout_width="match_parent"
        android:layout_height="match_parent" >
    </lecho.lib.hellocharts.view.LineChartView>
- 1
- 2
- 3
- 4
- 5
LineChartActivity
package lecho.lib.hellocharts.samples;

import java.util.ArrayList;
import java.util.List;

import lecho.lib.hellocharts.animation.ChartAnimationListener;
import lecho.lib.hellocharts.gesture.ZoomType;
import lecho.lib.hellocharts.listener.LineChartOnValueSelectListener;
import lecho.lib.hellocharts.model.Axis;
import lecho.lib.hellocharts.model.Line;
import lecho.lib.hellocharts.model.LineChartData;
import lecho.lib.hellocharts.model.PointValue;
import lecho.lib.hellocharts.model.ValueShape;
import lecho.lib.hellocharts.model.Viewport;
import lecho.lib.hellocharts.util.ChartUtils;
import lecho.lib.hellocharts.view.Chart;
import lecho.lib.hellocharts.view.LineChartView;
import android.os.Bundle;
import android.support.v4.app.Fragment;
import android.support.v4.app.FragmentActivity;
import android.view.LayoutInflater;
import android.view.Menu;
import android.view.MenuInflater;
import android.view.MenuItem;
import android.view.View;
import android.view.ViewGroup;
import android.widget.Toast;

public class LineChartActivity extends FragmentActivity {

    @Override
    protected void onCreate(Bundle savedInstanceState) {
        super.onCreate(savedInstanceState);
        setContentView(R.layout.activity_line_chart);
        if (savedInstanceState == null) {
            getSupportFragmentManager().beginTransaction()
                    .add(R.id.container, new PlaceholderFragment()).commit();
        }
    }

    /**
     * A fragment containing a line chart.
     */
    public static class PlaceholderFragment extends Fragment {

        private LineChartView chart;
        private LineChartData data;
        private int numberOfLines = 1;
        private int maxNumberOfLines = 4;
        private int numberOfPoints = 12;

        float[][] randomNumbersTab = new float[maxNumberOfLines][numberOfPoints];

        private boolean hasAxes = true;
        private boolean hasAxesNames = true;
        private boolean hasLines = true;
        private boolean hasPoints = true;
        private ValueShape shape = ValueShape.CIRCLE;
        private boolean isFilled = false;
        private boolean hasLabels = false;
        private boolean isCubic = false;
        private boolean hasLabelForSelected = false;
        private boolean pointsHaveDifferentColor;

        public PlaceholderFragment() {
        }

        @Override
        public View onCreateView(LayoutInflater inflater, ViewGroup container,
                Bundle savedInstanceState) {
            setHasOptionsMenu(true);
            View rootView = inflater.inflate(R.layout.fragment_line_chart,
                    container, false);

            chart = (LineChartView) rootView.findViewById(R.id.chart);
            chart.setOnValueTouchListener(new ValueTouchListener());

            // Generate some randome values.
            generateValues();

            generateData();

            // Disable viewpirt recalculations, see toggleCubic() method for
            // more info.
            chart.setViewportCalculationEnabled(false);

            resetViewport();

            return rootView;
        }

        // MENU
        @Override
        public void onCreateOptionsMenu(Menu menu, MenuInflater inflater) {
            inflater.inflate(R.menu.line_chart, menu);
        }

    //menu的操作
        @Override
        public boolean onOptionsItemSelected(MenuItem item) {
            int id = item.getItemId();
            if (id == R.id.action_reset) {
                reset();
                generateData();
                return true;
            }
            if (id == R.id.action_add_line) {
                addLineToData();
                return true;
            }
            if (id == R.id.action_toggle_lines) {
                toggleLines();
                return true;
            }
            if (id == R.id.action_toggle_points) {
                togglePoints();
                return true;
            }
            if (id == R.id.action_toggle_cubic) {
                toggleCubic();
                return true;
            }
            if (id == R.id.action_toggle_area) {
                toggleFilled();
                return true;
            }
            if (id == R.id.action_point_color) {
                togglePointColor();
                return true;
            }
            if (id == R.id.action_shape_circles) {
                setCircles();
                return true;
            }
            if (id == R.id.action_shape_square) {
                setSquares();
                return true;
            }
            if (id == R.id.action_shape_diamond) {
                setDiamonds();
                return true;
            }
            if (id == R.id.action_toggle_labels) {
                toggleLabels();
                return true;
            }
            if (id == R.id.action_toggle_axes) {
                toggleAxes();
                return true;
            }
            if (id == R.id.action_toggle_axes_names) {
                toggleAxesNames();
                return true;
            }
            if (id == R.id.action_animate) {
                prepareDataAnimation();
                chart.startDataAnimation();
                return true;
            }
            if (id == R.id.action_toggle_selection_mode) {
                toggleLabelForSelected();

                Toast.makeText(
                        getActivity(),
                        "Selection mode set to "
                                + chart.isValueSelectionEnabled()
                                + " select any point.", Toast.LENGTH_SHORT)
                        .show();
                return true;
            }
            if (id == R.id.action_toggle_touch_zoom) {
                chart.setZoomEnabled(!chart.isZoomEnabled());
                Toast.makeText(getActivity(),
                        "IsZoomEnabled " + chart.isZoomEnabled(),
                        Toast.LENGTH_SHORT).show();
                return true;
            }
            if (id == R.id.action_zoom_both) {
                chart.setZoomType(ZoomType.HORIZONTAL_AND_VERTICAL);
                return true;
            }
            if (id == R.id.action_zoom_horizontal) {
                chart.setZoomType(ZoomType.HORIZONTAL);
                return true;
            }
            if (id == R.id.action_zoom_vertical) {
                chart.setZoomType(ZoomType.VERTICAL);
                return true;
            }
            return super.onOptionsItemSelected(item);
        }

        private void generateValues() {
            for (int i = 0; i < maxNumberOfLines; ++i) {
                for (int j = 0; j < numberOfPoints; ++j) {
                    randomNumbersTab[i][j] = (float) Math.random() * 100f;
                }
            }
        }

        private void reset() {
            numberOfLines = 1;

            hasAxes = true;
            hasAxesNames = true;
            hasLines = true;
            hasPoints = true;
            shape = ValueShape.CIRCLE;
            isFilled = false;
            hasLabels = false;
            isCubic = false;
            hasLabelForSelected = false;
            pointsHaveDifferentColor = false;

            chart.setValueSelectionEnabled(hasLabelForSelected);
            resetViewport();
        }

        private void resetViewport() {
            // Reset viewport height range to (0,100)
            final Viewport v = new Viewport(chart.getMaximumViewport());
            v.bottom = 0;
            v.top = 100;
            v.left = 0;
            v.right = numberOfPoints - 1;
            chart.setMaximumViewport(v);
            chart.setCurrentViewport(v);
        }

        private void generateData() {

            List<Line> lines = new ArrayList<Line>();
            for (int i = 0; i < numberOfLines; ++i) {

                List<PointValue> values = new ArrayList<PointValue>();
                for (int j = 0; j < numberOfPoints; ++j) {
                    values.add(new PointValue(j, randomNumbersTab[i][j]));
                }

                Line line = new Line(values);
                line.setColor(ChartUtils.COLORS[i]);
                line.setShape(shape);
                line.setCubic(isCubic);
                line.setFilled(isFilled);
                line.setHasLabels(hasLabels);
                line.setHasLabelsOnlyForSelected(hasLabelForSelected);
                line.setHasLines(hasLines);
                line.setHasPoints(hasPoints);
                if (pointsHaveDifferentColor) {
                    line.setPointColor(ChartUtils.COLORS[(i + 1)
                            % ChartUtils.COLORS.length]);
                }
                lines.add(line);
            }

            data = new LineChartData(lines);

            if (hasAxes) {
                Axis axisX = new Axis();
                Axis axisY = new Axis().setHasLines(true);
                if (hasAxesNames) {
                    axisX.setName("Axis X");
                    axisY.setName("Axis Y");
                }
                data.setAxisXBottom(axisX);
                data.setAxisYLeft(axisY);
            } else {
                data.setAxisXBottom(null);
                data.setAxisYLeft(null);
            }

            data.setBaseValue(Float.NEGATIVE_INFINITY);
            chart.setLineChartData(data);

        }

        /**
         * Adds lines to data, after that data should be set again with
         * {@link LineChartView#setLineChartData(LineChartData)}. Last 4th line
         * has non-monotonically x values.
         */
        private void addLineToData() {
            if (data.getLines().size() >= maxNumberOfLines) {
                Toast.makeText(getActivity(), "Samples app uses max 4 lines!",
                        Toast.LENGTH_SHORT).show();
                return;
            } else {
                ++numberOfLines;
            }

            generateData();
        }

        private void toggleLines() {
            hasLines = !hasLines;

            generateData();
        }

        private void togglePoints() {
            hasPoints = !hasPoints;

            generateData();
        }

        private void toggleCubic() {
            isCubic = !isCubic;

            generateData();

            if (isCubic) {
                /**
                 * 手动设置高一点最大立方行,因为有时超过或低于最大值/最小值。为此使用Viewport.inest()
                 * 方法并传递负值作为dy参数或手动设置顶部和底部的值
                 * 。在这个例子中我知道Y值(0100)范围内我手动设置视口高度范围(105)
                 * 。让这个作品在动画应该使用Chart.setViewportCalculationEnabled
                 * (false)之前修改窗口。记住你叫setLineChartData后设置窗口()。
                 */
                final Viewport v = new Viewport(chart.getMaximumViewport());
                v.bottom = -5;
                v.top = 105;
                // You have to set max and current viewports separately.
                chart.setMaximumViewport(v);
                // I changing current viewport with animation in this case.
                chart.setCurrentViewportWithAnimation(v);
            } else {
                // If not cubic restore viewport to (0,100) range.
                final Viewport v = new Viewport(chart.getMaximumViewport());
                v.bottom = 0;
                v.top = 100;

                /**
                 * 你必须单独设置最大和当前视窗。在这种情况下,如果我想要动画我必须先设置currentviewport和使用动画侦听器。
                 * 最大视窗将onAnimationFinished方法。
                 */
                chart.setViewportAnimationListener(new ChartAnimationListener() {

                    @Override
                    public void onAnimationStarted() {
                        // TODO Auto-generated method stub

                    }

                    @Override
                    public void onAnimationFinished() {
                        // 设置最大viewpirt和删除侦听器。
                        chart.setMaximumViewport(v);
                        chart.setViewportAnimationListener(null);

                    }
                });
                // 设置当前viewpirt动画;
                chart.setCurrentViewportWithAnimation(v);
            }

        }

        private void toggleFilled() {
            isFilled = !isFilled;

            generateData();
        }

        private void togglePointColor() {
            pointsHaveDifferentColor = !pointsHaveDifferentColor;

            generateData();
        }

        private void setCircles() {
            shape = ValueShape.CIRCLE;

            generateData();
        }

        private void setSquares() {
            shape = ValueShape.SQUARE;

            generateData();
        }

        private void setDiamonds() {
            shape = ValueShape.DIAMOND;

            generateData();
        }

        private void toggleLabels() {
            hasLabels = !hasLabels;

            if (hasLabels) {
                hasLabelForSelected = false;
                chart.setValueSelectionEnabled(hasLabelForSelected);
            }

            generateData();
        }

        private void toggleLabelForSelected() {
            hasLabelForSelected = !hasLabelForSelected;

            chart.setValueSelectionEnabled(hasLabelForSelected);

            if (hasLabelForSelected) {
                hasLabels = false;
            }

            generateData();
        }

        private void toggleAxes() {
            hasAxes = !hasAxes;

            generateData();
        }

        private void toggleAxesNames() {
            hasAxesNames = !hasAxesNames;

            generateData();
        }

        /**
         * 动画值你必须改变目标的值,然后调用{ @link图表#
         * startDataAnimation()}方法(不要混淆View.animate())。如果你操作数据之前设置你不必叫{ @link
         * LineChartView # setLineChartData(LineChartData)}。
         */
        private void prepareDataAnimation() {
            for (Line line : data.getLines()) {
                for (PointValue value : line.getValues()) {
                    // 这里我只修改目标X Y值,但可以修改目标。
                    value.setTarget(value.getX(), (float) Math.random() * 100);
                }
            }
        }

        private class ValueTouchListener implements
                LineChartOnValueSelectListener {

            @Override
            public void onValueSelected(int lineIndex, int pointIndex,
                    PointValue value) {
                Toast.makeText(getActivity(), "选择: " + value,
                        Toast.LENGTH_SHORT).show();
            }

            @Override
            public void onValueDeselected() {
                // TODO Auto-generated method stub

            }

        }
    }
}
- 1
- 2
- 3
- 4
- 5
- 6
- 7
- 8
- 9
- 10
- 11
- 12
- 13
- 14
- 15
- 16
- 17
- 18
- 19
- 20
- 21
- 22
- 23
- 24
- 25
- 26
- 27
- 28
- 29
- 30
- 31
- 32
- 33
- 34
- 35
- 36
- 37
- 38
- 39
- 40
- 41
- 42
- 43
- 44
- 45
- 46
- 47
- 48
- 49
- 50
- 51
- 52
- 53
- 54
- 55
- 56
- 57
- 58
- 59
- 60
- 61
- 62
- 63
- 64
- 65
- 66
- 67
- 68
- 69
- 70
- 71
- 72
- 73
- 74
- 75
- 76
- 77
- 78
- 79
- 80
- 81
- 82
- 83
- 84
- 85
- 86
- 87
- 88
- 89
- 90
- 91
- 92
- 93
- 94
- 95
- 96
- 97
- 98
- 99
- 100
- 101
- 102
- 103
- 104
- 105
- 106
- 107
- 108
- 109
- 110
- 111
- 112
- 113
- 114
- 115
- 116
- 117
- 118
- 119
- 120
- 121
- 122
- 123
- 124
- 125
- 126
- 127
- 128
- 129
- 130
- 131
- 132
- 133
- 134
- 135
- 136
- 137
- 138
- 139
- 140
- 141
- 142
- 143
- 144
- 145
- 146
- 147
- 148
- 149
- 150
- 151
- 152
- 153
- 154
- 155
- 156
- 157
- 158
- 159
- 160
- 161
- 162
- 163
- 164
- 165
- 166
- 167
- 168
- 169
- 170
- 171
- 172
- 173
- 174
- 175
- 176
- 177
- 178
- 179
- 180
- 181
- 182
- 183
- 184
- 185
- 186
- 187
- 188
- 189
- 190
- 191
- 192
- 193
- 194
- 195
- 196
- 197
- 198
- 199
- 200
- 201
- 202
- 203
- 204
- 205
- 206
- 207
- 208
- 209
- 210
- 211
- 212
- 213
- 214
- 215
- 216
- 217
- 218
- 219
- 220
- 221
- 222
- 223
- 224
- 225
- 226
- 227
- 228
- 229
- 230
- 231
- 232
- 233
- 234
- 235
- 236
- 237
- 238
- 239
- 240
- 241
- 242
- 243
- 244
- 245
- 246
- 247
- 248
- 249
- 250
- 251
- 252
- 253
- 254
- 255
- 256
- 257
- 258
- 259
- 260
- 261
- 262
- 263
- 264
- 265
- 266
- 267
- 268
- 269
- 270
- 271
- 272
- 273
- 274
- 275
- 276
- 277
- 278
- 279
- 280
- 281
- 282
- 283
- 284
- 285
- 286
- 287
- 288
- 289
- 290
- 291
- 292
- 293
- 294
- 295
- 296
- 297
- 298
- 299
- 300
- 301
- 302
- 303
- 304
- 305
- 306
- 307
- 308
- 309
- 310
- 311
- 312
- 313
- 314
- 315
- 316
- 317
- 318
- 319
- 320
- 321
- 322
- 323
- 324
- 325
- 326
- 327
- 328
- 329
- 330
- 331
- 332
- 333
- 334
- 335
- 336
- 337
- 338
- 339
- 340
- 341
- 342
- 343
- 344
- 345
- 346
- 347
- 348
- 349
- 350
- 351
- 352
- 353
- 354
- 355
- 356
- 357
- 358
- 359
- 360
- 361
- 362
- 363
- 364
- 365
- 366
- 367
- 368
- 369
- 370
- 371
- 372
- 373
- 374
- 375
- 376
- 377
- 378
- 379
- 380
- 381
- 382
- 383
- 384
- 385
- 386
- 387
- 388
- 389
- 390
- 391
- 392
- 393
- 394
- 395
- 396
- 397
- 398
- 399
- 400
- 401
- 402
- 403
- 404
- 405
- 406
- 407
- 408
- 409
- 410
- 411
- 412
- 413
- 414
- 415
- 416
- 417
- 418
- 419
- 420
- 421
- 422
- 423
- 424
- 425
- 426
- 427
- 428
- 429
- 430
- 431
- 432
- 433
- 434
- 435
- 436
- 437
- 438
- 439
- 440
- 441
- 442
- 443
- 444
- 445
- 446
- 447
- 448
- 449
- 450
- 451
- 452
- 453
- 454
- 455
- 456
从上面其实可以很容易的就看出,我们一个activity然后add了一个fragment,而一个fragment的实现,有一个xml,在xml中就要用上自定义的view的标签了,而所有的操作,都在menu的菜单上,每个菜单对应的是一个方法,看上去是很多的代码,其实只要你耐心一下,你会发现很多的规律,而且这里也只是才去了随机数,项目中的数据可改性还是很大的,下面的就不一一说明了,现在打字都很卡,编辑器的原因,然道是内容太多了?可是这个原理也不好分章节去写,毕竟有12个重复的写法,那样就太无聊了,我们还是来直接说一下我上次的这个demo的结构
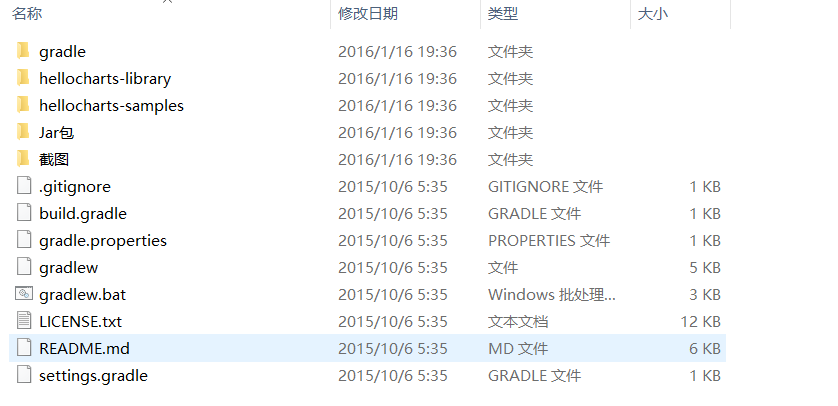
这个我整理过,所以你只要导入hellocharts-library和hellocharts-samples,然后让hellocharts-samples依赖hellocharts-library就可以直接运行了
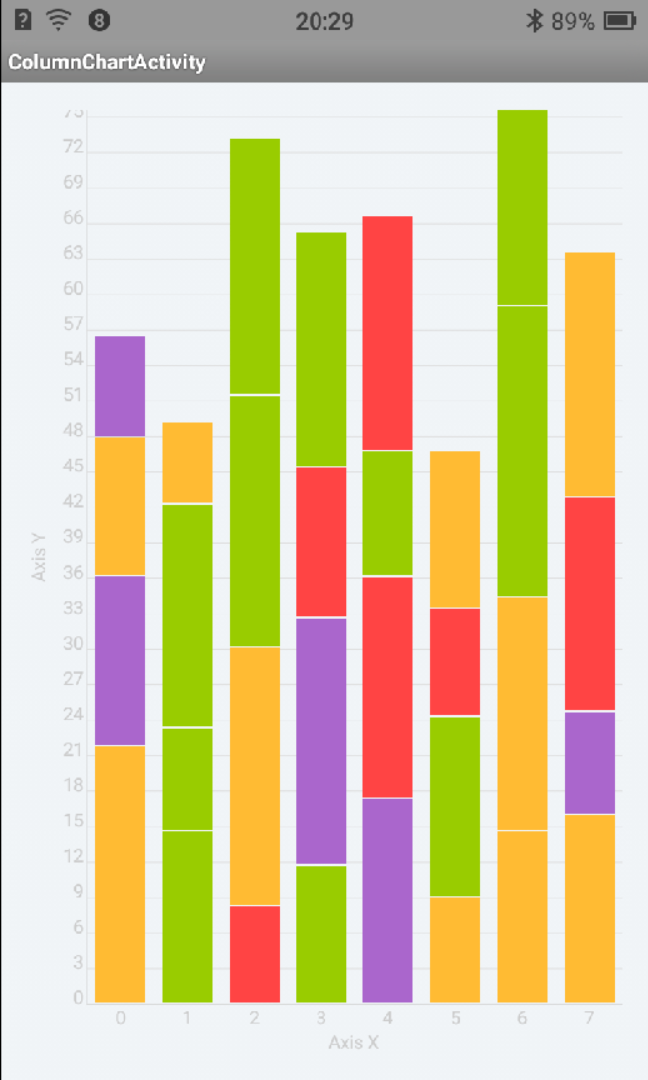
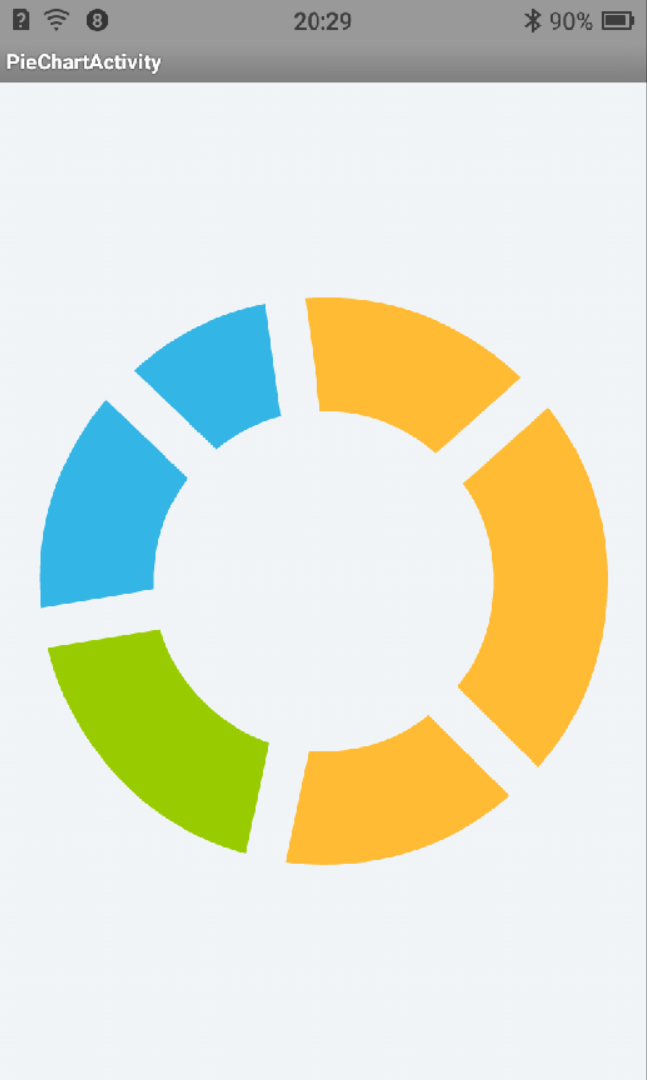
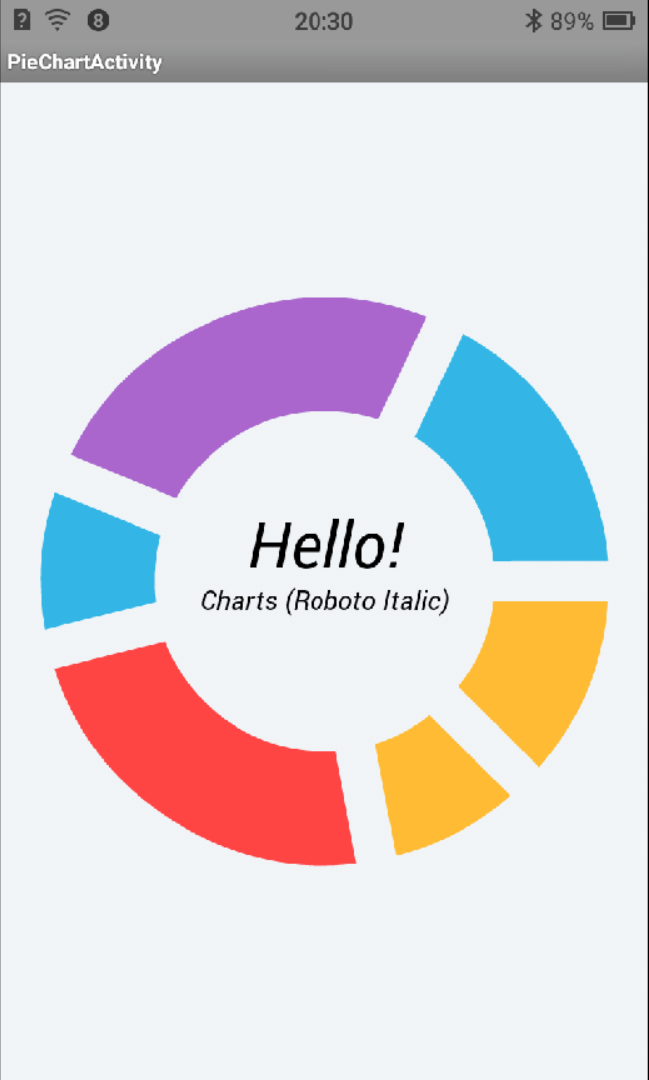
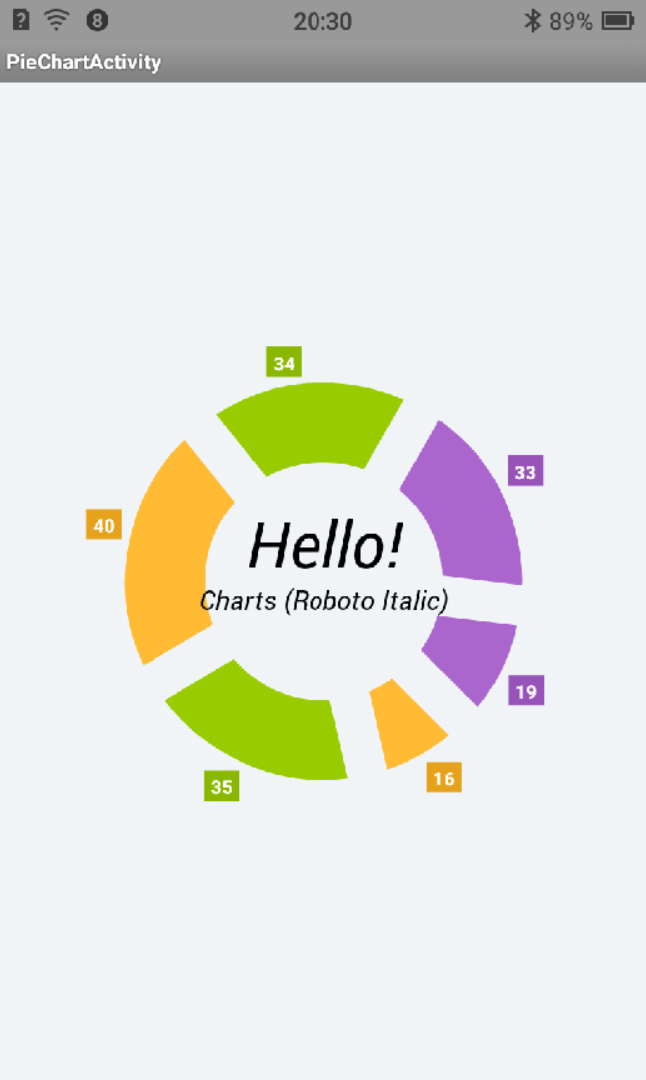
我们接下来再放几张运行图就直接上Demo吧
Demo下载地址:http://download.csdn.net/detail/qq_26787115/9406897
转自:http://blog.csdn.net/qq_26787115/article/details/50492743


 3787
3787

 被折叠的 条评论
为什么被折叠?
被折叠的 条评论
为什么被折叠?
 到【灌水乐园】发言


