


简介
这篇文章是整个系统的第二篇,上一篇文章讲解了 kubelet 的功能和使用。
在 kubernetes 集群中,API Server 有着非常重要的角色。API Server 负责和 etcd 交互(其他组件不会直接操作 etcd,只有 API Server 这么做),是整个 kubernetes 集群的数据中心,所有的交互都是以 API Server 为核心的。简单来说,API Server 提供了一下的功能:
整个集群管理的 API 接口:所有对集群进行的查询和管理都要通过 API 来进行
集群内部各个模块之间通信的枢纽:所有模块之前并不会之间互相调用,而是通过和 API Server 打交道来完成自己那部分的工作
集群安全控制:API Server 提供的验证和授权保证了整个集群的安全
在这篇教程中,我们的系统架构将变成下面这个样子:
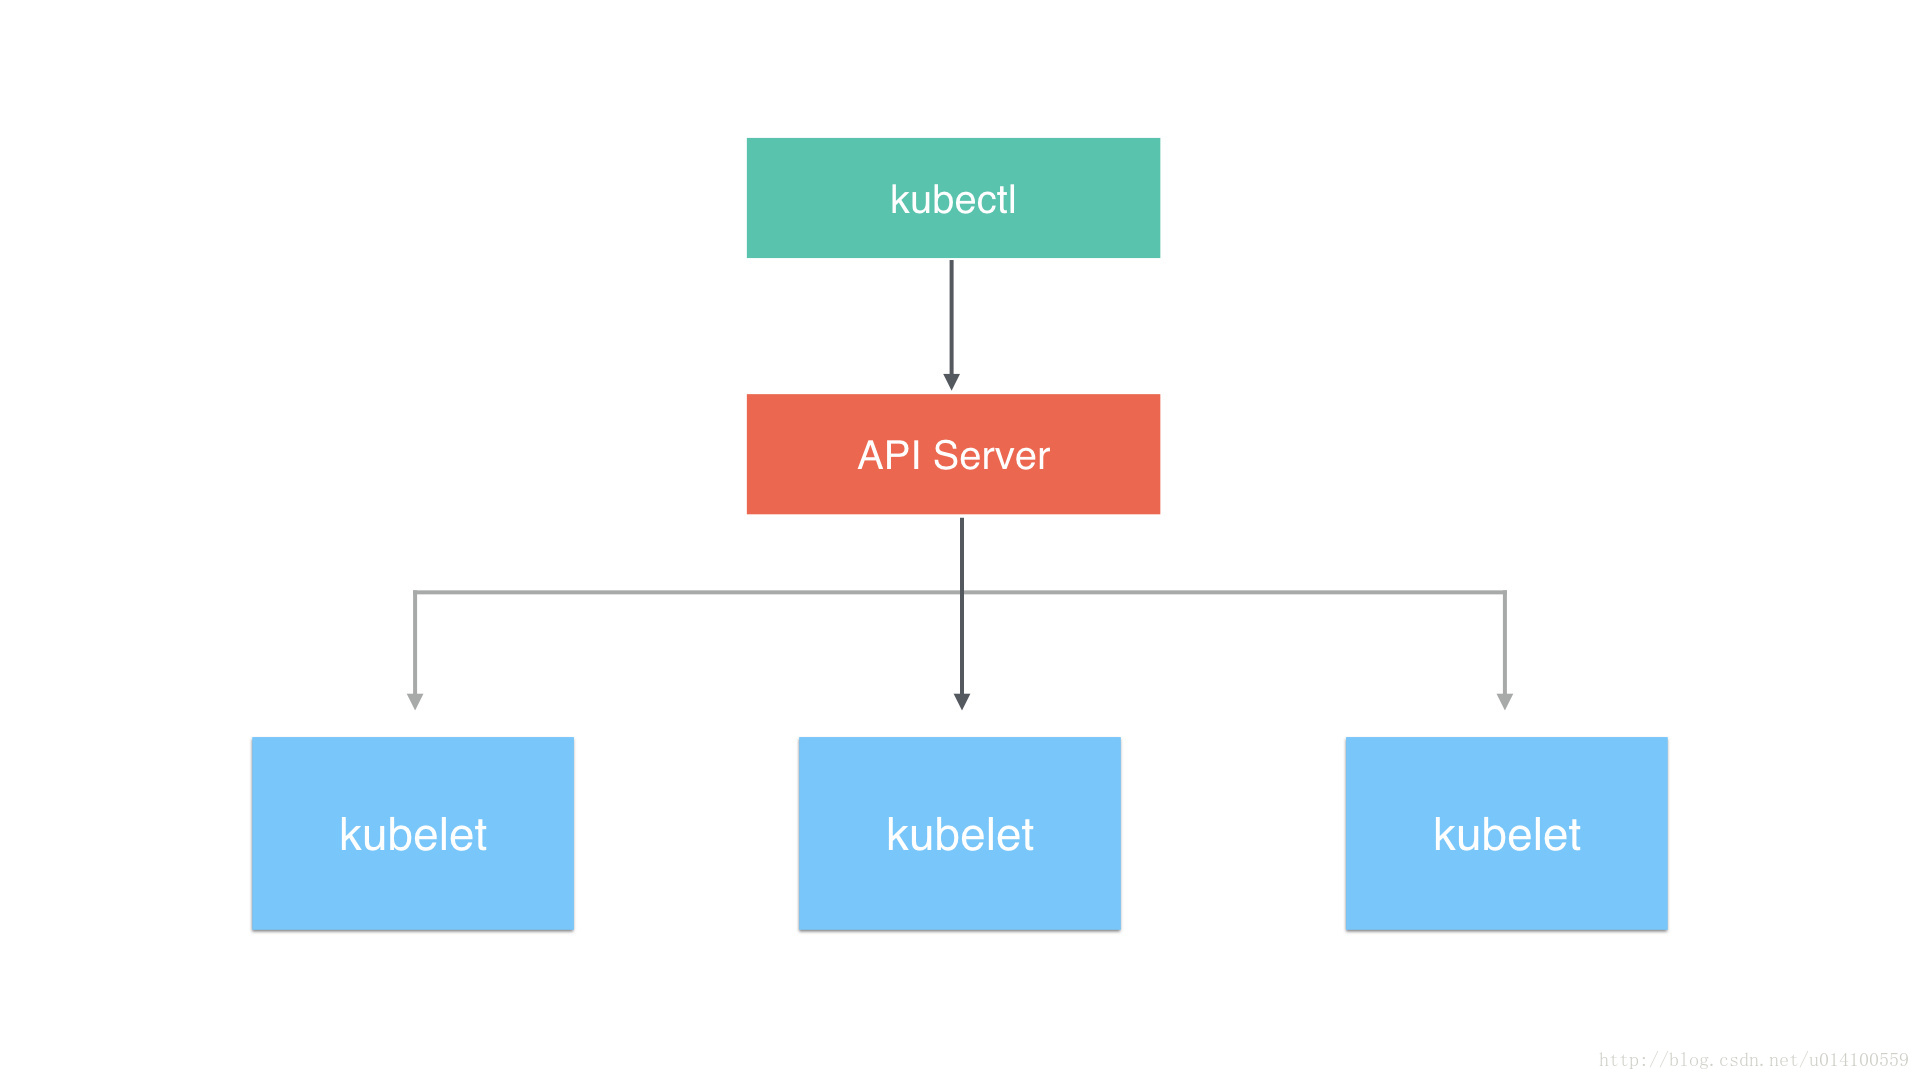
我们把要配置的 pod 通过 kubectl 发送给 API Server,里面已经手动指定了要运行的节点。API Server 解析并保存对应的资源,对应的 kubelet 定时拉取数据时候发现 pod 是分配给自己的,会下载对应的配置并执行去生成 pod。
参数介绍
API Server 主要是和 etcd 打交道,并且对外提供 HTTP 服务,以及进行安全控制,因此它的命令行提供的参数也主要和这几个方面有关。下面是一些比较重要的参数以及说明(不同版本参数可能会有不同):
参数 含义 默认值
–advertise-address 通过该 ip 地址向集群其他节点公布 api server 的信息,必须能够被其他节点访问 nil
–allow-privileged 是否允许 privileged 容器运行 false
–admission-control 准入控制 AlwaysAdmit
–authorization-mode 授权模式 ,安全接口上的授权 AlwaysAllow
–bind-address HTTPS 安全接口的监听地址 0.0.0.0
–secure-port HTTPS 安全接口的监听端口 6443
–cert-dir TLS 证书的存放目录 /var/run/kubernetes
–etcd-prefix 信息存放在 etcd 中地址的前缀 “/registry”
–etcd-servers 逗号分割的 etcd server 地址 []
–insecure-bind-address HTTP 访问的地址 127.0.0.1
–insecure-port HTTP 访问的端口 8080
–log-dir 日志存放的目录
–service-cluster-ip-range service 要使用的网段,使用 CIDR 格式,参考 kubernetes 中 service 的定义
安装和运行
API Server 是通过提供的 kube-apiserver 二进制文件直接运行的,下面的例子指定了 service 分配的 ip 范围,etcd 的地址,和对外提供服务的 ip 地址:
/usr/bin/kube-apiserver \
–service-cluster-ip-range=10.20.0.1/24 \
–etcd-servers=http://127.0.0.1:2379 \
–advertise-address=192.168.8.100 \
–bind-address=192.168.8.100 \
–insecure-bind-address=192.168.8.100 \
–v=4
这篇教程不会提供对 API Server 进行 HTTPS 的配置,所有的操作都是直接通过 8080 非安全端口访问的。
直接访问 8080 端口,API Server 会返回它提供了哪些接口:
[root@localhost vagrant]# curl http://192.168.8.100:8080
{
“paths”: [
“/api”,
“/api/v1”,
“/apis”,
“/apis/apps”,
“/apis/apps/v1alpha1”,
“/apis/autoscaling”,
“/apis/autoscaling/v1”,
“/apis/batch”,
“/apis/batch/v1”,
“/apis/batch/v2alpha1”,
“/apis/extensions”,
“/apis/extensions/v1beta1”,
“/apis/policy”,
“/apis/policy/v1alpha1”,
“/apis/rbac.authorization.k8s.io”,
“/apis/rbac.authorization.k8s.io/v1alpha1”,
“/healthz”,
“/healthz/ping”,
“/logs/”,
“/metrics”,
“/swaggerapi/”,
“/ui/”,
“/version”
]
}
而目前最重要的路径是 /api/v1,里面包含了 kubernetes 所有资源的操作,比如下面的 nodes:
➜ ~ http http://192.168.8.100:8080/api/v1/nodes
HTTP/1.1 200 OK
Content-Length: 112
Content-Type: application/json
Date: Thu, 08 Sep 2016 08:14:45 GMT
{
“apiVersion”: “v1”,
“items”: [],
“kind”: “NodeList”,
“metadata”: {
“resourceVersion”: “12”,
“selfLink”: “/api/v1/nodes”
}
}
API 以 json 的形式返回,会通过 apiVersion 来说明 API 版本号,kind 说明请求的是什么资源。不过这里面的内容是空的,因为目前还没有任何 kubelet 节点接入到我们的 API Server。对应的,pod 也是空的:
➜ ~ http http://192.168.8.100:8080/api/v1/pods
HTTP/1.1 200 OK
Content-Length: 110
Content-Type: application/json
Date: Thu, 08 Sep 2016 08:18:53 GMT
{
“apiVersion”: “v1”,
“items”: [],
“kind”: “PodList”,
“metadata”: {
“resourceVersion”: “12”,
“selfLink”: “/api/v1/pods”
}
}
添加节点
添加节点也非常简单,启动 kubelet 的时候使用 –api-servers 指定要接入的 API Server 就行。kubelet 启动之后,会把自己注册到指定的 API Server,然后监听 API 对应 pod 的变化,根据 API 中 pod 的实际信息来管理节点上 pod 的生命周期。
现在访问 /api/v1/nodes 就能看到已经添加进来的节点:
➜ ~ http http://192.168.8.100:8080/api/v1/nodes
HTTP/1.1 200 OK
Content-Type: application/json
Date: Thu, 08 Sep 2016 08:27:44 GMT
Transfer-Encoding: chunked
{
“apiVersion”: “v1”,
“items”: [
{
“metadata”: {
“annotations”: {
“volumes.kubernetes.io/controller-managed-attach-detach”: “true”
},
“creationTimestamp”: “2016-09-08T08:23:01Z”,
“labels”: {
“beta.kubernetes.io/arch”: “amd64”,
“beta.kubernetes.io/os”: “linux”,
“kubernetes.io/hostname”: “192.168.8.100”
},
“name”: “192.168.8.100”,
“resourceVersion”: “65”,
“selfLink”: “/api/v1/nodes/192.168.8.100”,
“uid”: “74e16eba-759d-11e6-b463-080027c09e5b”
},
“spec”: {
“externalID”: “192.168.8.100”
},
“status”: {
“addresses”: [
{
“address”: “192.168.8.100”,
“type”: “LegacyHostIP”
},
{
“address”: “192.168.8.100”,
“type”: “InternalIP”
}
],
“allocatable”: {
“alpha.kubernetes.io/nvidia-gpu”: “0”,
“cpu”: “1”,
“memory”: “502164Ki”,
“pods”: “110”
},
“capacity”: {
“alpha.kubernetes.io/nvidia-gpu”: “0”,
“cpu”: “1”,
“memory”: “502164Ki”,
“pods”: “110”
},
“conditions”: [
{
“lastHeartbeatTime”: “2016-09-08T08:27:36Z”,
“lastTransitionTime”: “2016-09-08T08:23:01Z”,
“message”: “kubelet has sufficient disk space available”,
“reason”: “KubeletHasSufficientDisk”,
“status”: “False”,
“type”: “OutOfDisk”
},
{
“lastHeartbeatTime”: “2016-09-08T08:27:36Z”,
“lastTransitionTime”: “2016-09-08T08:23:01Z”,
“message”: “kubelet has sufficient memory available”,
“reason”: “KubeletHasSufficientMemory”,
“status”: “False”,
“type”: “MemoryPressure”
},
{
“lastHeartbeatTime”: “2016-09-08T08:27:36Z”,
“lastTransitionTime”: “2016-09-08T08:24:56Z”,
“message”: “kubelet is posting ready status”,
“reason”: “KubeletReady”,
“status”: “True”,
“type”: “Ready”
}
],
“daemonEndpoints”: {
“kubeletEndpoint”: {
“Port”: 10250
}
},
“images”: [
{
“names”: [
“172.16.1.41:5000/nginx:latest”
],
“sizeBytes”: 425626718
},
{
“names”: [
“172.16.1.41:5000/hyperkube:v0.18.2”
],
“sizeBytes”: 207121551
},
{
“names”: [
“172.16.1.41:5000/etcd:v3.0.4”
],
“sizeBytes”: 43302056
},
{
“names”: [
“172.16.1.41:5000/busybox:latest”
],
“sizeBytes”: 1092588
},
{
“names”: [
“172.16.1.41:5000/google_containers/pause:0.8.0”
],
“sizeBytes”: 241656
}
],
“nodeInfo”: {
“architecture”: “amd64”,
“bootID”: “48955926-11dd-4ad3-8bb0-2585b1c9215d”,
“containerRuntimeVersion”: “docker://1.10.3”,
“kernelVersion”: “3.10.0-123.13.1.el7.x86_64”,
“kubeProxyVersion”: “v1.3.1-beta.0.6+fbf3f3e5292fb0”,
“kubeletVersion”: “v1.3.1-beta.0.6+fbf3f3e5292fb0”,
“machineID”: “b9597c4ae5f24494833d35e806e00b29”,
“operatingSystem”: “linux”,
“osImage”: “CentOS Linux 7 (Core)”,
“systemUUID”: “823EB67A-057E-4EFF-AE7F-A758140CD2F7”
}
}
}
],
“kind”: “NodeList”,
“metadata”: {
“resourceVersion”: “65”,
“selfLink”: “/api/v1/nodes”
}
}
我们可以看到,kubelet 收集了很多关于自身节点的信息,这些信息也会不断更新。这些信息里面不仅包含节点的系统信息(系统架构,操作系统版本,内核版本等)、还有镜像信息(节点上有哪些已经下载的 docker 镜像)、资源信息(Memory 和 Disk 的总量和可用量)、以及状态信息(是否正常,可以分配 pod等)。
和 API Server 通信
下面我们就通过 API Server 来创建 pod,而不是像上篇文章那样用拷贝文件的方式。我们把编写的 yaml 文件转换成 json 格式,保存到文件里。主要注意的是,我们指定了 nodeName 的名字,这个名字必须和之前通过 /api/v1/nodes 得到的结果中 metadata.labels.kubernetes.io/hostname 保持一致:
[root@localhost vagrant]# cat nginx_pod.yml
apiVersion: v1
kind: Pod
metadata:
name: nginx-server
spec:
nodeName: 192.168.8.100
containers:
- name: nginx-server
image: 172.16.1.41:5000/nginx
ports:
- containerPort: 80
volumeMounts:
- mountPath: /var/log/nginx
name: nginx-logs
- name: log-output
image: 172.16.1.41:5000/busybox
command:
- bin/sh
args: [-c, ‘tail -f /logdir/access.log’]
volumeMounts:
- mountPath: /logdir
name: nginx-logs
volumes:
- name: nginx-logs
emptyDir: {}
使用 curl 执行 POST 请求,设置头部内容为 application/json,传过去文件中的 json 值,可以看到应答(其中 status 为 pending,表示以及接收到请求,正在准备处理):
curl -s -X POST -H “Content-Type: application/json” http://192.168.8.100:8080/api/v1/namespaces/default/pods –data @nginx_pod.json
{
“kind”: “Pod”,
“apiVersion”: “v1”,
“metadata”: {
“name”: “nginx-server”,
“namespace”: “default”,
“selfLink”: “/api/v1/namespaces/default/pods/nginx-server”,
“uid”: “888e95d0-75a9-11e6-b463-080027c09e5b”,
“resourceVersion”: “573”,
“creationTimestamp”: “2016-09-08T09:49:28Z”
},
“spec”: {
“volumes”: [
{
“name”: “nginx-logs”,
“emptyDir”: {}
}
],
“containers”: [
{
“name”: “nginx-server”,
“image”: “172.16.1.41:5000/nginx”,
“ports”: [
{
“containerPort”: 80,
“protocol”: “TCP”
}
],
“resources”: {},
“volumeMounts”: [
{
“name”: “nginx-logs”,
“mountPath”: “/var/log/nginx”
}
],
“terminationMessagePath”: “/dev/termination-log”,
“imagePullPolicy”: “Always”
}
],
“restartPolicy”: “Always”,
“terminationGracePeriodSeconds”: 30,
“dnsPolicy”: “ClusterFirst”,
“nodeName”: “192.168.8.100”,
“securityContext”: {}
},
“status”: {
“phase”: “Pending”
}
}
返回中包含了我们提交 pod 的信息,并且添加了 status、metadata 等额外信息。
等一段时间去查询 pod,就可以看到 pod 的状态已经更新了:
➜ http http://192.168.8.100:8080/api/v1/namespaces/default/pods
HTTP/1.1 200 OK
Content-Type: application/json
Date: Thu, 08 Sep 2016 09:51:29 GMT
Transfer-Encoding: chunked
{
“apiVersion”: “v1”,
“items”: [
{
“metadata”: {
“creationTimestamp”: “2016-09-08T09:49:28Z”,
“name”: “nginx-server”,
“namespace”: “default”,
“resourceVersion”: “592”,
“selfLink”: “/api/v1/namespaces/default/pods/nginx-server”,
“uid”: “888e95d0-75a9-11e6-b463-080027c09e5b”
},
“spec”: {
“containers”: [
{
“image”: “172.16.1.41:5000/nginx”,
“imagePullPolicy”: “Always”,
“name”: “nginx-server”,
“ports”: [
{
“containerPort”: 80,
“protocol”: “TCP”
}
],
“resources”: {},
“terminationMessagePath”: “/dev/termination-log”,
“volumeMounts”: [
{
“mountPath”: “/var/log/nginx”,
“name”: “nginx-logs”
}
]
},
{
“args”: [
“-c”,
“tail -f /logdir/access.log”
],
“command”: [
“bin/sh”
],
“image”: “172.16.1.41:5000/busybox”,
“imagePullPolicy”: “Always”,
“name”: “log-output”,
“resources”: {},
“terminationMessagePath”: “/dev/termination-log”,
“volumeMounts”: [
{
“mountPath”: “/logdir”,
“name”: “nginx-logs”
}
]
}
],
“dnsPolicy”: “ClusterFirst”,
“nodeName”: “192.168.8.100”,
“restartPolicy”: “Always”,
“securityContext”: {},
“terminationGracePeriodSeconds”: 30,
“volumes”: [
{
“emptyDir”: {},
“name”: “nginx-logs”
}
]
},
“status”: {
“conditions”: [
{
“lastProbeTime”: null,
“lastTransitionTime”: “2016-09-08T09:49:28Z”,
“status”: “True”,
“type”: “Initialized”
},
{
“lastProbeTime”: null,
“lastTransitionTime”: “2016-09-08T09:49:44Z”,
“status”: “True”,
“type”: “Ready”
},
{
“lastProbeTime”: null,
“lastTransitionTime”: “2016-09-08T09:49:44Z”,
“status”: “True”,
“type”: “PodScheduled”
}
],
“containerStatuses”: [
{
“containerID”: “docker://8b79eeea60f27b6d3f0a19cbd1b3ee3f83709bcf56574a6e1124c69a6376972d”,
“image”: “172.16.1.41:5000/busybox”,
“imageID”: “docker://sha256:8c566faa3abdaebc33d40c1b5e566374c975d17754c69370f78c00c162c1e075”,
“lastState”: {},
“name”: “log-output”,
“ready”: true,
“restartCount”: 0,
“state”: {
“running”: {
“startedAt”: “2016-09-08T09:49:43Z”
}
}
},
{
“containerID”: “docker://96e64cdba7b05d4e30710a20e958ff5b8f1f359c8d16d32622b36f0df0cb353c”,
“image”: “172.16.1.41:5000/nginx”,
“imageID”: “docker://sha256:51d764c1fd358ce81fd0e728436bd0175ff1f3fd85fc5d1a2f9ba3e7dc6bbaf6”,
“lastState”: {},
“name”: “nginx-server”,
“ready”: true,
“restartCount”: 0,
“state”: {
“running”: {
“startedAt”: “2016-09-08T09:49:36Z”
}
}
}
],
“hostIP”: “192.168.8.100”,
“phase”: “Running”,
“podIP”: “172.17.0.2”,
“startTime”: “2016-09-08T09:49:28Z”
}
}
],
“kind”: “PodList”,
“metadata”: {
“resourceVersion”: “602”,
“selfLink”: “/api/v1/namespaces/default/pods”
}
}
可以看到 pod 已经在运行,并且给分配了 ip:172.17.0.2,通过 curl 也可以访问它的服务:
[root@localhost vagrant]# curl -s http://172.17.0.2 | head -n 5
Welcome to nginx on Debian!


 2万+
2万+

 被折叠的 条评论
为什么被折叠?
被折叠的 条评论
为什么被折叠?
 到【灌水乐园】发言


