


import numpy as np
import matplotlib.pyplot as plt
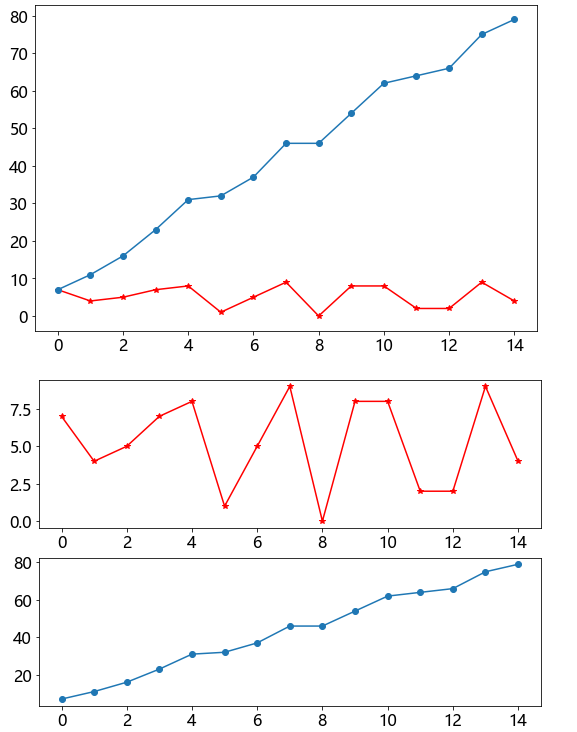
x = np.random.randint(0,10,size = 15)
# ⼀图多线
plt.figure(figsize=(9,6))
plt.plot(x,marker = '*',color = 'r')
plt.plot(x.cumsum(),marker = 'o')
# 多图布局
fig,axs = plt.subplots(2,1)
fig.set_figwidth(9)
fig.set_figheight(6)
axs[0].plot(x,marker = '*',color = 'red')
axs[1].plot(x.cumsum(),marker = 'o')


 6万+
6万+


 被折叠的 条评论
为什么被折叠?
被折叠的 条评论
为什么被折叠?
 到【灌水乐园】发言


