Connect to MySQL in SpagoBI
Create reports featuring live MySQL data in SpagoBI Studio. Host MySQL reports on SpagoBI Server.The CData JDBC Driver for MySQL enables you to connect to live MySQL data from business intelligence and data mining tools that support the JDBC standard. This article shows how to integrate MySQL data into a report in SpagoBI Studio and host it on SpagoBI Server.
- Deploy the Driver in SpagoBI Server
- Create a Report in SpagoBI Studio
- Host MySQL Reports on SpagoBI Server
Deploy the JDBC Driver in SpagoBI Server
Follow the steps to create a JDBC data source for MySQL in SpagoBI Server.
- Copy the driver JAR into %CATALINA_BASE%/lib. These files are located in the lib subfolder of the installation directory.
Add a MySQL driver resource to the context. The following resource definition can be added to the GlobalNamingResources element in server.xml:
<Resourcename="jdbc/mysql"auth="Container"type="javax.sql.DataSource"driverclassname="cdata.jdbc.mysql.MySQLDriver"factory="org.apache.tomcat.jdbc.pool.DataSourceFactory"maxactive="20"maxidle="10"maxwait="-1"/>- Add the following resource link to give access to Web applications. For this article, add the following line to META-INF\context.xml for SpagoBI.
<ResourceLinkglobal="jdbc/mysql"name="jdbc/mysql"type="javax.sql.DataSource"/> - Restart the server.
After adding the driver to the resources for the SpagoBI server, add the data source: In SpagoBI, click Resources -> Data Source -> Add and enter the following information:
- Label: Enter a unique identifier for the driver.
- Description: Enter a description for the driver.
- Dialect: Select Default Dialect.
- Read Only: Select the read-only option. This option determines whether the data source is the default database to save datasets created by the end user.
- Type: Select JDBC.
- URL: Enter the JDBC URL. A typical JDBC URL is below:
jdbc:mysql:User=myUser;Password=myPassword;Database=NorthWind;Server=myServer;Port=3306;The Server and Port properties must be set to a MySQL server. If IntegratedSecurity is set to false, then User and Password must be set to valid user credentials. Optionally, Database can be set to connect to a specific database. If not set, tables from all databases will be returned.
- Driver: Enter the class name for the driver: cdata.jdbc.mysql.MySQLDriver

Create Reports in SpagoBI Studio
Follow the steps below to populate reports based on MySQL data in SpagoBI Studio. You will create a dataset that populates a chart with the results of an SQL query. In the next section, you will host this report on SpagoBI Server.
First, you will need to connect to MySQL data from a report in SpagoBI Studio:
- In SpagoBI Studio, click File -> New -> Project and select Report Project in the Business Intelligence and Reporting Tools folder.
- Click File -> New -> Report and select Blank Report.
- In the Data Explorer view, right-click Data Sources and click New Data Source.
- Select JDBC Data Source and enter a name for the data source.
- Click Manage Drivers and click Add to add the driver JAR, cdata.jdbc.mysql.jar. The driver JAR is located in the lib subfolder of the installation directory.
- In the Driver Class menu, select the driver class, cdata.jdbc.mysql.MySQLDriver.
- In the Database URL box, enter the JDBC URL. A typical JDBC URL is below:See the "Getting Started" chapter of the driver help for a guide to obtaining the required connection properties.
jdbc:mysql:User=myUser;Password=myPassword;Database=NorthWind;Server=myServer;Port=3306;
After you have connected to MySQL data, create a dataset that contains the results of an SQL query:
- Right-click the DataSet folder and click New Data Set. Select the JDBC data source for MySQL and enter a name for the dataset.
- Build the SQL query. In this example, this query will be used to add a chart to the dashboard. For example:
SELECT ShipName, Freight FROM Orders
You can use the dataset to populate report objects. Follow the steps below to create a chart.
- In the Palette view, drag a chart onto the canvas.
- In the Select Chart Type tab, select a bar chart.
- In the Select Data tab, click the Use Data From option and select the MySQL data set from the menu.
- Drag ShipName from the table to the series for the x-axis.
- Drag Freight from the table to the series for the y-axis.

Host MySQL Reports on SpagoBI Server
Follow the steps below to host documents based on live MySQL data on SpagoBI Server. You will use the report you created in the previous section as a template. To enable report users to access the live data, create placeholder parameters to be replaced by the MySQL JDBC data source on the server:
- If you have not already done so, open the Report Design perspective in SpagoBI Studio.
- In the Data Explorer view, right-click the Report Parameters folder and click New Parameter. Add the url parameter and assign an empty value to it. This parameter is a placeholder for the JDBC data source on the SpagoBI Server.
- Right-click the MySQL data source and click Edit.
In the Property Binding node, set the JDBC Driver URL binding property to the url parameter: Click the box for the property. In the Category section, select Report Parameters. Select All in the Subcategory section and double-click the parameter.
You can also enter the following in the JavaScript syntax:
params["url"].value
Next, create a new document for the report on SpagoBI Server.
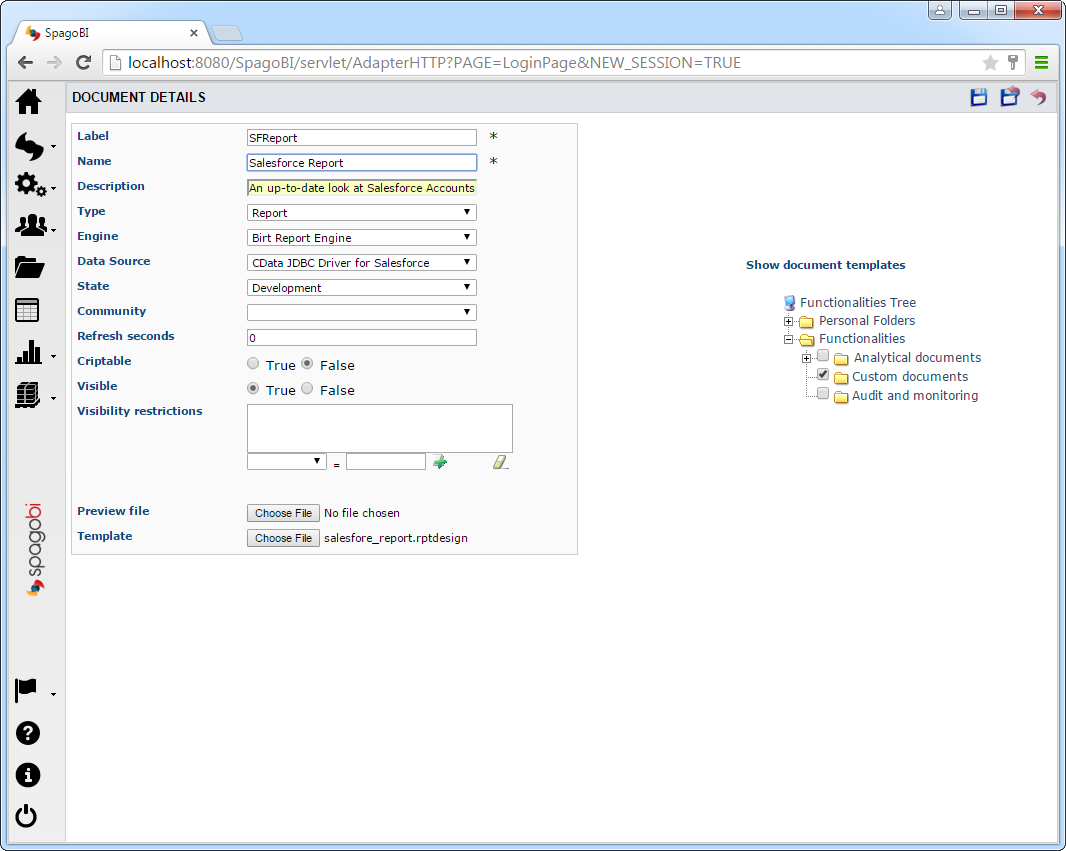
- In SpagoBI Server, click Documents Development -> Create Document -> Generic Document. The Document Details page is displayed.
- To create the document, enter the following:
- Label: Enter a unique identifier for the document.
- Name: Enter a user-friendly name for the document.
- Type: Select Report from the menu.
- Engine: Select BIRT Report Engine.
- Data Source: Select the MySQL Data Source you created in Create a JDBC Data Source for MySQL in SpagoBI Server.
- In the Show Document Templates section, select the folder where you want the document to be stored.
In the Template section, click Choose File. Navigate to the folder containing your report project. Select the .rptdesign file.
Note: You can find the path to the project in the project properties.
- Click the Save button.

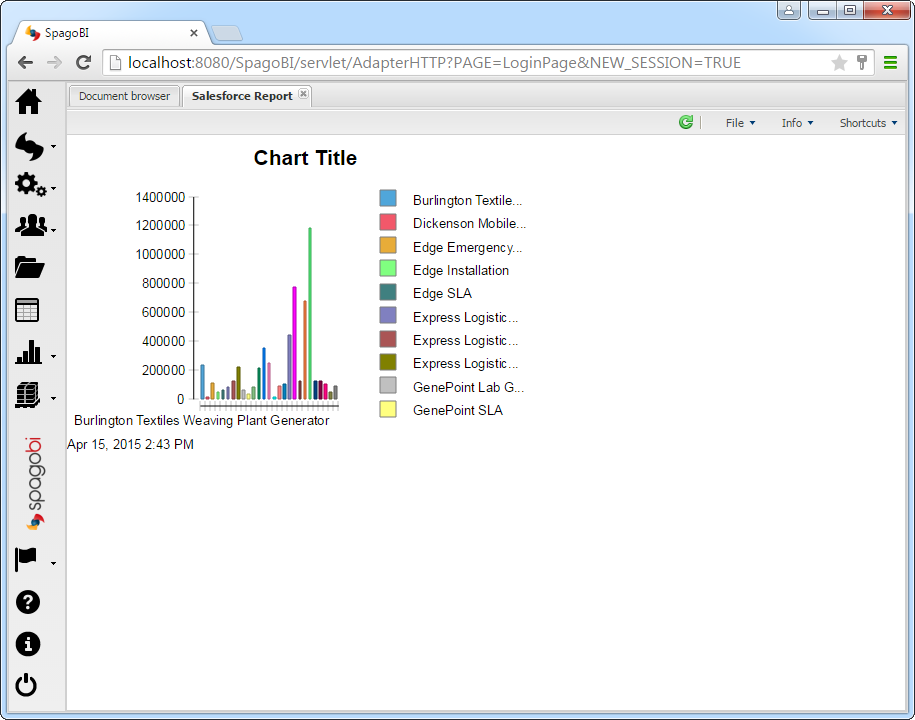
When you run the report on the server, the placeholder url parameter is replaced with the JDBC URL defined on the server.


 1904
1904

 被折叠的 条评论
为什么被折叠?


