


对于一个WEB地图应用来说,地图工具条可以说是不可或缺的一个部分,但由于一些样式、功能往往并不能满足实际项目需要,所以仍要对此部分进行定制,从这里将说明如何利用Oplenayers 3根据项目要求做一个定制化的工具条。
1、工具条功能内容内容
- 全屏、取消全屏
- 视图放大、缩小
- 全图【全图范围,初始化地图到默认的层级,以及预先设定的中心点】
- 地图标绘【点、线、面】
- 地理定位【省份定位】
- 地图切换【影像地图、地形地图】
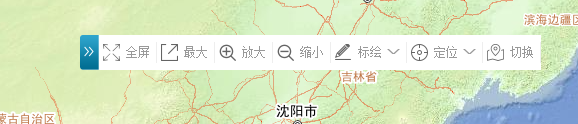
2、最终工具条效果图
3、具体实现
构建页面HTML元素
<div class="tool-container">
    <div class="t_close"></div>
    <ul>
        <li id="tfullscreen">
            <span class="t_1"></span><i>全屏</i>
        </li>
        <b></b>
        <li id="tfullmap">
            <span class="t_2"></span><i>最大</i>
        </li>
        <b></b>
        <li id="tzoomin">
            <span class="t_3">
最低0.47元/天 解锁文章


 60
60


 被折叠的 条评论
为什么被折叠?
被折叠的 条评论
为什么被折叠?
 到【灌水乐园】发言


