


今天遇到了同样的问题,经过搜索,搜到下面这篇文章
Today I struggled a bit with pylab's plot_date function and overlapping date tick labels:
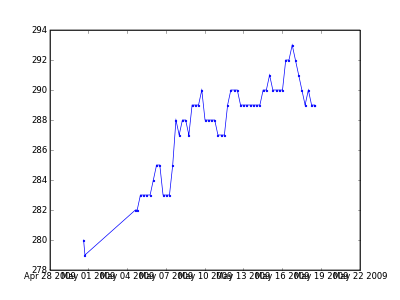
After some googling, I found that pylab offers nice flexible date tick control and formatting. I added a date tick locator and a date formatter to the mix as follows:
import pylab
import matplotlib
import matplotlib.dates
fig = pylab.figure()
ax = fig.gca()
# Plotting stuff here ...
ax.plot_date(dates, values, 'b.-')
# Set major x ticks on Mondays.
ax.xaxis.set_major_locator(
matplotlib.dates.WeekdayLocator(byweekday=matplotlib.dates.MO)
)
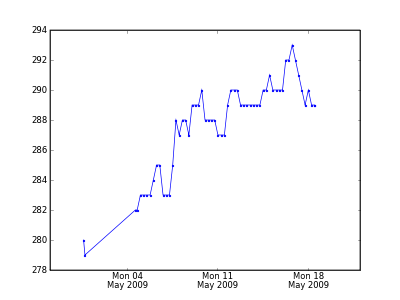
ax.xaxis.set_major_formatter(
matplotlib.dates.DateFormatter('%a %d\n%b %Y')
)and now I have this plot
转自:http://stefaanlippens.net/pylab_date_tick_control


 388
388


 被折叠的 条评论
为什么被折叠?
被折叠的 条评论
为什么被折叠?
 到【灌水乐园】发言


