


with Python, Mapbox GL JS, and Flask
使用Python,Mapbox GL JS和Flask
The City of Grand Rapids, with data available since 2004, has handled code compliance and building cases originating internally and from the public. At the time of this writing, the number of cases started is fast approaching 300,000 cases.
大瀑布城市(City of Grand Rapids)自2004年以来一直提供数据,已处理了合规性和内部和公众来源的建筑案例。 在撰写本文时,开始处理的案件数已Swift接近300,000宗。
Interestingly enough, there is no means to view this data spatially. That is why I built a mapping interface. I aim to update this data at least once a week.
有趣的是,没有办法在空间上查看此数据。 这就是为什么我构建了映射接口。 我的目标是至少每周更新一次此数据。
如果您想了解此Web应用程序的实现,请继续阅读。 如果不是,则可以在此处找到“ 代码合规性”图 。 加载数据时请耐心等待。 (If you would like to learn about the implementation of this web app, please read on. If not, then you can find the Code Compliance map here. Please be patient as the data loads.)
Note: this does not work on Android and probably does not work on iOS. Please use your computer. It is likely too much data for your phone to handle, so your mobile browser will crash.
注意:这在Android上不起作用,可能在iOS上不起作用。 请使用您的计算机。 手机可能无法处理太多数据,因此您的移动浏览器将崩溃。
资料准备 (Data Preparation)
First, I needed parcel data for the City of Grand Rapids so I could later join the case data with parcels by a shared attribute: their parcel number. Data was acquired from Kent County’s excellent data library.
首先,我需要大急流城的宗地数据,以便以后可以通过共享属性(宗地编号)将宗地数据与宗地合并。 数据是从肯特郡出色的数据库中获取的 。
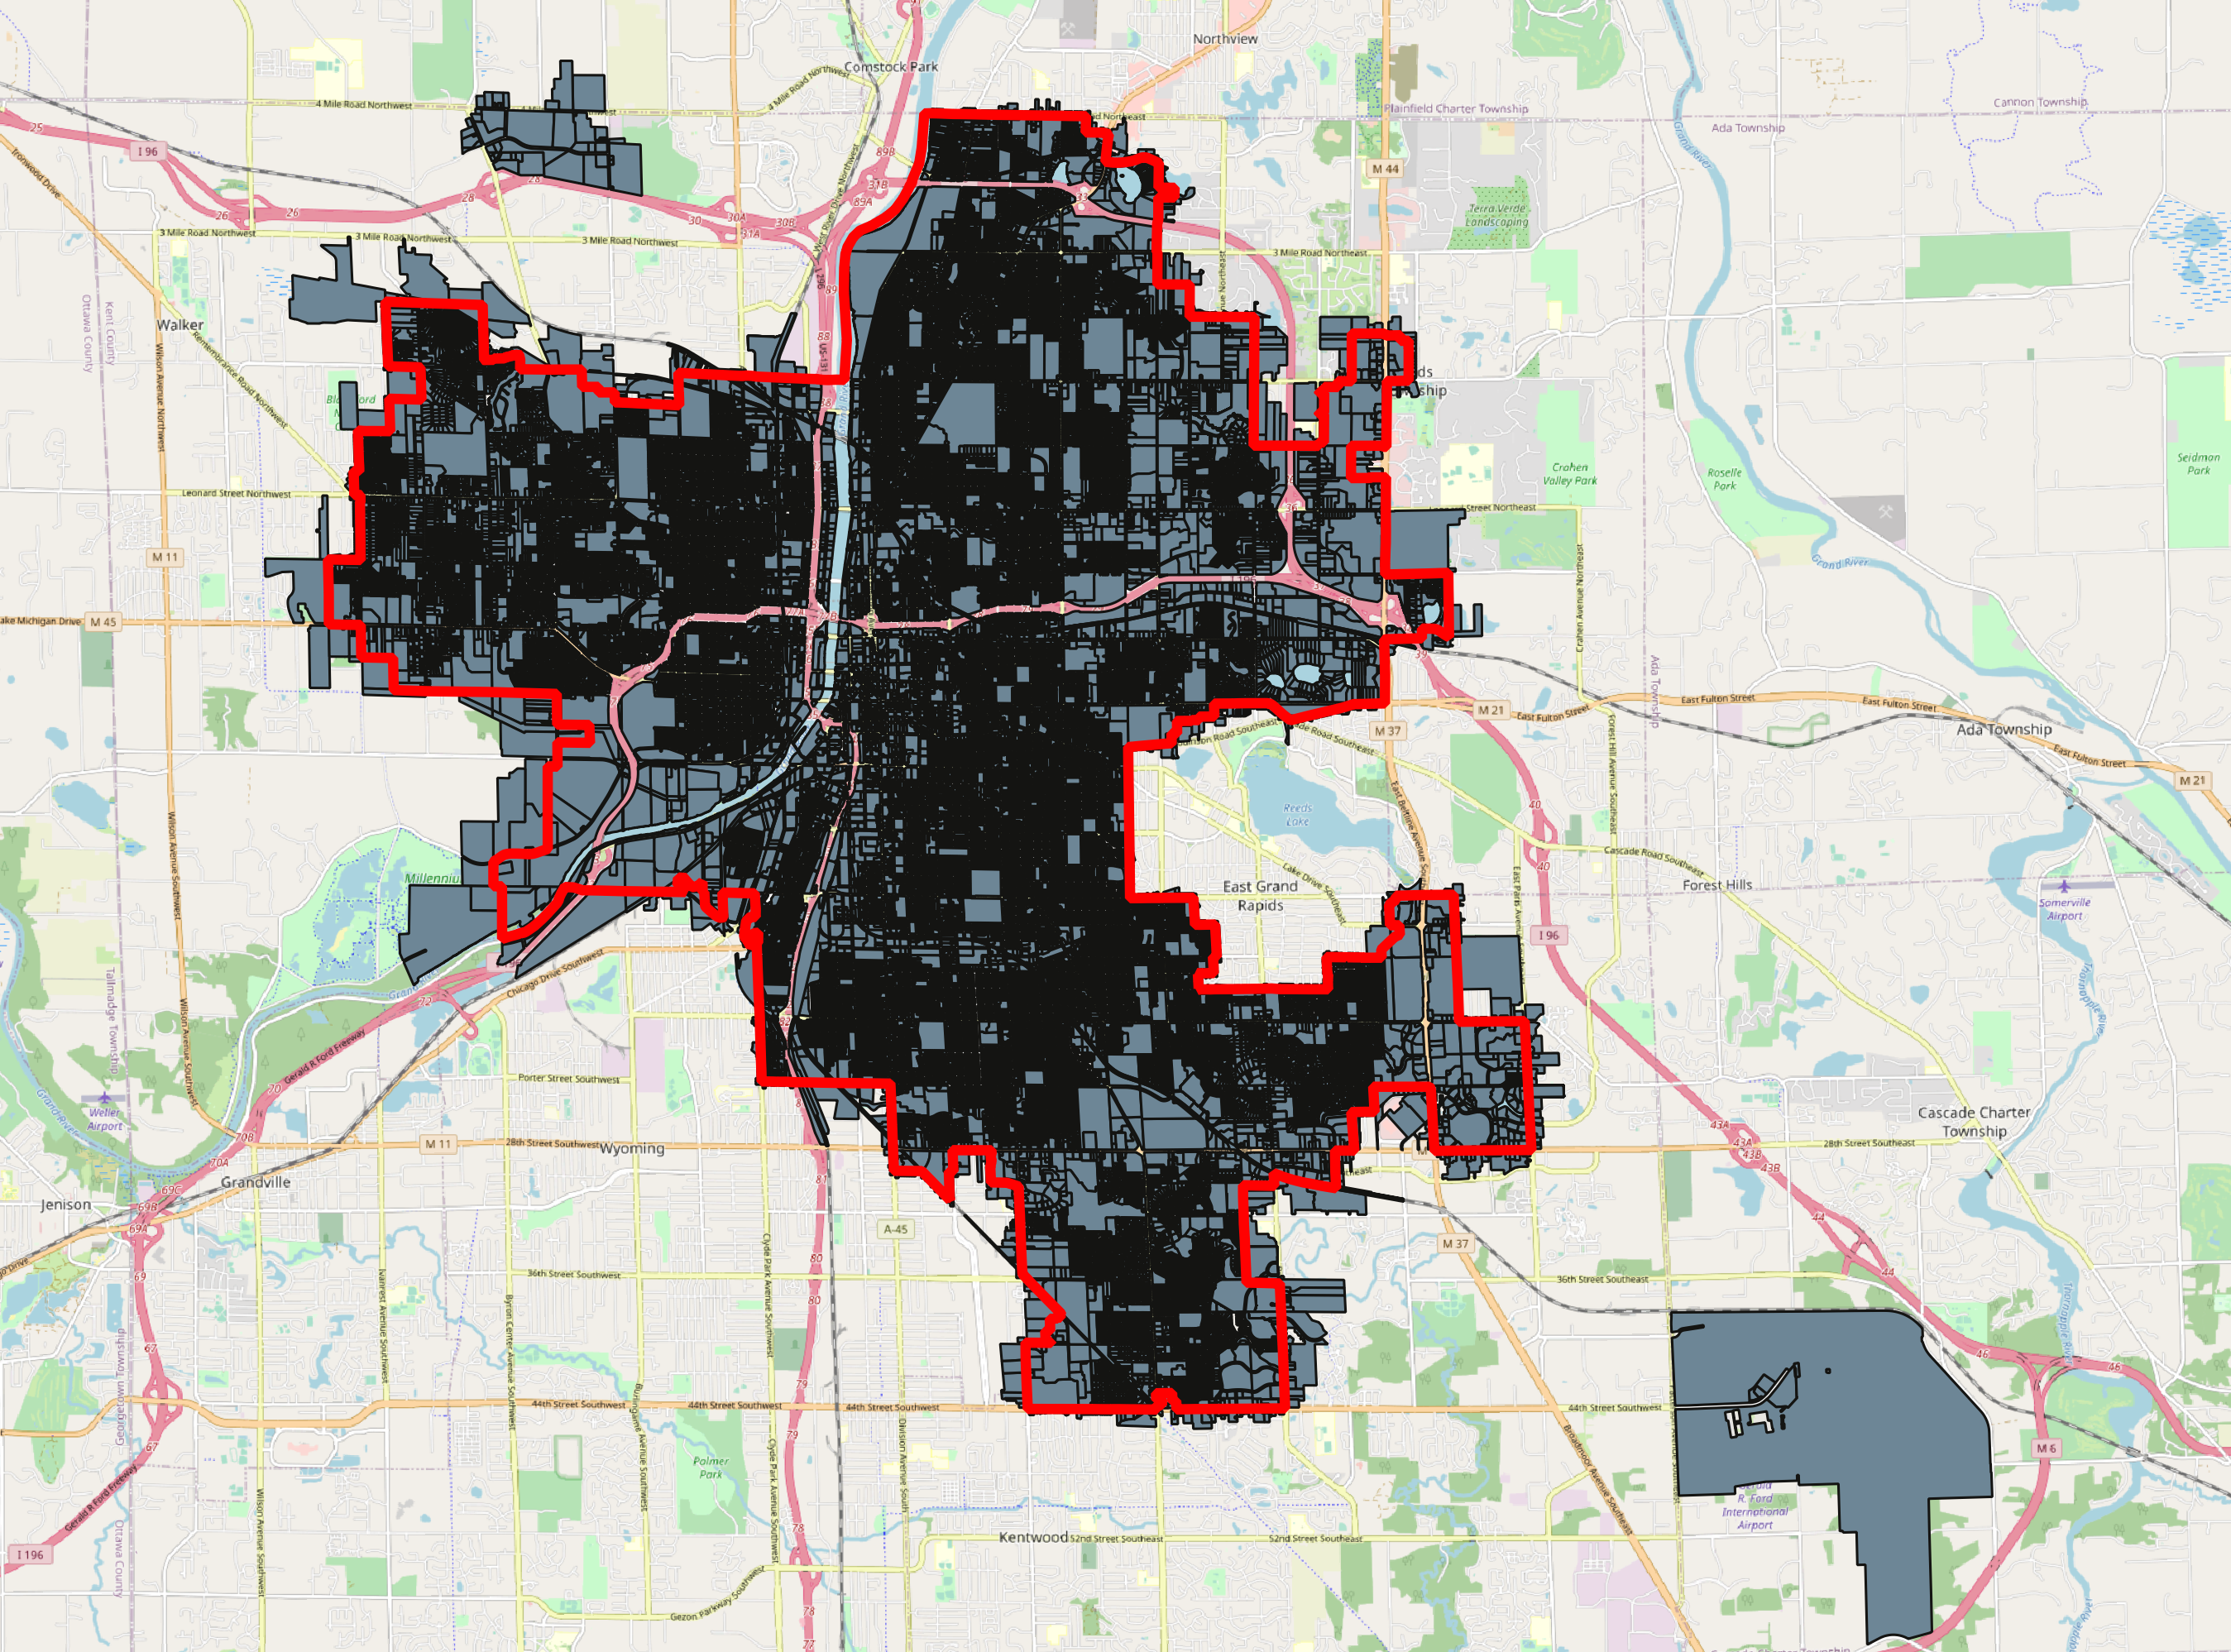
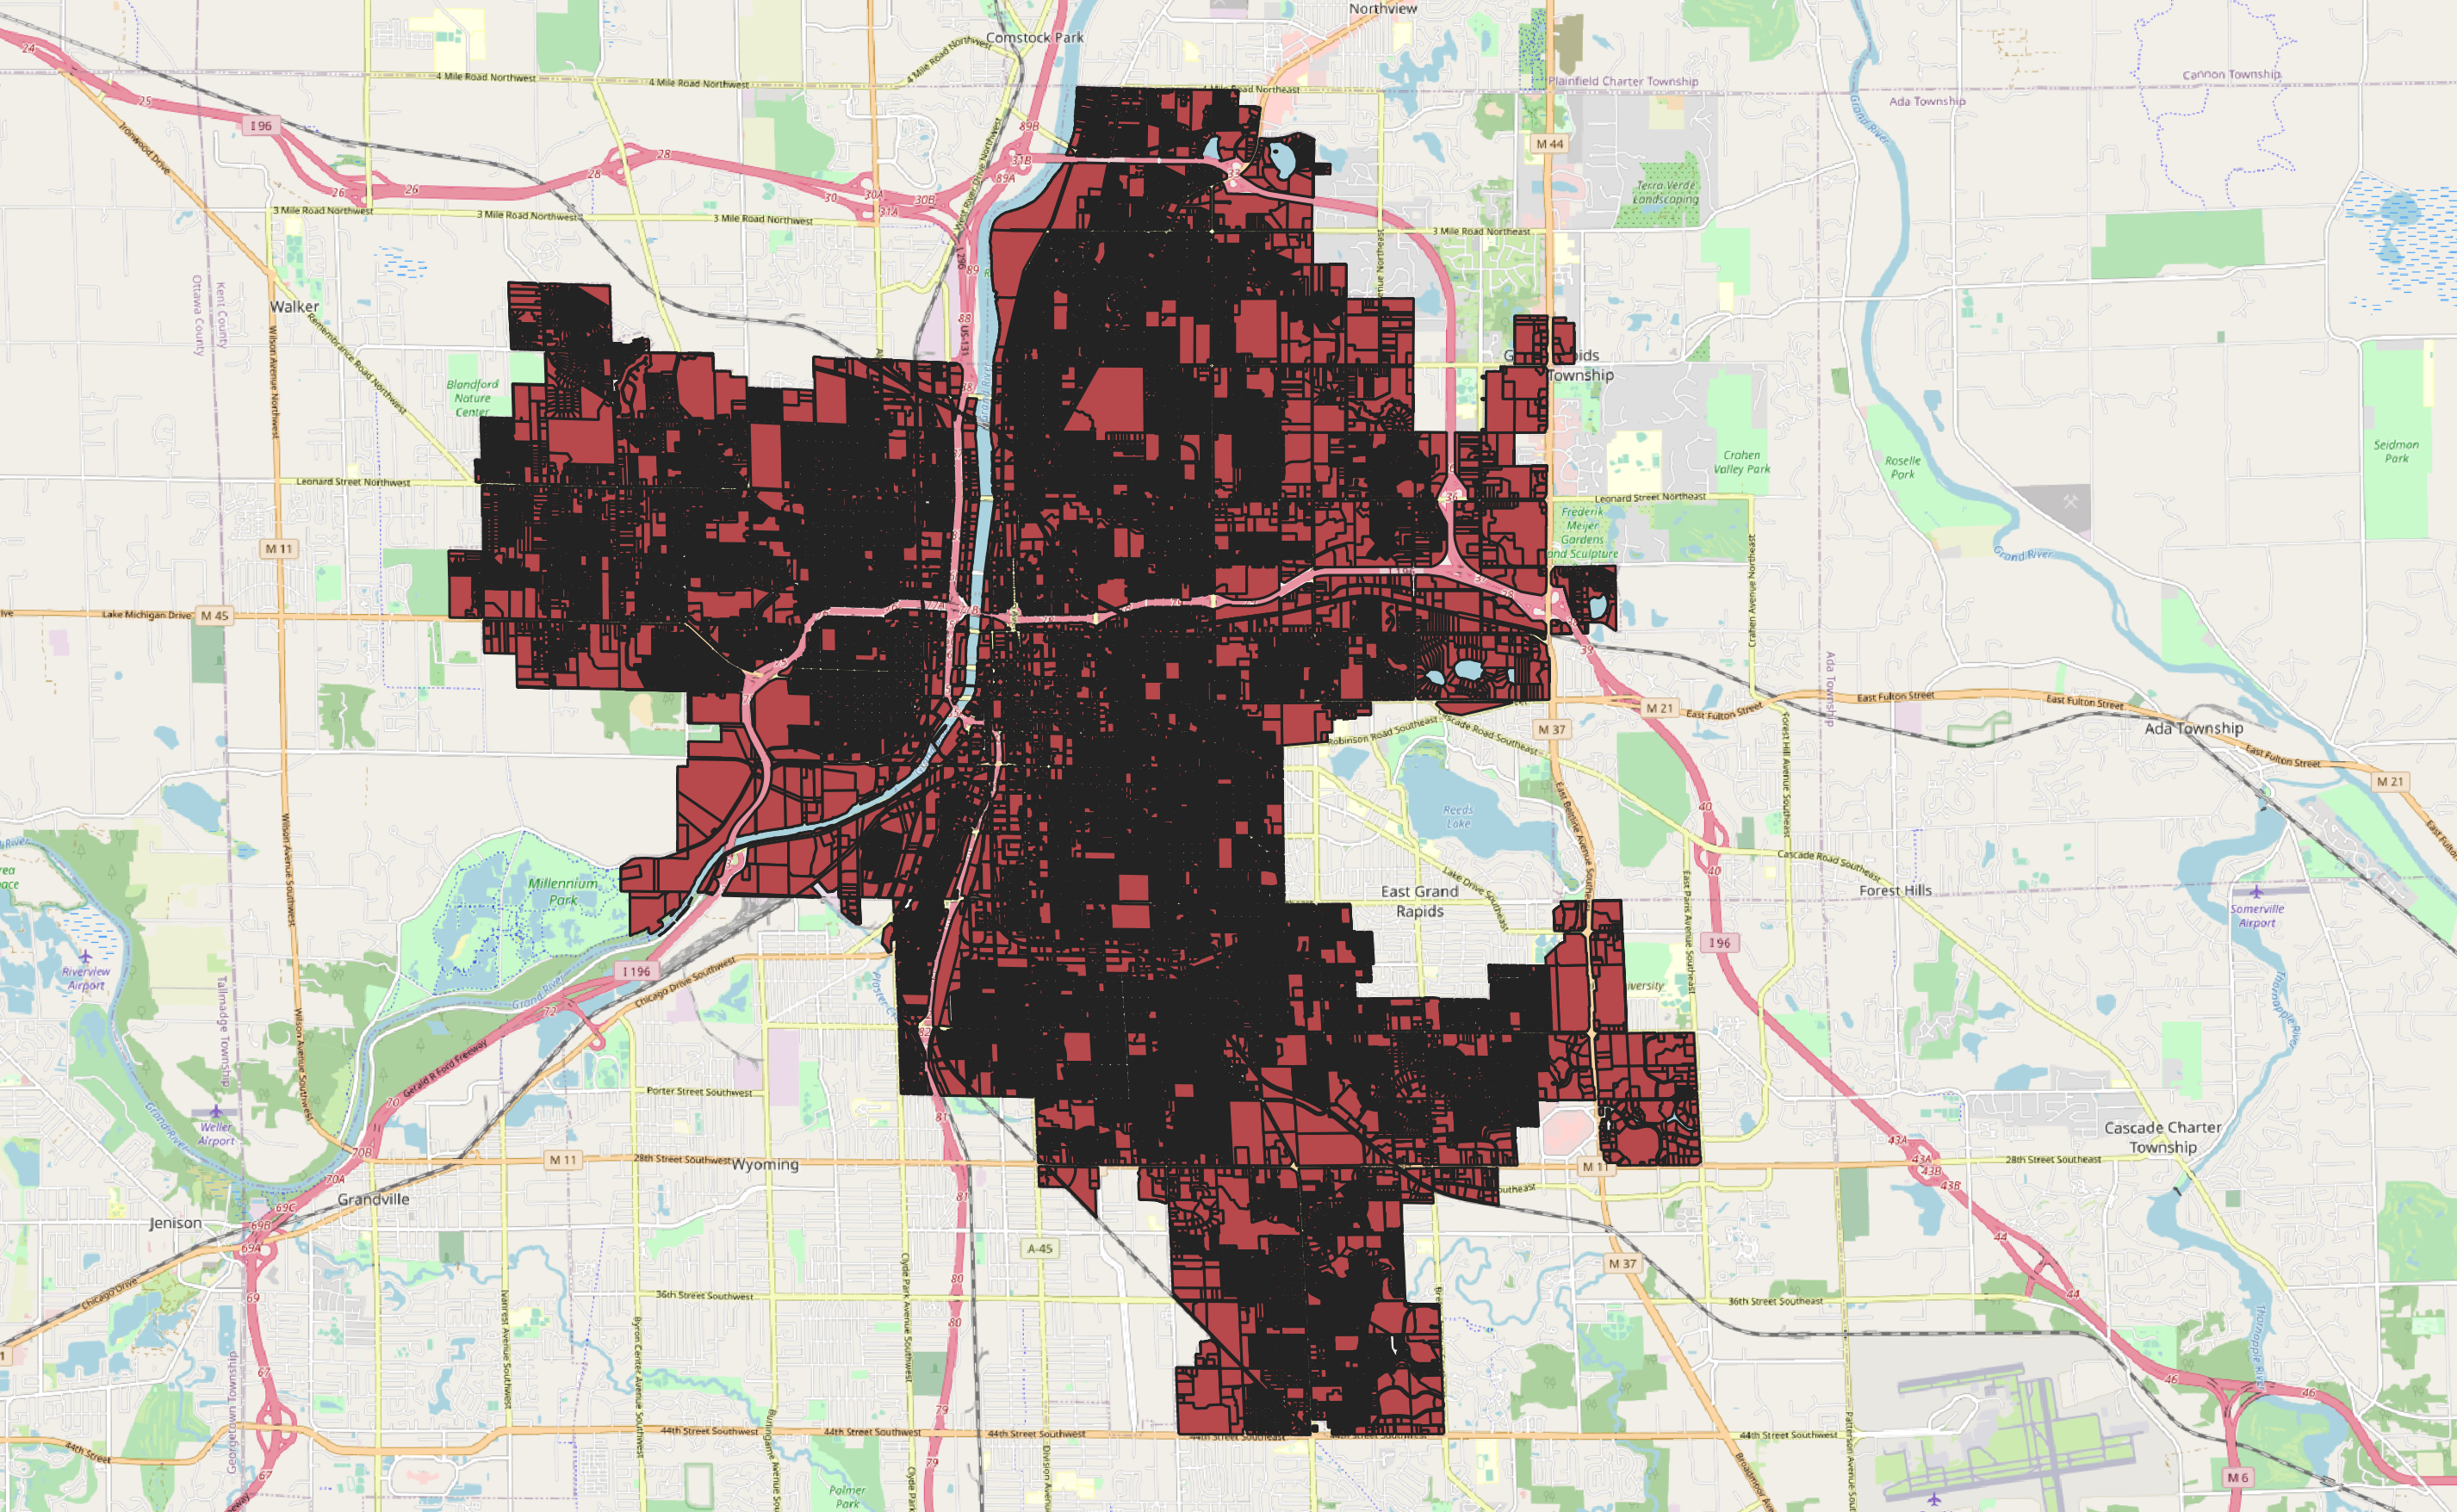
The parcels, as shown in the left image above, needed to be clipped to the City’s actually boundary. This was accomplished via Python’s geopandas library. Moreover, the script below exports the centroid of each parcel since I will want to represent each case in the middle of a parcel.
如上左图所示,这些地块需要修剪到城市的实际边界。 这是通过Python的geopandas库完成的。 此外,下面的脚本导出每个包裹的质心 ,因为我想在包裹的中间表示每种情况。
数据抓取和上传 (Data Scraping and Upload)
All of the data in this project are open to the public, it is just not in an easily consumed format (e.g. a spreadsheet). Well, technically you can search for all properties on the City’s Accela portal, but you will have no luck trying to download all the results (the spreadsheet is too large).
该项目中的所有数据都是向公众开放的,只是不是易用的格式(例如电子表格)。 好吧,从技术上讲,您可以在纽约市的Accela门户上搜索所有属性 ,但是下载所有结果(电子表格太大)会很不幸。
That is why I turned to scraping the data via Python. More specifically, I utilized Selenium to enter date values and download results.
这就是为什么我转向通过Python抓取数据的原因。 更具体地说,我利用Selenium输入日期值并下载结果。
The original script broke down queries by month increments, from 2004 to 2020, and downloaded the results. To download ~300,000 records in this manner took 30 minutes. It would have taken much longer without utilizing multiprocessing.
从2004年到2020年,原始脚本按月增量细分了查询,然后下载了结果。 以这种方式下载约300,000条记录需要30分钟。 如果不使用多处理,将花费更长的时间。
Subsequent runs of the script simply start where the last run of the script left off. With every new run, older cases are updated, data is cleaned, and scraped data are joined with the parcel centroid. All of this data are then manually uploaded to AWS S3, and a stripped down version is uploaded to CARTO (which I will talk more about later).
脚本的后续运行仅从上次脚本停止运行的地方开始。 每次进行新运行时,都会更新旧案例,清理数据,并将拼凑的数据与宗地质心合并。 然后将所有这些数据手动上载到AWS S3 ,并将精简版本上载到CARTO (稍后我将详细讨论)。
You can view both my scraping script and data cleaning script on GitHub.
映射界面 (Mapping Interface)
The mapping interface was built primarily with Flask and Mapbox GL JS. The project layout for Flask was inspired by Miguel Grinberg’s Flask Mega-Tutorial.
映射界面主要使用Flask和Mapbox GL JS构建。 Flask的项目布局受Miguel Grinberg的Flask Mega-Tutorial启发。
Flask is used for serving up web pages and returning data from user POST requests (e.g. updating status filters if the case type changes, querying PostgreSQL to see if a report is done, making a request for a report).
Flask用于提供网页并从用户POST请求返回数据(例如,如果案例类型更改,则更新状态过滤器,查询PostgreSQL以查看是否完成了报告,请求了报告)。
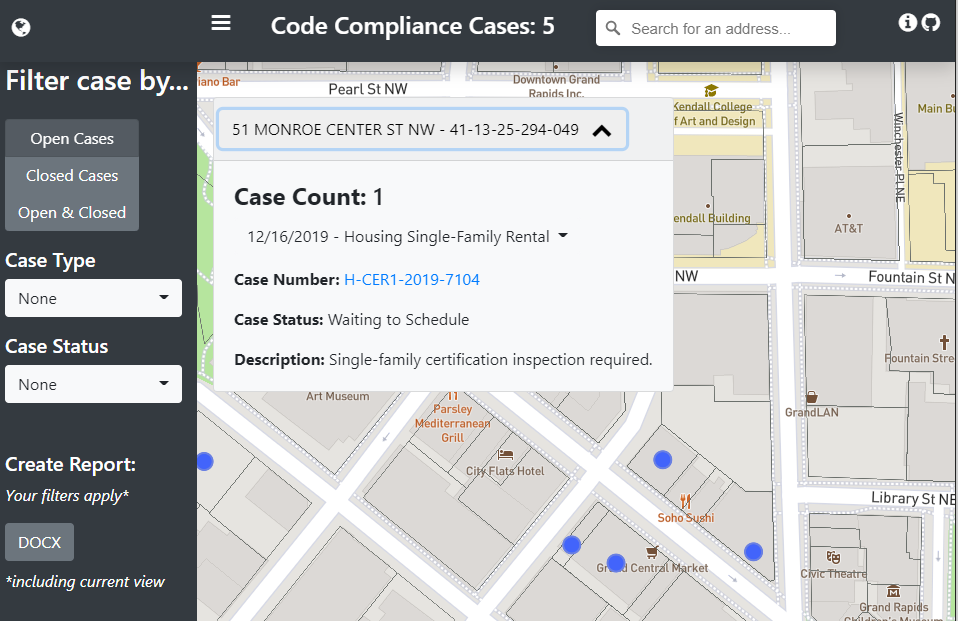
Mapbox GL JS does the work of visualizing the data. Moreover, it is responsible for the case counts, filtering, and pop-ups.
Mapbox GL JS可以完成可视化数据的工作。 此外,它负责案件计数,过滤和弹出窗口。
I won’t go into detail on all of the code (you can view this project on GitHub), but the popups are populated by querying rendered features, determining which points are inside the polygon with turf.js, and then inserting that array of cases into the pop-up.
我不会详细介绍所有代码( 您可以在GitHub上查看此项目 ),但是通过查询渲染的特征,使用turf.js确定哪些点在多边形内,然后插入该数组来填充弹出窗口。弹出的案例。
托管Web应用程序 (Hosting the Web Application)
This web application is hosted on Heroku. The free plan will let you host a website for free. The only downside for the free plan is that this app can “fall asleep”. Basically, if it remains inactive for 30 minutes, it will go to sleep. Any website launches that “wake-up” the app results in a long loading time.
该Web应用程序托管在Heroku上 。 免费计划可让您免费托管网站。 免费计划的唯一缺点是该应用程序可以“入睡”。 基本上,如果它在30分钟内保持不活动状态,它将进入睡眠状态。 任何启动“唤醒”应用程序的网站都会导致较长的加载时间。
Heroku’s free plan allows me to host a web page via their web worker, and to have a background script running with a 2nd worker. It also comes with a free 10,000 rows in a PostgreSQL database. Both the 2nd worker and the database came in handy for the reporting aspect of this project.
Heroku的免费计划允许我通过他们的网络工作者托管一个网页,并让后台脚本与第二个工作者一起运行。 它还在PostgreSQL数据库中免费提供10,000行。 第二工人和数据库在该项目的报告方面都派上了用场。
报告中 (Reporting)
I thought it would be nice to let the user have the ability to create a report based on their filters and current view. The basic workflow of the reporting is as follows:
我认为最好让用户能够基于他们的过滤器和当前视图创建报告。 报告的基本工作流程如下:
- User requests report, filter parameters & current view are recorded in the database 用户请求报告,过滤器参数和当前视图记录在数据库中
- Background script makes request every 10 seconds to see if new reports have been requested 后台脚本每10秒发出一次请求,以查看是否已请求新报告
- If new report is requested, a new report is created, and a message is sent back to the client that their report is ready 如果请求新报告,则创建一个新报告,并向客户发送一条消息,说明他们的报告已准备就绪
- Report is noted as “Ready to download” and the Word Document is sent to the client 报告被标记为“准备下载”,并且Word文档已发送给客户端
There were more obvious avenues I could have taken for the reporting, but their convenience was outweighed by their potential failure (or cost). For example, I could have used something like Celery or Redis for managing task queues, but I think the costs would have been prohibitive (for a project that I am mostly trying to keep free). I could have also just processed the report within the Flask application, but if I did not return any result within 30 seconds, the application would crash.
我可以采用更明显的方法进行报告,但是其潜在的失败(或成本)超过了它们的便利性。 例如,我本可以使用Celery或Redis之类的东西来管理任务队列,但我认为成本本来是高得惊人的(对于我主要试图保持免费的项目)。 我也可以只在Flask应用程序中处理报告,但是如果我在30秒内未返回任何结果,该应用程序将崩溃。
My favorite part of the reporting logic is its use of CARTO and PostgreSQL/PostGIS. Seeing as how I could not load all of the json data from AWS in memory (I kept getting memory errors), I had to pull in the data from CARTO via their SQL API. Here is a bit of an example of what the query construction actually looks like:
报告逻辑中我最喜欢的部分是对CARTO和PostgreSQL / PostGIS的使用。 鉴于无法将AWS中的所有json数据加载到内存中(我不断收到内存错误),我不得不通过其SQL API从CARTO中提取数据。 以下是查询构造实际外观的一个示例:
CARTO’s SQL API was quite helpful because it allowed me to pull in just summaries of the data, not all of it, thus avoiding any memory issues. It also takes advantage of PostGIS functions (like ST_WITHIN) to query cases inside of the user’s view.
CARTOSQL API很有帮助,因为它允许我仅提取数据摘要,而不是全部摘要,从而避免了任何内存问题。 它还利用PostGIS函数(如ST_WITHIN)查询用户视图内的案例。
翻译自: https://medium.com/kray-freestone/mapping-code-violations-in-grand-rapids-dfb080d5de25


 1199
1199


 被折叠的 条评论
为什么被折叠?
被折叠的 条评论
为什么被折叠?
 到【灌水乐园】发言


