


善用工具
There’s a problem with my movement. Most of us in the profession of trying to change the world have little skills or training in the actual craft of influencing human beings to do stuff — especially stuff that is new to them such as composting, putting in LED lights, or cycling to work.
我的动作有问题。 试图改变世界的我们大多数人对影响人类做事的实际技巧几乎没有技能或培训,尤其是对他们来说是新事物,例如堆肥,放入LED灯或骑自行车上班。
Us Earth-professionals know about scientific things like the chemistry of air pollution, the engineering of solar power, or the data of climate change, but few people know about other fields, like behavioral psychology, branding, UI design, story-telling, gamification, copywriting, and the craft of just getting someone's attention, changing their mind, and getting them to do a thing. If your job is to change the world, these are the most important skills of all.
我们地球专家了解空气污染化学,太阳能工程或气候变化数据等科学知识,但是很少有人了解其他领域,例如行为心理学,品牌,UI设计,讲故事,游戏化,文案写作,以及仅引起某人注意,改变主意并让他们做某事的技巧。 如果您的工作是改变世界,那么这些就是最重要的技能。
When I learned about the psychology of how to influence people, I found it so compelling that I wrote a book about it called How to Save the World. Now I design “Fitbit for the Planet” software — and color spectrums applied to data have become central to my new trade.
当我了解了如何影响人的心理学时,我发现它是如此引人注目,以至于我写了一本名为《 如何拯救世界》的书 。 现在 我设计了“ Fitbit for the Planet”软件-应用于数据的色谱已成为我新交易的中心。
使用颜色传达数据以进行更改 (Using color to communicate data for change)

We need to use color in a feedback loop of data about our planet. We’re not talking about the “moods of color” here (like red means hungry, blue means aloof or whatever). We’re using color to signal a data event and use it as a core feature in a project’s UI design to display feedback and performance to the user. Green means you did good. Red means you did bad.
我们需要在有关地球数据的反馈回路中使用颜色。 我们这里不是在谈论“颜色的心情”(例如红色表示饥饿,蓝色表示超然等等)。 我们正在使用颜色来表示数据事件,并将其用作项目UI设计中的核心功能,以向用户显示反馈和性能。 绿色表示您做得很好。 红色表示您做得不好。
颜色是下意识的瞬间 (Color is subconsciously instant)
Nothing communicates as swiftly as color. If you read a word or see numbers in a table, it takes a little time and energy to interpret, but color alone can often say the same thing instantly.
没有什么能像颜色那样Swift地进行交流。 如果您阅读单词或查看表格中的数字,则需要花费一些时间和精力来解释,但是仅靠颜色通常可以立即说出同样的话。
Think of a traffic light. As soon as you see a color like red, yellow, or green, you instantly and unconsciously identify it as stop, slow, or go. If a traffic light displayed only the numbers 1, 2, or 3, or the words stop, slow, or go, it would take more mental effort to figure out what was going on, and would probably lead to many more crunched up cars.
想想一个交通信号灯。 看到红色,黄色或绿色之类的颜色后,您会立即无意识地将其识别为停止,慢速或前进。 如果交通信号灯仅显示数字1、2或3,或者单词“停止”,“慢速”或“走”,则将需要花费更多的心思才能弄清发生的情况,并且可能会导致更多的汽车拥挤。
火灾危险标志使用颜色 (Fire danger signs use color)
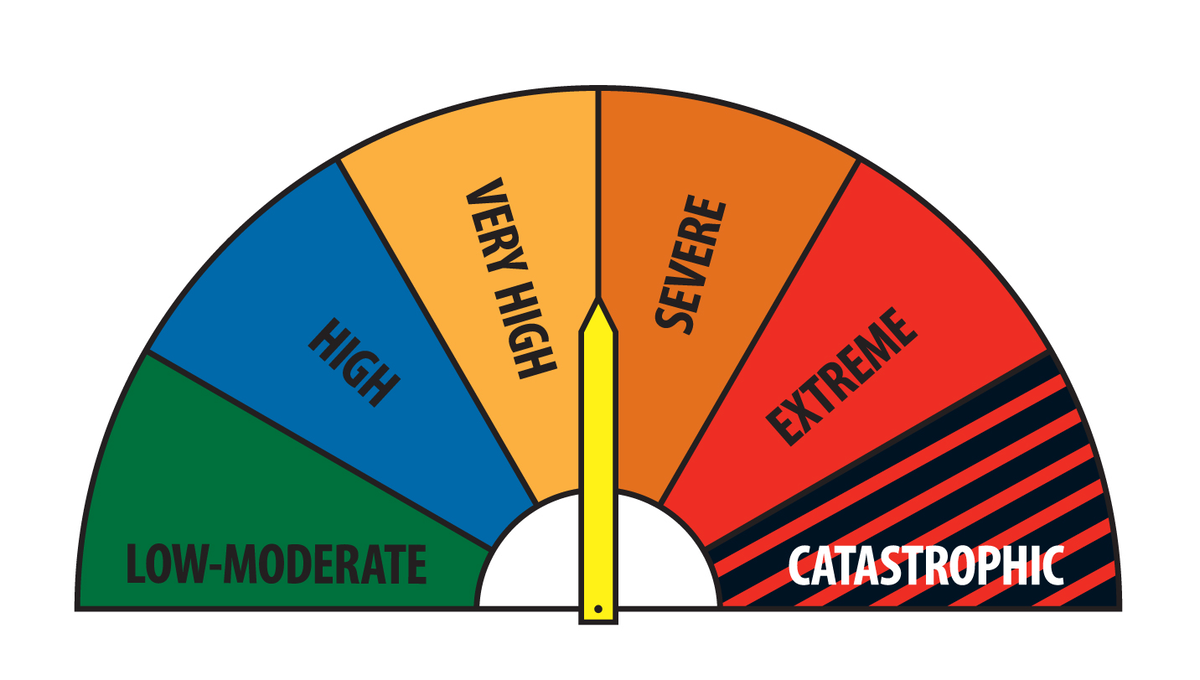
You can correlate a spectrum of colors to your user’s data. A familiar example is the fire danger dashboard. Each degree of fire hazard severity is assigned a color, and we immediately know what it means. Colors naturally trigger an emotional response associated with the player’s rank like, “I’m red, BAD, Why am I red! Yikes, I don’t want to be in the red zone!” or “I’m green, phew! Great!”
您可以将颜色光谱与用户数据相关联。 火灾危险仪表板是一个熟悉的示例。 每个级别的火灾隐患严重程度都分配有一种颜色,我们立即知道它的含义。 颜色自然会触发与玩家等级相关的情绪React,例如“我是红色,不好,我为什么是红色! kes,我不想进入红色区域!” 或“我是绿色,! 大!”
你可以去低科技 (You can go low-tech)
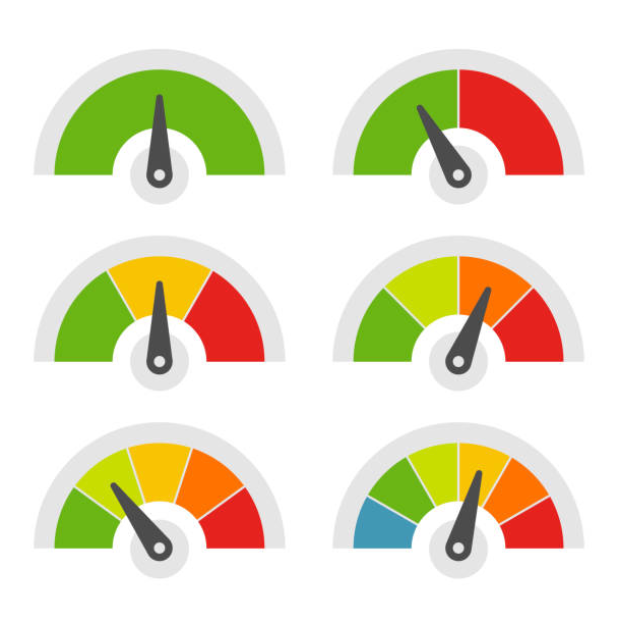
You can easily start applying color grading to your project. You can purchase graphics templates of dashboard and dial illustrations from stock image websites, you can design your own, or you can just add color to a spreadsheet of data. You can have fun with stickers, too. You can assign people in a team with color-coded stickers based on their performance.
您可以轻松地开始对项目应用颜色分级。 您可以从仪表板网站上购买仪表板的图形模板并拨打插图,可以设计自己的模板,也可以仅向数据电子表格中添加颜色。 您也可以通过贴纸获得乐趣。 您可以根据团队的绩效为他们分配带有颜色编码的贴纸的人员。


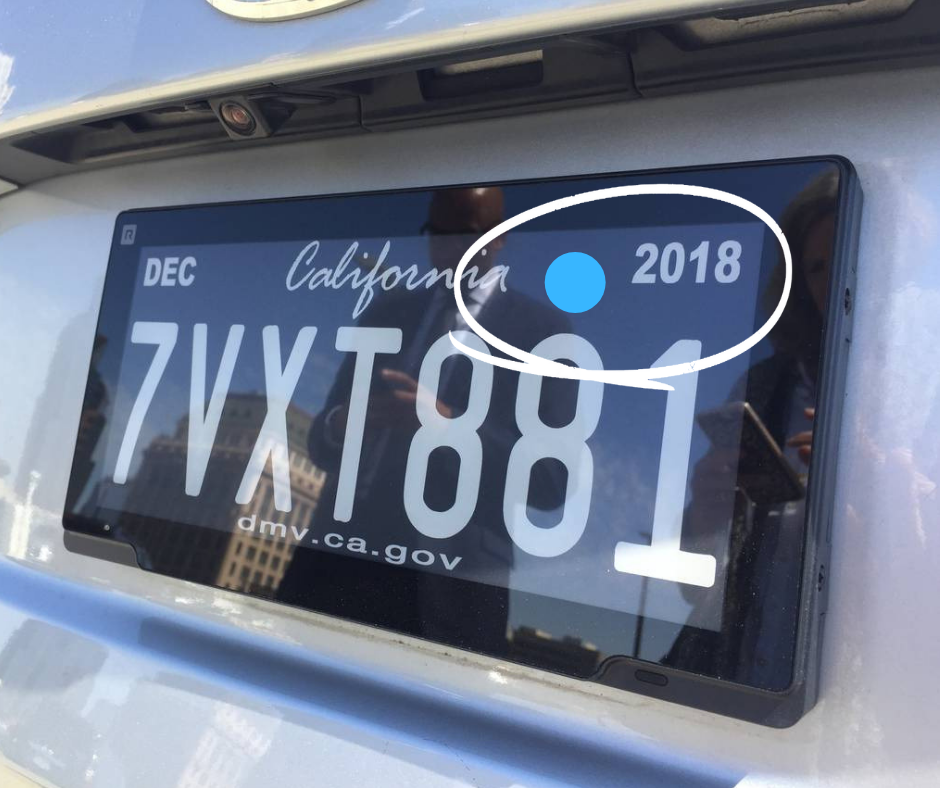
I’ve often thought that cars should have colored stickers on their plates that indicate their fuel efficiency. I think people would be deterred from owning a car with a red or crimson sticker on it, even if the sticker is small and hard to see.
我经常认为,汽车的车牌上应该有彩色贴纸,以指示其燃油效率。 我认为,即使贴纸很小且很难看到,人们也会阻止拥有上面贴有红色或深红色贴纸的汽车。
电子色彩可以提高能源效率 (Electronic color can drive energy efficiency)

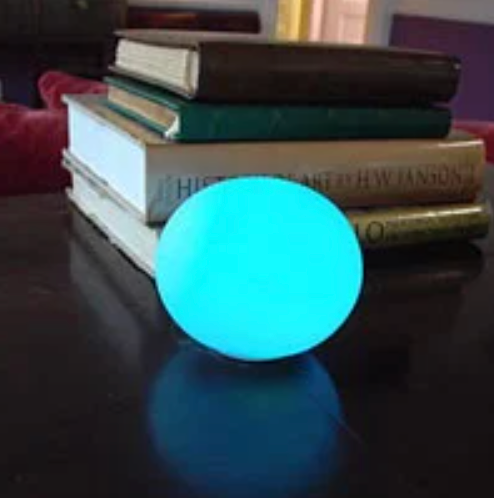

The Ambient Orb was a spherical light that disclosed a household’s energy consumption by glowing red when the home used a lot of energy and glowing cooler colors when the home was using less energy. The makers of the glowing light claimed that it caused people to reduce their energy use by up to forty percent. Forty percent is a huge reduction. It worked so well because the glowing colors are immediate and easy to understand. The Ambient Orb was superseded by a new startup called Glow that launched a colored energy light in 2018.
环境球是一种球形灯,当家庭使用大量能量时,它会发出红色的光,而当家庭使用较少的能量时,它会发出较冷的颜色,从而揭示了家庭的能源消耗。 发光灯的制造商声称,它使人们减少了多达40%的能源使用。 百分之四十是一个巨大的下降。 它之所以能很好地工作,是因为发光的颜色立即且易于理解。 环境球被一个名为Glow的新创业公司所取代,该公司于2018年推出了彩色节能灯。
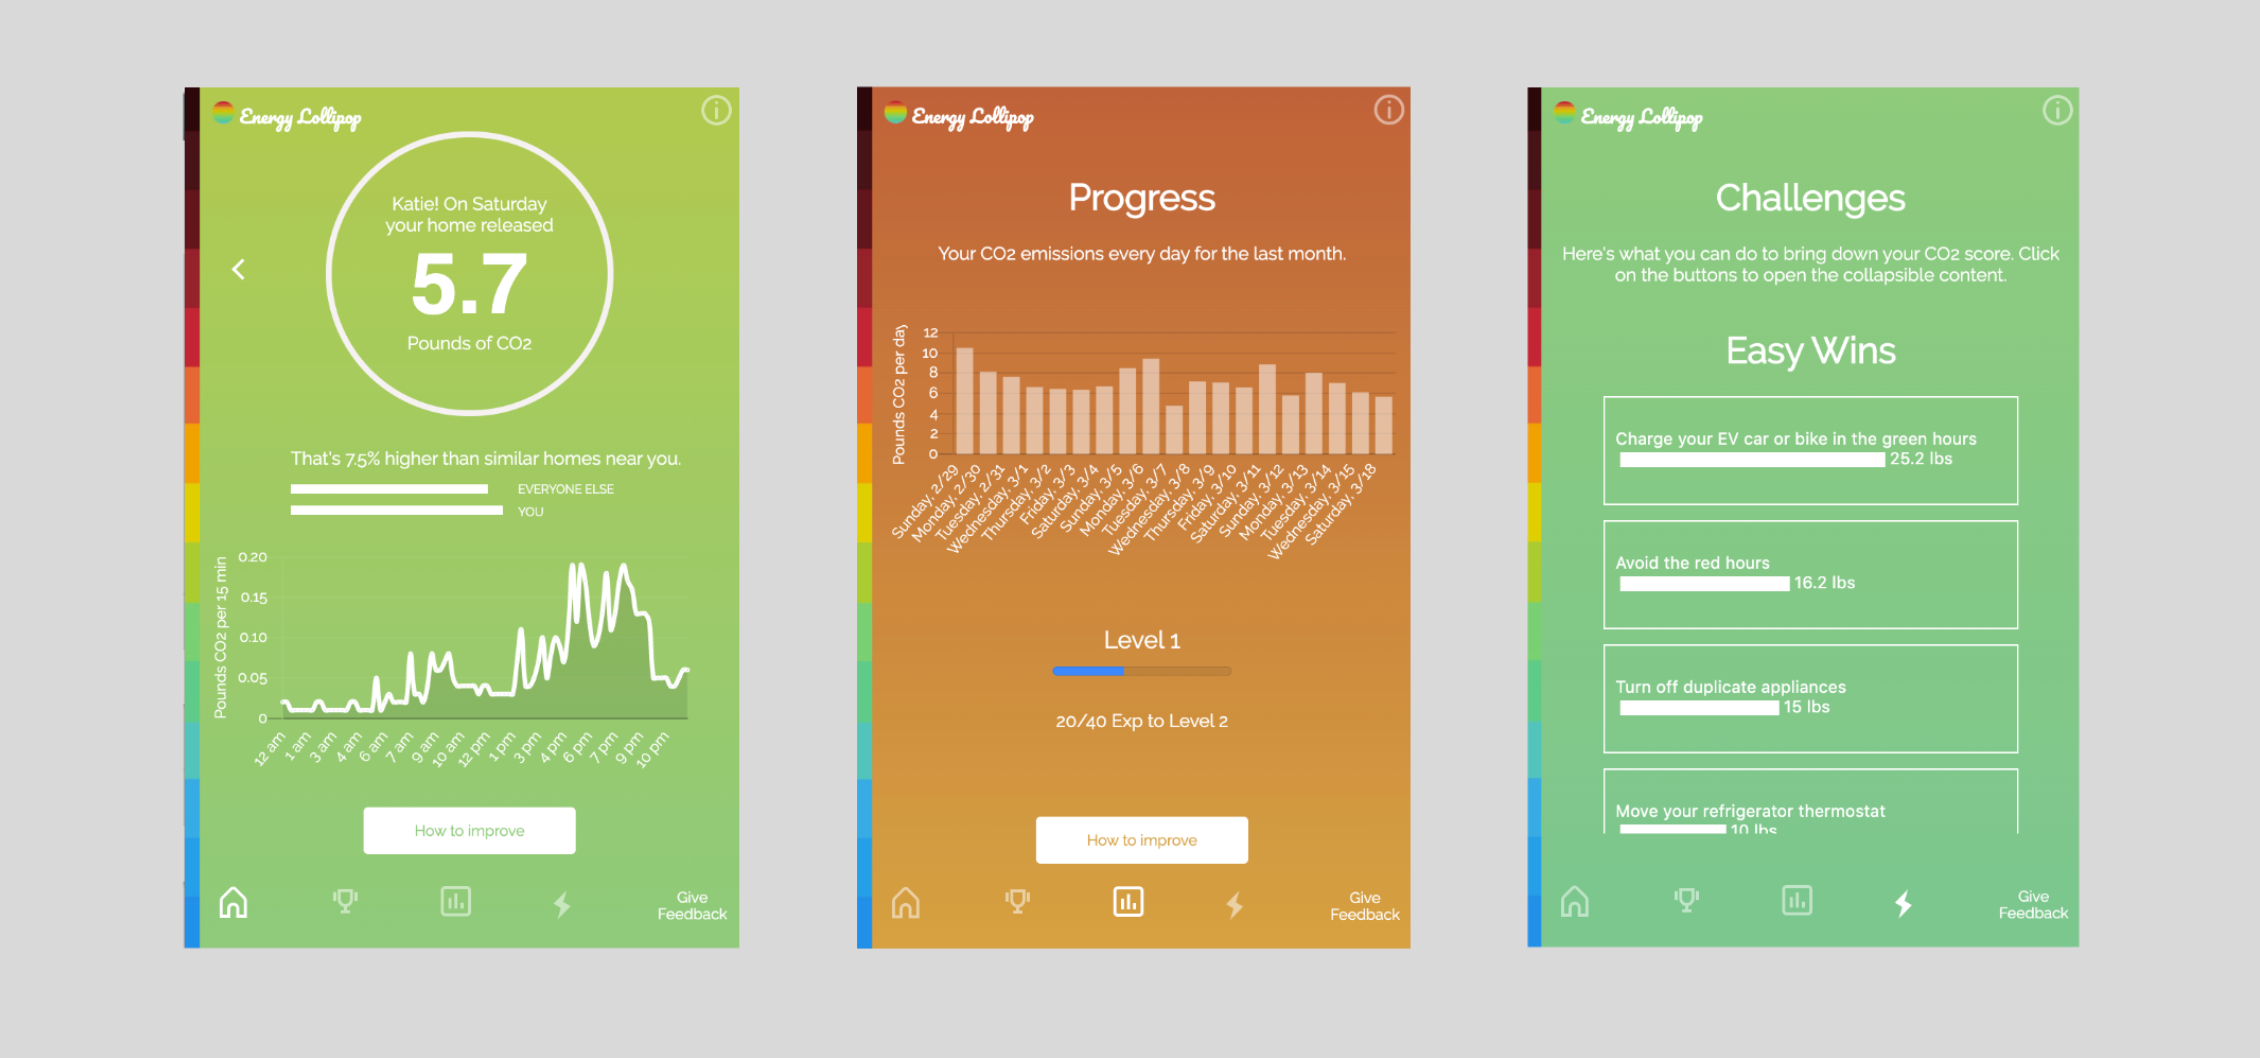
I’ve recently been working on a new startup called Energy Lollipop. It’s a Chrome extension that shows people’s CO2 emissions based on their electricity use. Color is core to the design — and it works. The background changes color based on the user’s kilowatt consumption. Early testing has gotten many users to cut their CO2 by 50 percent in the first week of using it.
我最近一直在从事一家名为Energy Lollipop的新创公司的工作。 这是一个Chrome扩展程序,可根据人们的用电量显示其二氧化碳排放量。 颜色是设计的核心-它可以起作用。 背景根据用户的千瓦消耗而改变颜色。 早期测试已使许多用户在使用它的第一周内将其二氧化碳排放量减少了50%。
彩色LED发出数据信号 (Color LEDs to signal data)
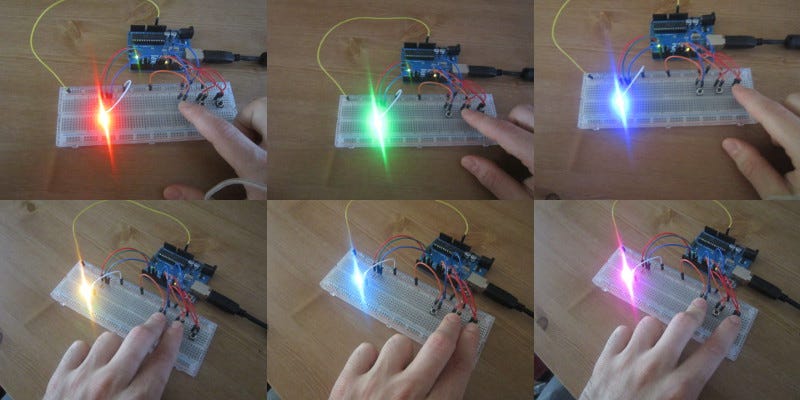
You don’t need to keep your use of color in the two-dimensional world. You can build an electronic display using LED lights and an Arduino micro-controller that lights up and flashes in response to your player’s performance. With electronic parts you can buy on the internet, you can make something bright, colorful, and wonderful that changes people’s behavior, and lights up the world with a data display that is not just meaningful, but beautiful, too.
您无需在二维世界中继续使用颜色。 您可以使用LED灯和Arduino微控制器来构建电子显示器,该Arduino控制器会根据播放器的性能而亮起并闪烁。 借助可以在互联网上购买的电子零件,您可以制作出明亮,色彩鲜艳,奇妙的东西,从而改变人们的行为,并通过不仅有意义而且美观的数据显示点亮整个世界。
都是关于数据和行为的两个方面 (It’s all about the two lenses of data and behavior)
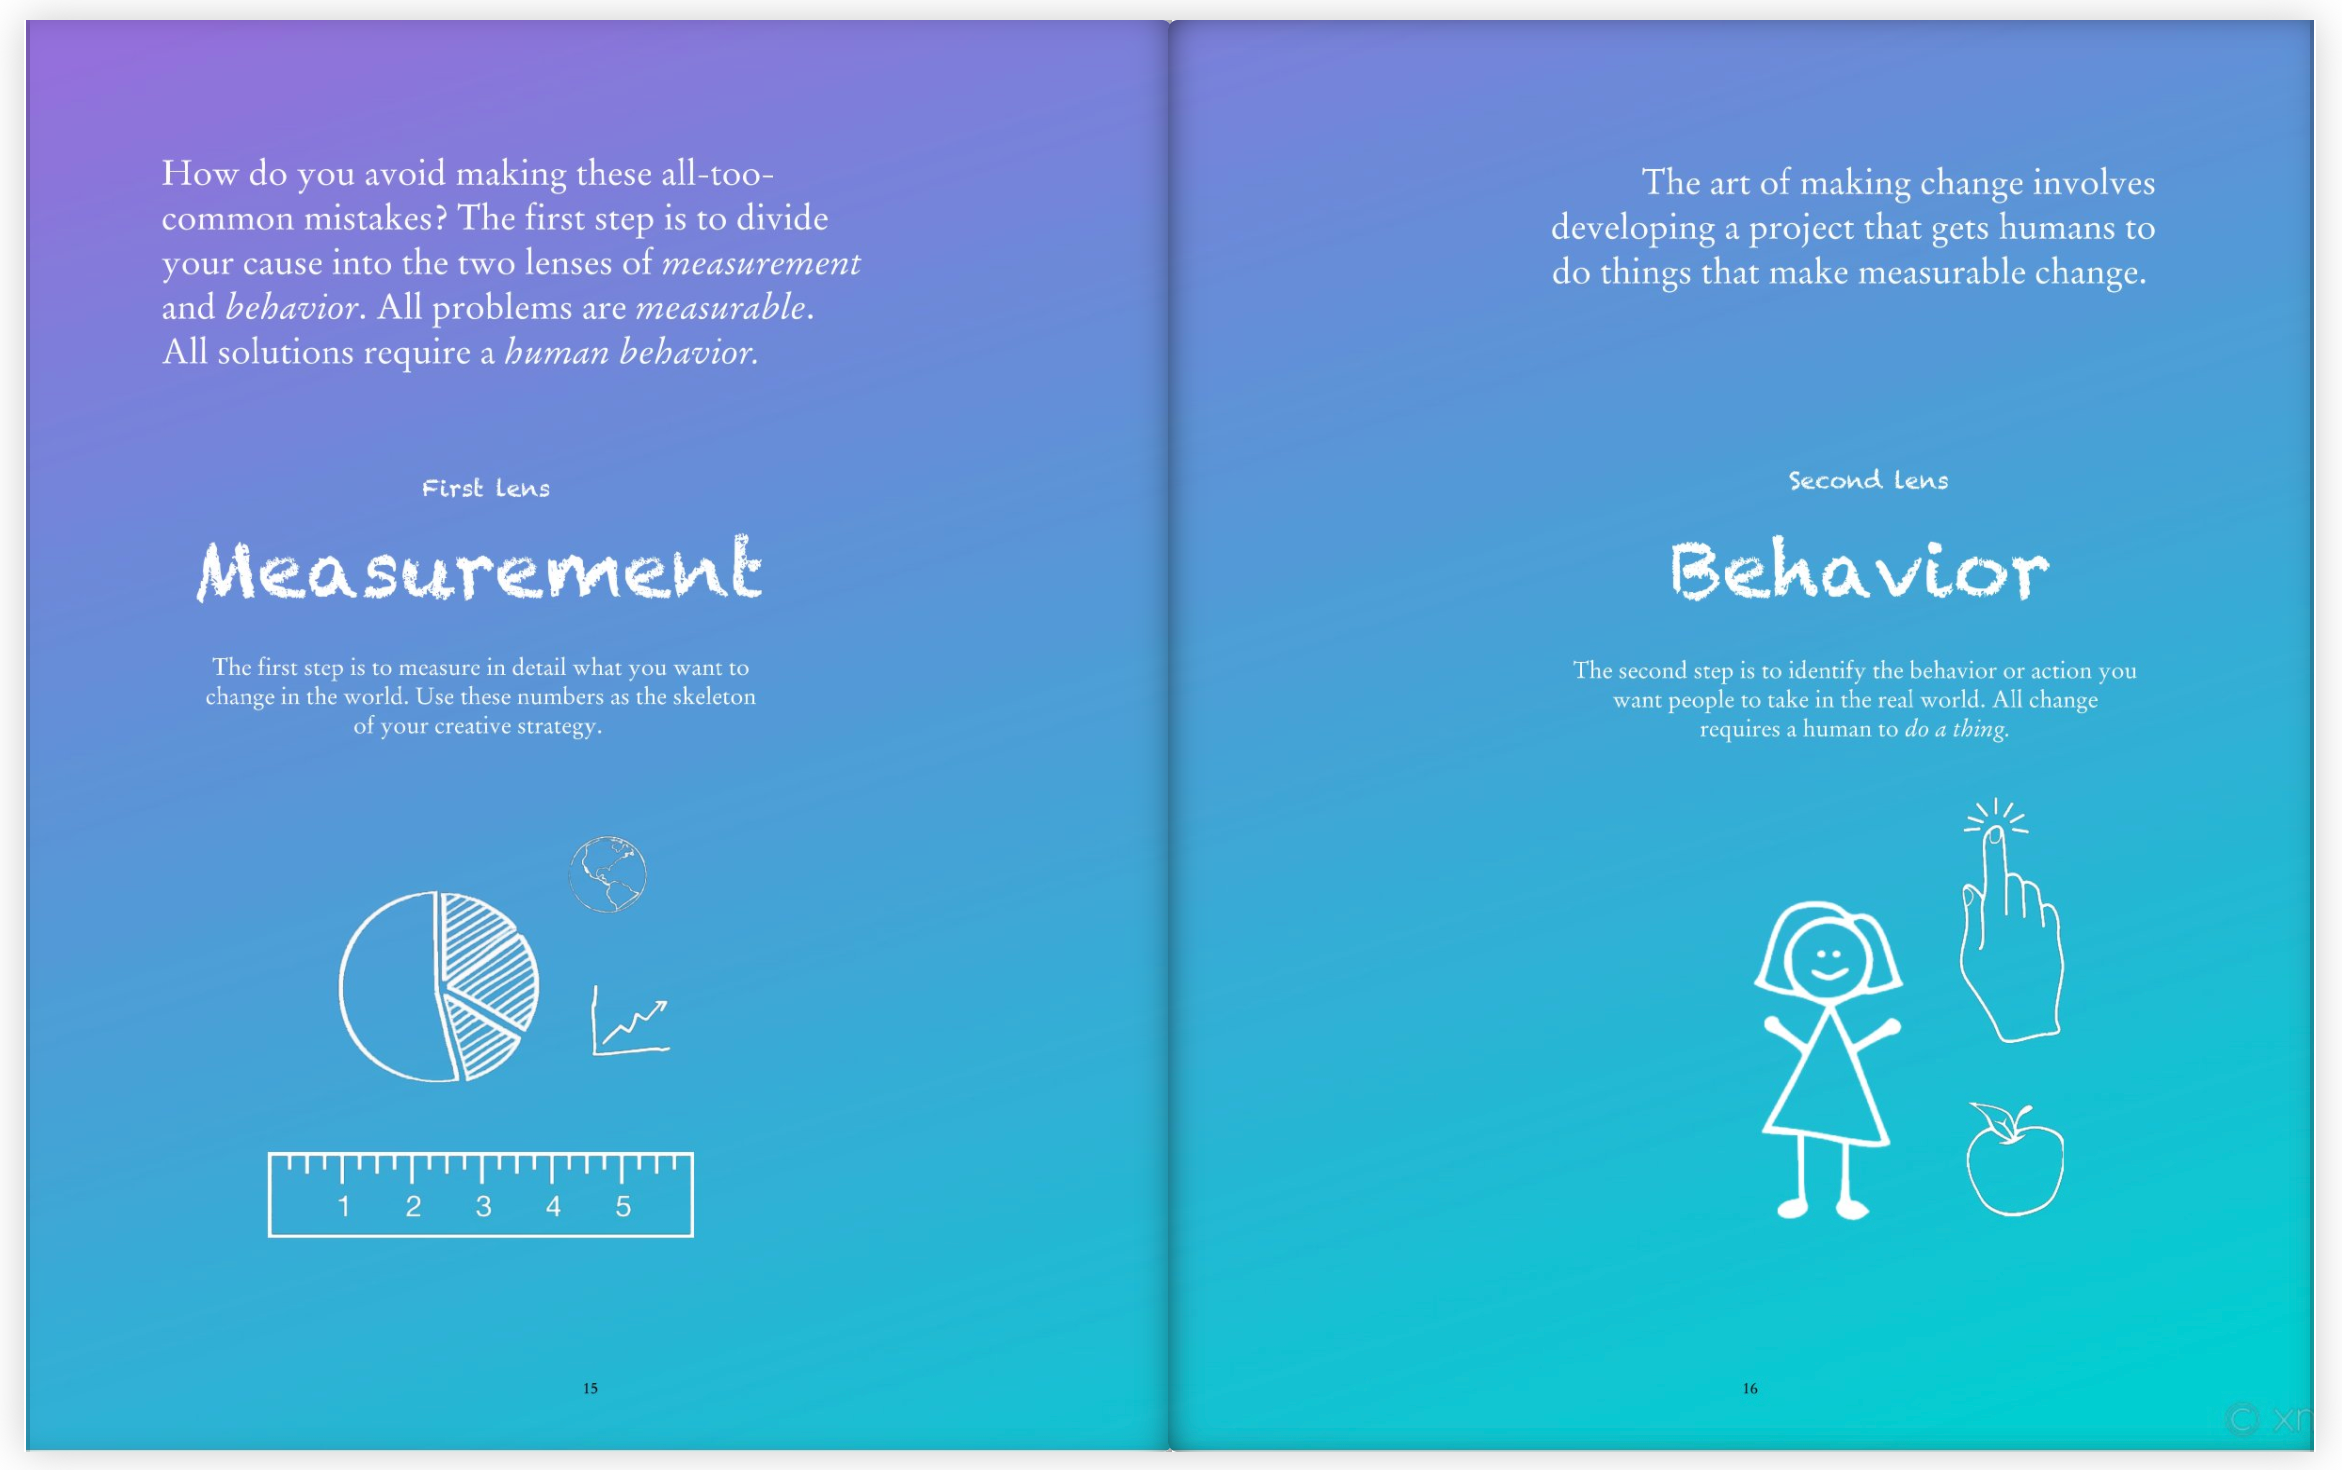
In my book, I added an introductory double-page about this core principle of change: the two lenses. If you want to do design for good that makes a measurable change happen, your project needs to pass the test:
在我的书中,我添加了关于这一核心变革原理的介绍性双页: 两个镜头。 如果您要进行设计并做出可衡量的更改,那么您的项目需要通过测试:
Lense 1: Does your project measurably affect the data you are trying to change?
镜头1:您的项目是否会显着影响您要更改的数据 ?
Lense 2: Is your project designed to get people to do a behavior?
镜头2:您的项目是否旨在让人们做出行为?
If your project doesn’t pass the test, you might not be manifesting any real change at all.
如果您的项目没有通过测试,那么您可能根本不会表现出任何真正的变化。
Color can bind your data to the behavior you want to make happen, and help you influence real humans to do real things that matter so we really can change the world.
颜色可以将您的数据绑定到您想要实现的行为,并帮助您影响真实的人去做重要的事情,这样我们才能真正改变世界。
There is a new world of world-changing craft that weaves together environmental sustainability, game design, and technology — and I find so compelling that I wrote a book about it called How to Save the World. Forbes Magazine ranked it the top five books for social change entrepreneurs. Order your copy today through Indiegogo or get it on Amazon. Connect with me on Twitter, Instagram, and Linkedin.
当今世界正在发生变化的世界,它融合了环境的可持续性,游戏设计和技术,而我感到如此引人入胜,以至于我写了一本名为《 如何拯救世界》的书 。 《福布斯》杂志将其评为社会变革企业家的前五名书籍。 立即通过Indiegogo 订购您的副本 ,或在Amazon上获取。 在Twitter , Instagram和Linkedin上与我联系。
翻译自: https://uxdesign.cc/how-to-use-the-psychology-of-color-for-good-5af30e3927f2
善用工具


 8114
8114

 被折叠的 条评论
为什么被折叠?
被折叠的 条评论
为什么被折叠?
 到【灌水乐园】发言


