


离开手机的一天 天才小熊猫
Pandas is a Python Package specific for data manipulation. This package is inseparable in Data Scientist life and would not give you any harm to learn more about it.
Pandas是特定于数据操作的Python包。 该软件包与Data Scientist的生活密不可分,对您进行更多了解不会给您带来任何伤害。
Previously, in my LinkedIn post, I do a daily post in thirty-days where each day I post a new function and method from Pandas Package I deemed useful. Some ask me to make a summary of it and because of that, I would make an article about it here.
以前,在我的LinkedIn 帖子中 ,我每天发表30天的帖子,每天我都会发布我认为有用的Pandas Package中的新功能和方法 。 有人要求我对其进行总结,因此,我将在此处发表一篇文章。
Keep Reading!
继续阅读!
第一天:style.bar (Day 1: style.bar)
I want to showcase a method from Pandas Data Frame Object calledstyle.bar which allowed you to create a barplot of numerical column inside your Data Frame. You only need to call this method by using the .style.bar after the Data Frame object.
我想展示一种来自Pandas Data Frame Object的名为style.bar的方法,该方法允许您在Data Frame中创建数字列的条形图。 您只需要在Data Frame对象之后使用.style.bar来调用此方法。
This method is useful if you want to give more impact to your data presentation and specify your point more clearly
如果您想对数据表示产生更大的影响并更清楚地指定您的观点,则此方法很有用
#Day 1 style.barimport pandas as pd
import seaborn as snsplanets = sns.load_dataset('planets')planets.head(10)[['method','year', 'distance']].sort_values(by = 'distance').style.bar(color = 'lightblue',                                                                                  subset = 'distance').hide_index()
第2天:qcut (Day 2: qcut)
Today, I want to show you a useful function from pandas to dividing your data called qcut.
今天,我想向您展示一个有用的功能,从熊猫到划分数据,称为qcut 。
What is Pandas Function qcut? qcut function would bin the continuous variable where the bin size would be equal-sized based on rank or based on sample quantile.
什么是Pandas Function qcut ? qcut函数将对连续变量进行分类,其中分类大小将基于等级或基于样本分位数而相等。
So what is quantile? quantile is basically a division technique to divide the continuous value in an equal way. For example, if we divide the continuous value into 4 parts; it would be called Quartile as shown in the picture.
那么什么是分位数? 分位数本质上是一种以相等方式对连续值进行除法的除法技术。 例如,如果我们将连续值分为4部分; 如图所示,它称为四分位数。
#Day 2 qcutimport seaborn as sns
import pandas as pd
mpg = sns.load_dataset('mpg')pd.qcut(x = mpg['mpg'], q = 4, labels = [1,2,3,4])
第三天:pivot_table (Day 3: pivot_table)
In this post, I want to introduce you to one of the most powerful methods called pivot_table.
在本文中,我想向您介绍一种最强大的方法,称为pivot_table。
This method could be accessed in the data frame object by calling the method .pivot_table after the Data Frame object.
可以通过在数据框对象后调用方法.pivot_table在数据框对象中访问此方法。
So what is this method do? It creates a pivot table based on the categorical object we passed on the columns parameter with the values parameter accepting numerical values.
那么这种方法是做什么的呢? 它基于我们在columns参数上传递的类别对象(其中values参数接受数值)创建了数据透视表。
What special about pivot_table is that the result is not just the values but the aggregate function passed on the parameter.
ivot_table的特殊之处在于,结果不仅是值,而且是传递给参数的聚合函数。
You could look at the example picture for more information. I hope it helps!
您可以查看示例图片以获取更多信息。 希望对您有所帮助!
#Day 3 pivot_tableimport pandas as pd
import seaborn as sns
tips = sns.load_dataset('tips')tips.pivot_table(columns = 'sex', values = 'total_bill', aggfunc = 'mean', index = 'size', margins = True)
第四天:agg (Day 4: agg)
Let’s start with an easier method today. Here, I want to introduce a method from the Data Frame object called agg.
让我们从一个更简单的方法开始。 在这里,我想介绍一种来自Data Frame对象的方法,称为agg。
Just like the name, this method creates an aggregation table. It means, we put our intended aggregation in the .agg method and all the numerical columns are processed by the aggregation function which creates the table.
就像名称一样,此方法将创建一个聚合表。 这意味着,我们将预期的聚合放入.agg方法中,所有数字列均由创建表的聚合函数处理。
What is great about this function is that we could put our intended aggregation ourselves by creating our function and the resulted table would be shown just like in the example picture.
此函数的优点在于,我们可以通过创建函数来自己进行预期的聚合,结果表将如示例图片所示。
#Day 4 aggimport pandas as pd
import seaborn as snsmpg = sns.load_dataset('mpg')def mean_divided_by_2(col):
    return (col.mean())/2mpg.agg(['mean', 'std',mean_divided_by_2])
第五天:融化 (Day 5: melt)
I want to introduce you to a peculiar method from the Pandas Data Frame called melt.
我想向您介绍一种来自Pandas Data Frame的独特方法,称为melt。
This method is a reverse from the pivot method when we break down every value and variable to another table.
当我们将每个值和变量分解到另一个表时,此方法与数据透视方法相反。
Just look at the example below, this time I specify the id_vars as a tip column and the value is the sex column. What we get is every value from the tip column and every value from the sex column is paired.
只需看下面的示例,这次我将id_vars指定为tip列,值是sex列。 我们得到的是提示列中的每个值,性别列中的每个值都已配对。
#Day 5 meltimport pandas as pd
import seaborn as sns
tips = sns.load_dataset('tips')tips.melt(id_vars = 'tip', value_vars = 'sex')
第六天:style.applymap (Day 6: style.applymap)
Today, I want to introduce you to an exciting method from Pandas Dataframe called style.applymap.
今天,我想向您介绍一种来自Pandas Dataframe的令人兴奋的方法,称为style.applymap 。
So what is this method do? Well, take a look at the example and you can see some numbers are colored red while others are black. This is happening because we use the style.applymap method.
那么这种方法是做什么的呢? 好吧,看一下示例,您会看到一些数字被涂成红色,而另一些则被涂成黑色。 这是因为我们使用了style.applymap方法。
What this method do is accepting a function in modifying the CSS in our Jupyter Notebook and applied to each and every single value in our Data Frame.
该方法的作用是接受一个功能,用于修改Jupyter Notebook中CSS,并将其应用于数据框中的每个值。
For example, in my example, the function would color the numerical value below and equal to 20. What the function needs to return for each value to change the color is a string with the color specification; e.g. ‘color:red‘.
例如,在我的示例中,该函数将为下面的数字值上色并等于20。该函数需要为每个值返回以更改颜色的是带有颜色说明的字符串。 例如' color:red '。
#Day 6 style.applymapimport pandas as pd
import seaborn as snsmpg = sns.load_dataset('mpg')def mean_divided_by_2(col):
    return (col.mean())/2mpg.agg(['mean', 'std',mean_divided_by_2])
第七天:select_dtypes (Day 7: select_dtypes)
I want to share a simple yet powerful method from Pandas Data Frame called .select_dtypes.
我想分享一个来自Pandas Data Frame的简单而强大的方法,叫做.select_dtypes 。
During data cleansing and engineering, I often use this method and would have a hard time without .select_dtypes method.
在数据清理和工程设计期间,我经常使用此方法,并且如果没有.select_dtypes方法,将很难。
So, what is this method did? It is simple, this method is used to select the columns in our Data Frame based on the specific data type. For example ‘number’ or ‘object’.
那么,这种方法做了什么呢? 很简单,此方法用于根据特定数据类型在数据框中选择列。 例如“数字”或“对象”。
In the example, I showed you I pass ‘number’ data type to the method; this means I only selecting the numerical columns (either float or integer). The other example I use is ‘object’ which means I selecting only the object columns.
在示例中,我向您展示了我将“数字”数据类型传递给该方法。 这意味着我只选择数字列(浮点数或整数)。 我使用的另一个示例是“对象”,这意味着我仅选择对象列。
#Day 7 select_dtypesimport seaborn as sns
import pandas as pd
mpg = sns.load_dataset('mpg')#Selecting the number data type
mpg.select_dtypes('number')#Selecting the object data type
mpg.select_dtypes('object')
第8天:style.hide_ (Day 8: style.hide_)
Today I want to introduce you to a simple method yet useful, especially for presentation. The methods are style.hide_index and style.hide_columns.
今天,我想向您介绍一个简单但有用的方法,特别是用于演示。 方法是style.hide_index和style.hide_columns。
So, just by the methods name, I think you could guess that the function is used to hide the index and/or the columns.
因此,仅凭方法名称,我想您就可以猜到该函数用于隐藏索引和/或列。
From the example, you could see I hide both the Data Frame index and the Data Frame columns (by passing the columns name).
从示例中,您可以看到我同时隐藏了数据框架索引和数据框架列(通过传递列名称)。
I hope it helps!
希望对您有所帮助!
#Day 8 style.hide_import seaborn as sns
import pandas as pd
mpg = sns.load_dataset('mpg')mpg.head(10).style.hide_index().hide_columns(['mpg', 'name', 'model_year'])
第9天:Corr (Day 9: corr)
Okay, I am quite sure many people know the .corr method from the Data Frame object.
好的,我敢肯定,很多人都从Data Frame对象知道.corr方法。
Well, if you don’t know what it is; .corr is a method to automatically calculate the correlation between two numerical variables and present the result as a matrix plot.
好吧,如果您不知道那是什么, .corr是一种自动计算两个数值变量之间的相关性并将结果显示为矩阵图的方法。
By default, the .corr method had three correlation method calculation; Pearson, Spearman, and Kendall. However, did you know that you could use your own correlation function calculation?
默认情况下,.corr方法具有三种相关方法计算; 皮尔逊,斯皮尔曼和肯德尔。 但是,您知道您可以使用自己的相关函数计算吗?
In the example, I create my own function from the scipy.stats weightedtau to create a weighted_tau correlation calculation. What we need for the .corr method to work is a function that accepting two-parameter and return a float object.
在示例中,我从scipy.stats weightedtau创建自己的函数,以创建weighted_tau相关计算。 .corr方法工作所需的功能是接受两个参数并返回一个float对象。
I hope it helps!
希望对您有所帮助!
#Day 9 corrimport pandas as pd
import seaborn as sns
from scipy.stats import weightedtaudef weight_tau(x, y):
    return weightedtau(x, y)[0]tips= sns.load_dataset('tips')
tips.corr(weight_tau)
第十天:更换 (Day 10: replace)
Today, I want to introduce you to the Data Frame object method called .replace.
今天,我想向您介绍称为.replace的数据框对象方法。
So, this method is just like what the name implies; it used to replace something, but what?
因此,此方法就像名称中所暗示的一样; 它曾经用来代替某些东西,但是呢?
The main things that this method does are to replace values; yes, values within columns.
该方法的主要作用是替换值。 是的,列中的值。
From the example, you could see that I replace the value by passing a dictionary object within the method. So the logic in my example is: {columns name: {values you want to replace: values to replace}}.
从示例中,您可以看到我通过在方法内传递一个字典对象来替换该值。 因此,在我的示例中,逻辑是: {columns name: {values you want to replace: values to replace}} 。
#Day 10 replaceimport pandas as pd
import seaborn as snsmpg = sns.load_dataset('mpg')
mpg.replace({'cylinders' : {3: 'Three', 4: 'Four', 5: 'Five', 6: 'Six', 8 : 'Eight'}}, inplace = True)
mpg.head()
第11天:历史 (Day 11: hist)
Well, I want to introduce you to a cool method from the Pandas Series object called .hist.
好吧,我想向您介绍一个叫做.hist的Pandas Series对象的酷方法。
So, this method work is simple; It creates a histogram plot from your numerical series object. Simple, right?
因此,这种方法的工作很简单; 它从您的数字序列对象创建直方图。 简单吧?
You only need to call it and it automatically creates your histogram plot just like in the example.
您只需要调用它,它就会像示例中一样自动创建直方图。
#Day 11 histimport seaborn as sns
import pandas as pd
mpg = sns.load_dataset('mpg')mpg['mpg'].hist()
第12天:get_dummies (Day 12: get_dummies)
I want to introduce you to a special function from Pandas called get_dummies.
我想向您介绍一个来自熊猫的特殊函数,称为get_dummies。
From the example, you might get what it does, but for you doesn’t; this method is more known as One Hot Encoding or OHE.
从该示例中,您可能会了解它的作用,但对您而言却没有; 这种方法被称为一种热编码或OHE。
The get_dummies function is used to create new features based on the categorical class in one variable with the value of the new features is 0 or 1; 0 mean not present, 1 mean present.
get_dummies函数用于基于类别中的一个变量创建新功能,新功能的值为0或1; 0表示不存在,1表示存在。
One Hot Encoding mostly used when you need to transform your categorical data into numerical.
当需要将分类数据转换为数值时,通常使用一种热编码。
#Day 12 get_dummiesimport pandas as pd
import seaborn as snsmpg = sns.load_dataset('mpg')
pd.get_dummies(mpg['origin'])
第13天:查询 (Day 13: query)
I want to introduce you to a cool Data Frame Method called .query.
我想向您介绍一个名为.query的酷数据框方法。
So, what is this method do? Well, this method allows selection using a string expression. What is it means?
那么,这种方法有什么用呢? 好的,此方法允许使用字符串表达式进行选择。 什么意思
Look at the example picture, it is like some selection with conditions right? It is a boolean based selection method. after all.
看一下示例图片,就像一些有条件的选择吧? 这是一种基于布尔的选择方法。 毕竟。
In the example table, we often need to specify the condition to selection like mpg[(mpg['mpg'] <=11) & (mpg['origin] == 'usa')], but with query it was all simplified. Just pass a string condition to the method and we get the same selection result.
在示例表中,我们经常需要指定选择条件,例如mpg[(mpg['mpg'] <=11) & (mpg['origin] == 'usa')] ,但是通过查询,这些条件都得到了简化。 只需将字符串条件传递给该方法,我们将获得相同的选择结果。
#Day 13 queryimport pandas as pd
import seaborn as snsmpg = sns.load_dataset('mpg')
mpg.query("mpg <= 11 & origin == 'usa'")
第14天:面膜 (Day 14: mask)
I want to introduce you to an if-then method called .mask.
我想向您介绍一个名为.mask的if-then方法。
So what is this method do? It is used to replace specific values with another value that meets the condition given.
那么这种方法是做什么的呢? 它用于用满足给定条件的另一个值替换特定值。
Let’s see in my example, I pass a condition where the values of the mpg are less than 20 then replace it with ‘More than Twenty’. How cool is that!
让我们看一下我的示例,我通过了一个条件,其中mpg的值小于20,然后将其替换为“大于20”。 多么酷啊!
#Day 14 maskimport pandas as pd
import seaborn as snsmpg = sns.load_dataset('mpg')
mpg['mpg'].mask(mpg['mpg'] < 20, 'More than Twenty' )
第15天:交叉表 (Day 15: crosstab)
Halfway there, and so today I want to introduce you to a table formatting function called crosstab.
到了一半,所以今天我想向您介绍称为交叉表的表格式化功能。
So, what is this function do? this function would help us to create a pivot table of categorical classes with an aggregation function of a numerical column as the values, although you could also create a count between categorical classes as well.
那么,这个功能是做什么的呢? 此函数将帮助我们创建一个分类类的数据透视表,其中将数字列的聚合函数作为值,尽管您也可以在分类类之间创建一个计数。
Look at the example, you could see I specify the origin and model_year (both are categorical) as the index and column respectively. In addition, I make the mpg column as the numerical values and using the mean as the aggregation function.
查看示例,您可以看到我分别将origin和model_year(均为分类)指定为index和column。 另外,我将mpg列作为数值,并将平均值用作聚合函数。
#Day 15 crosstabimport pandas as pd
import seaborn as snsmpg = sns.load_dataset('mpg')
pd.crosstab(index = mpg['origin'], columns = mpg['model_year'], values = mpg['mpg'], aggfunc = 'mean' )
第16天:申请 (Day 16: apply)
The apply pandas method is a method that I use so often during my analysis time, I become accustomed to how neat it is. The Pandas Data Frame method is .apply.
apply pandas方法是我在分析期间经常使用的方法,我已经习惯了它的简洁性。 熊猫数据框方法为.apply。
This method accepting a function and applied it to the whole data (either in row ways or columns way). What the function return is the result.
此方法接受一个函数并将其应用于整个数据(以行方式或列方式)。 函数返回的是结果。
Just look at the example, I am applying a lambda function which returns the length of each data value.
仅看示例,我正在应用一个lambda函数,该函数返回每个数据值的长度。
#Day 16 applyimport pandas as pd
import seaborn as snsmpg = sns.load_dataset('mpg')
mpg['name'].apply(lambda x: len(str(x)))
第17天:set_option (Day 17: set_option)
Today I want to introduce you to a special function of pandas. This function is called .set_option.
今天,我想向您介绍熊猫的特殊功能。 此功能称为.set_option。
What is this function? So, this function is not directly you applied to your data but it affecting the object itself.
这个功能是什么? 因此,此功能不是直接应用于数据,而是会影响对象本身。
Let’s see the example below, I pass the string to set the maximum columns and maximum rows that are shown in the notebook. You could read all the options here.
让我们看下面的示例,我传递字符串以设置笔记本中显示的最大列和最大行。 您可以在此处阅读所有选项。
I hope it helps!
希望对您有所帮助!
#Day 17 set_optionimport pandas as pd
import seaborn as sns
pd.set_option('display.max_columns', None)
pd.set_option('display.max_rows', 50)mpg = sns.load_dataset('mpg')
mpg
第18天:描述 (Day 18: describe)
I just want to show you to one of the most known methods from Pandas Data Frame Object called .describe.
我只想向您展示Pandas Data Frame Object中最著名的方法之一,它称为.describe 。
I am betting that most people who start their journey in data science with Python know about this method. For you who does not, this method is a method which produces a Data Frame with all the basic statistic.
我敢打赌,大多数使用Python开始数据科学之旅的人都知道这种方法。 对于没有的人,此方法是一种生成具有所有基本统计信息的数据框的方法。
Although, there is a little trick in this API. By default, describe only calculate all the numerical columns which in turn giving you information such as the mean, std, percentiles, etc.
虽然,此API有一些技巧。 默认情况下,describe只计算所有数值列,这些列又会为您提供诸如均值,std,百分位数等信息。
However, if you exclude the numerical columns like in the sample, you would end up with a different Data Frame. This time, the non-numerical column would be calculated. Here, what we get are the frequency and top classes.
但是,如果像示例中那样排除数字列,则最终将获得不同的数据框。 这次将计算非数值列。 在这里,我们得到的是频率和最高等级。
#Day 18 describeimport pandas as pd
import seaborn as snsmpg = sns.load_dataset('mpg')#Describe numerical columns
mpg.describe()#Describe non-numerical columns
mpg.describe(exclude = 'number')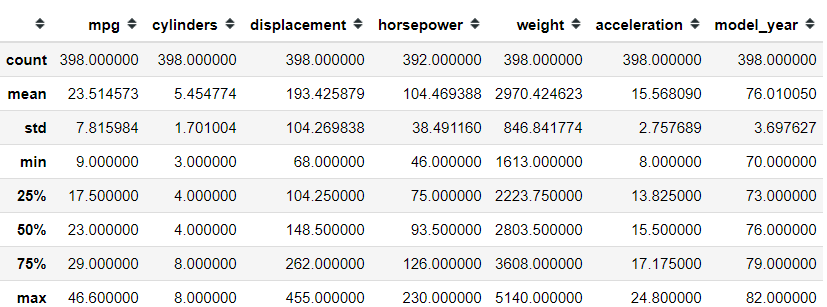

第19天:分解 (Day 19: factorize)
I want to introduce you to one of the useful Pandas function and the series method called factorize.
我想向您介绍有用的Pandas函数之一和称为factorize的系列方法。
Take a look at the example first, here I take the categorical variable origin and using the factorize method on it. What is the result? There are 2 things, the numerical array, and the unique classes.
首先来看一个例子,这里我使用分类变量origin,并在其上使用factorize方法。 结果是什么? 有两件事,数值数组和唯一类。
So what is special about this method? The numerical array you just see is the classes in the categorical variable encoded as a numerical value. How to know which number represents what class? That is why we also get unique classes.
那么这种方法有什么特别之处呢? 您刚刚看到的数字数组是分类变量中编码为数值的类。 如何知道哪个数字代表什么班级? 这就是为什么我们还会获得唯一的类。
In the sample below 0 is usa, 1 is japan, and 2 is europe. Just like the unique position.
在下面的样本中,0是美国,1是日本,2是欧洲。 就像独特的位置一样。
This function is most useful when you need to encode the categorical into numerical values, but when there is an ordinal assumption in there.
当您需要将分类编码为数值时,但是其中存在序数假设时,此功能最有用。
#Day 19 factorizeimport pandas as pd
import seaborn as snsmpg = sns.load_dataset('mpg')
mpg['origin'].factorize()
第20天:plotting.radviz (Day 20: plotting.radviz)
On the 20th day, I want to introduce a plotting function from Pandas called pd.plotting.radviz.
在第20天,我想介绍一个来自Pandas的绘图功能,称为pd.plotting.radviz。
So, what is this function do? According to Pandas, radviz allows us to project an N-dimensional data set into a 2D space where the influence of each dimension can be interpreted as a balance between the influence of all dimensions.
那么,这个功能是做什么的呢? 根据Pandas的说法,radviz允许我们将N维数据集投影到2D空间中,其中每个维的影响可以解释为所有维的影响之间的平衡。
In a simpler term, it means we could project a multi-dimensional data into a 2D space in a primitive way.
用简单的术语来说,这意味着我们可以以原始方式将多维数据投影到2D空间中。
Each Series in the DataFrame is represented as an evenly distributed slice on a circle. Just look at the example, there is a circle with the series name.
DataFrame中的每个Series均表示为圆上均匀分布的切片。 仅看示例,一个带有系列名称的圆圈。
Each data point is rendered in the circle according to the value on each Series. Highly correlated Series in the DataFrame are placed closer on the unit circle.
每个数据点根据每个Series上的值绘制在圆圈中。 DataFrame中高度相关的Series位于单位圆上。
To use thepd.plotting.radviz, you need a multidimensional data set with all numerical columns but one as the class column (should be categorical).
要使用pd.plotting.radviz ,您需要一个多维数据集,其中包含所有数字列,但其中一个作为类列(应为分类列)。
#Day 20 plotting.radvizimport pandas as pd
import seaborn as snsmpg = sns.load_dataset('mpg')
pd.plotting.radviz(mpg.drop(['name'], axis =1), 'origin')
第21天:scatter_matrix (Day 21: scatter_matrix)
Today is another plotting function of Pandas that I want to introduce. This time, the function is called plotting.scatter_matrix.
今天要介绍的是熊猫的另一种绘图功能。 这次,该函数称为plotting.scatter_matrix。
This is a simple function but quite useful in our data analysis life. The main thing is simple, it creates a scatter plot between all the numerical variables within your data frame.
这是一个简单的功能,但在我们的数据分析过程中非常有用。 最主要的事情很简单,它会在数据框中的所有数字变量之间创建一个散点图。
For the plot in the diagonal position (the variable within themselves) would be a distribution plot (either histogram or KDE).
对于在对角线位置的图(自身内的变量)将是分布图(直方图或KDE)。
How to use the function is simple, you only need to pass the data frame variable to the function and it would automatically detect the numerical columns.
该函数的使用方法很简单,只需将数据框变量传递给该函数,它将自动检测数字列。
#Day 21 scatter_matrix
import pandas as pd
import seaborn as sns
import matplotlib.pyplot as pltmpg = sns.load_dataset('mpg')
pd.plotting.scatter_matrix(mpg, figsize = (8,8))
plt.show()
第22天:plotting.boxplot (Day 22: plotting.boxplot)
I want to introduce a simple method to create a boxplot from the series object called plotting.boxplot.
我想介绍一个简单的方法,从名为plotting.boxplot的系列对象创建箱形图。
If you did not know boxplot is, quoting from the Pandas guide boxplot is “a method for graphically depicting groups of numerical data through their quartiles. The box extends from the Q1 to Q3 quartile values of the data, with a line at the median (Q2). The whiskers extend from the edges of the box to show the range of the data. By default, they extend no more than 1.5 * IQR (IQR = Q3 — Q1) from the edges of the box, ending at the farthest data point within that interval. Outliers are plotted as separate dots”.
如果您不知道箱线图是什么,那么引用《熊猫指南》中的箱线图是“一种通过四分位数以图形方式描绘数字数据组的方法。 该框从数据的Q1四分位数扩展到Q3四分位数,中间有一条线(Q2)。 晶须从框的边缘伸出以显示数据范围。 默认情况下,它们从框的边缘开始延伸的距离不超过1.5 * IQR(IQR = Q3 — Q1),终止于该间隔内最远的数据点。 离群值绘制为单独的点”。
You only need to pass the series or the data frame, and the numerical columns would be plotted automatically.
您只需要传递序列或数据框,数字列就会自动绘制。
#Day 22 plotting.boxplotimport pandas as pd
import seaborn as sns
import matplotlib.pyplot as pltmpg = sns.load_dataset('mpg')
pd.plotting.boxplot(mpg['mpg'])
第23天:任何 (Day 23: any)
I would introduce you to a simple yet useful Series and DataFrame method called .any.
我将向您介绍一个简单而有用的Series和DataFrame方法,称为.any。
What is this method do? So, .any would return a boolean value where it would return True if any of the element is True and returns False if there is no True boolean in the series or column.
这个方法是做什么的? 因此,.any将返回一个布尔值,如果任何元素为True,它将返回True,如果系列或列中没有True布尔值,则返回False。
It is most useful when we want to check if there are missing values in our dataset. Just look at the example, we chained .isna with .any. Only the horsepower return True because there is a missing data present in this column.
当我们要检查数据集中是否缺少值时,这是最有用的。 仅看示例,我们将.isna与.any链接在一起。 由于此列中缺少数据,因此只有马力返回True。
#Day 23 anyimport pandas as pd
import seaborn as sns
import matplotlib.pyplot as pltmpg = sns.load_dataset('mpg')
mpg.isna().any()
第24天:哪里 (Day 24: where)
I want to introduce you to a DataFrame method similar to the one I post previously called .where.
我想向您介绍一种DataFrame方法,该方法类似于我以前发布的.where方法。
So, this method inversely works compared to the .mask method I post before. Basically it is a method which accepting condition and the one values that did not fill the condition would be replaced.
因此,与我之前发布的.mask方法相比,此方法相反。 基本上,这是一种接受条件的方法,将替换不满足条件的一个值。
Just look at the example, I give criteria to look for values below 20 and any values below 20 would keep their values, otherwise, it would be replaced by “More than Twenty”.
仅看示例,我给出了寻找小于20的值的标准,而小于20的任何值将保留其值,否则,将其替换为“大于20”。
#Day 24 whereimport pandas as pd
import seaborn as snsmpg = sns.load_dataset('mpg')
mpg['mpg'].where(mpg['mpg'] < 20, 'More than Twenty' )
第25天:移调 (Day 25: Transpose)
Today is I would show you a simple yet useful method from DataFrame object called .transpose or .T.
今天,我将向您展示一个来自DataFrame对象的简单而有用的方法,该方法称为.transpose或.T。
This method is simple, by executing the .transpose method we would switch the Data Frame columns to become index and the index would become the Data Frame columns.
此方法很简单,通过执行.transpose方法,我们可以将Data Frame列切换为索引,而索引将变为Data Frame列。
Just look at the example, we have a Data Frame with all the position switched around. This function is useful when we want our rows to become a column-wise or vice versa.
仅看示例,我们就有一个数据框,所有位置都在变化。 当我们希望我们的行成为按列的行时,反之亦然。
I hope it helps!
希望对您有所帮助!
#Day 25 transposeimport pandas as pd
import seaborn as snsmpg = sns.load_dataset('mpg')
mpg.transpose()
#or mpg.T
第26天:plot.scatter (Day 26: plot.scatter)
Today I want to introduce a quick plotting method from pandas DataFrame object called plot.scatter.
今天,我想介绍一种来自pandas DataFrame对象的快速绘图方法,该对象称为plot.scatter。
I am sure many people many know what is scatter plot is, although for you who doesn’t know; it is basically a plot where we plot every data in 2 different numerical columns in which the values are visualized in the plot.
我敢肯定,很多人都知道什么是散点图,尽管对于您不知道的人而言; 它基本上是一个绘图,在其中我们将每个数据绘制在2个不同的数字列中,其中的值在图表中可视化。
We could create a quick scatter plot just by using .plot.scatter in the Data Frame object and pass 2 columns name you want.
我们可以通过在Data Frame对象中使用.plot.scatter并创建所需的2列名称来创建快速散点图。
#Day 26 plot.scatterimport pandas as pd
import seaborn as snsmpg = sns.load_dataset('mpg')
mpg.plot.scatter('mpg', 'weight')
第27天:转型 (Day 27: transform)
Today, I want to introduce a method from the Series and Data Frame object called .transform.
今天,我想介绍一个来自Series and Data Frame对象的方法,称为.transform 。
It is a simple function but powerful. The main premise of this function is we pass a function or the aggregation string name and the function is applied to all of the values.
它是一个简单的功能,但功能强大。 该函数的主要前提是我们传递一个函数或聚合字符串名称,并且该函数将应用于所有值。
If you used it in the DataFrame object, the function would be applied to every value in every column.
如果在DataFrame对象中使用了该函数,则该函数将应用于每个列中的每个值。
#Day 27 transformimport pandas as pd
import seaborn as snsmpg = sns.load_dataset('mpg')
mpg['mpg'].transform(lambda x: x/2)
第28天:bootstrap_plot (Day 28: bootstrap_plot)
Today I want to introduce a unique plotting function from Pandas called .bootstrap_plot.
今天,我想介绍一个来自Pandas的独特绘图功能,即.bootstrap_plot 。
According to Pandas, the bootstrap plot is used to estimate the uncertainty of a statistic by relying on random sampling with replacement.
根据Pandas的说法,引导程序图依赖于随机抽样和替换来估计统计的不确定性。
In simpler words, it is used to trying to determine the uncertainty in fundamental statistics such as mean and median by resampling the data with replacement (you could sample the same data multiple times).
简而言之,它用于尝试通过替换对数据进行重采样来确定基本统计数据(例如均值和中位数)中的不确定性(您可以多次采样相同的数据)。
The boostrap_plot function will generate bootstrapping plots for mean, median, and mid-range statistics for the given number of samples of the given size. Just like in the example below.
boostrap_plot函数将为给定大小的给定数量的样本生成均值,中值和中间范围统计量的自举图。 就像下面的例子一样。
#Day 28 bootstrap_plot
import pandas as pd
import seaborn as snsmpg = sns.load_dataset('mpg')
pd.plotting.bootstrap_plot(mpg['mpg'], size = 50, samples = 500)
plt.show()
第29天:烟斗 (Day 29: pipe)
In today’s pandas post, I want to introduce a method that I encourage people to use more often. The method is .pipe.
在今天的熊猫文章中,我想介绍一种鼓励人们更多使用的方法。 该方法是.pipe。
So, Pandas encouraged us to use a method chaining to manipulate our data. Normally we would chaining method by passing function in function or method with the method after.
因此,Pandas鼓励我们使用方法链来操纵数据。 通常,我们通过在函数中传递函数或在方法之后传递方法来链接方法。
With .pipe function, the chaining method in Pandas DataFrame could decrease the line we write and execute the function faster.
使用.pipe函数,Pandas DataFrame中的链接方法可以减少我们编写的行并更快地执行该函数。
The example of the .pipe method is in the picture below. I create two different functions and chain the method by executing the .pipe twice. This in order to create a chain method and faster execution.
下图显示了.pipe方法的示例。 我创建了两个不同的函数,并通过两次执行.pipe来链接方法。 这样才能创建链式方法并更快地执行。
#Day 29 pipeimport pandas as pd
import seaborn as snsmpg = sns.load_dataset('mpg')#Function to extract the car first name and create a new column called car_first_name
def extract_car_first_name(df):
    df['car_first_name'] = df['name'].str.split(' ').str.get(0)
    return df#Function to add my_name after the car_first_name and create a new column called car_and_name
def add_car_my_name(df, my_name = None):
    df['car_and_name'] = df['car_first_name'] + my_name

mpg.pipe(extract_car_first_name).pipe(add_car_my_name, my_name = 'Cornellius')mpg.head()
第30天:show_versions (Day 30: show_versions)
On the last day, I want to show you a special function from pandas called .show_versions. Well, what is this function do?
在最后一天,我想向您展示一个名为.show_versions的熊猫特殊功能。 那么,这个功能是做什么的?
The function giving us info about the hosting operation system, pandas version, and versions of other installed relative packages. It provides useful information especially when you messing around with related packages and also important for bug reports.
该函数为我们提供有关托管操作系统,熊猫版本以及其他已安装相对软件包版本的信息。 它提供了有用的信息,尤其是在您弄乱相关的软件包时,并且对于错误报告也很重要。
#Day 30 show_versionsimport pandas as pdpd.show_versions(True)
结论 (Conclusion)
So. That is all of my 30 days of pandas post. It was quite a fun and insightful activity for me. I enjoyed creating content like this for people and I hope it was useful for anybody that I have reached.
所以。 那就是我30天的大熊猫发布日。 对我来说,这是一个有趣而有见地的活动。 我喜欢为人们创建这样的内容,希望它对我接触的任何人都有用。
翻译自: https://towardsdatascience.com/30-days-of-pandas-in-an-article-b328cfb83d50
离开手机的一天 天才小熊猫


 4731
4731

 被折叠的 条评论
为什么被折叠?
被折叠的 条评论
为什么被折叠?
 到【灌水乐园】发言


