


fast.ai
This is the fourth part of the Self-Organizing Maps with fast.ai article series.
All the code has been published in this repository and this PyPi library.
总览 (Overview)
Many datasets come in tabular form. For this reason, Fast.ai has a handy Tabular subclass for its DataBunch that can natively perform categorization and handle continuous and categorical features.
许多数据集以表格形式出现。 因此,Fast.ai的DataBunch拥有一个方便的Tabular子类,该子类可以本地执行分类并处理连续和分类特征。
In this article, we will use TabularDataBunch as a starting point to load our data, and then build a conversion function to move it into our UnsupervisedDataBunch.
在本文中,我们将使用TabularDataBunch作为加载数据的起点,然后构建转换函数以将其移至UnsupervisedDataBunch 。
The main features we’re going to re-implement are:
我们将重新实现的主要功能是:
- Normalization 正常化
- Categorical feature encoding 分类特征编码
- Export of the SOM codebook into a Pandas DataFrame 将SOM代码本导出到Pandas DataFrame中
正常化 (Normalization)
We will use a separate Normalizer class to perform per-feature normalization. Let’s define a base class:
我们将使用单独的Normalizer类来执行每个功能的归一化。 让我们定义一个基类:
While comparing different normalizers, I found out that normalizing by mean and standard deviation helps a lot with SOM convergence, so we’ll extend our Normalizer class into a VarianceNormalizer:
在比较不同的规范化器时,我发现通过均值和标准差进行规范化对于SOM收敛有很大帮助,因此我们将我们的Normalizer类扩展为VarianceNormalizer :
Note that we also implemented the denormalization function. Since we are normalizing our data, the trained SOM codebook will contain normalized data points: we will need denormalization in order to retrieve values in the initial data range.
请注意,我们还实现了非规范化功能。 由于我们正在对数据进行归一化,因此训练有素的SOM代码簿将包含归一化的数据点:我们将需要非归一化才能检索初始数据范围内的值。
Let’s add the normalizer to our UnsupervisedDataBunch:
让我们将规范化器添加到我们的UnsupervisedDataBunch :
处理分类特征 (Handling categorical features)
Another important preprocessing step for Self-Organizing Maps is transforming categorical features into continous; this could be done by either One-Hot encoding features, or by using embeddings. Since One-Hot encoding is the easiest to implement, we’ll start with that, although embeddings have a better performance.
自组织地图的另一个重要预处理步骤是将分类特征转换为连续特征。 这可以通过“一键编码”功能或使用嵌入来完成。 由于“一键编码”是最容易实现的,因此我们从此开始,尽管嵌入的性能更好。
Both methods require a mixed distance function to compare actual continuous features and converted categoricals independently, but we will skip this step for simplicity’s sake. If you’re interested in how a mixed distance function can be implemented, feel free to have a look at the code on Github.
两种方法都需要混合距离函数来独立比较实际连续特征和转换后的分类,但是为简单起见,我们将跳过此步骤。 如果您对如何实现混合距离函数感兴趣,请随时查看Github上的代码 。
As we did for normalizers, we will start by defining a base CatEncoder class:
就像我们对规范化器所做的那样,我们将从定义基本CatEncoder类开始:
And subclass it into an OneHotCatEncoder:
并将其子类化为OneHotCatEncoder :
All we’re doing here is using torch.nn.functional.one_hot to perform one-hot encoding of our input variables, storing the number of categories for each feature in the training set during fit, and then using this information to perform encoding with make_continuous and decoding with make_categorical .
我们在这里所做的全部工作是使用torch.nn.functional.one_hot对输入变量执行一次热编码,在fit期间存储训练集中每个特征的类别数量,然后使用此信息对make_continuous并使用make_categorical解码。
导入熊猫数据框 (Importing Pandas DataFrames)
One feature we might want for our UnsupervisedDataBunch is the ability of being created from a Pandas DataFrame. As mentioned in the overview above, we will leverage Fast.ai TabularDataBunch to do the data loading and preprocessing for us, then we’ll import the data into our own databunch.
我们可能想要的UnsupervisedDataBunch功能之一是可以从Pandas DataFrame创建的功能。 如以上概述中所述,我们将利用Fast.ai TabularDataBunch为我们执行数据加载和预处理,然后将数据导入到我们自己的数据束中。
A TabularDataBunch is usually created as follows:
TabularDataBunch通常如下创建:
The code above does the following:
上面的代码执行以下操作:
- Load the dataframe into a TabularList 将数据框加载到TabularList中
- Split the list into training and validation sets 将列表分为训练和验证集
- Fill in missing values 填写缺失值
- Turn all categorical features into ordinal categories 将所有分类特征转换为顺序分类
Now we can write a conversion function to transform the TabularDataBunch into an UnsupervisedDataBunch. This is where things get hacky: we need to retrieve categorical and continuous features separately, process categorical features using OneHotCatEncoder and then concatenate everything into a single Tensor.
现在,我们可以编写一个转换函数,将TabularDataBunch转换为UnsupervisedDataBunch。 这就是问题的所在:我们需要分别检索分类特征和连续特征,使用OneHotCatEncoder处理分类特征,然后将所有内容连接到单个Tensor中。
TabularDataBunch -> UnsupervisedDataBunch conversion
TabularDataBunch -> UnsupervisedDataBunch转换
Since the TabularDataBunch can have a target variable, we are going to add the optional train_y and valid_y arguments to our UnsupervisedDataBunch:
由于TabularDataBunch可以具有目标变量,因此我们将在我们的UnsupervisedDataBunch中添加可选的train_y和valid_y参数:
We can now convert any TabularDataBunch by simply using the extension function:
现在,我们只需使用扩展功能即可转换任何TabularDataBunch:
The next step is testing everything we’ve done so far on an actual dataset.
下一步是测试到目前为止我们在实际数据集上所做的一切。
房屋价格数据集培训 (Training on House Prices dataset)
I chose the House Prices dataset, since it is well-known and it has a good number of categorical features that we can use to test our data workflow. You can find the dataset on Kaggle, among other places.
我选择了“房屋价格”数据集,因为它是众所周知的,并且具有大量可用于测试数据工作流的分类功能。 您可以在Kaggle和其他地方找到数据集。
Let’s start from a CSV file containing the training set and go from there:
让我们从包含训练集的CSV文件开始,然后从那里开始:
Pretty neat, right? In just about 40 lines of code we got ourselves a trained Self-Organizing Map 😊
很整洁吧? 在大约40行代码中,我们获得了训练有素的自组织图😊
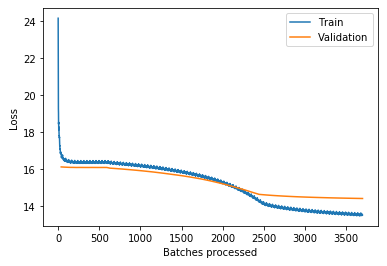
Here’s the loss plot:
这是损失图:
从SOM代码本创建DataFrame (Creating a DataFrame from the SOM codebook)
One of the best things about Self-Organizing Maps is the ability to run predictions of another model (trained on the same dataset) over the codebook elements, and then plot prediction values / classes for each item on the map.
关于自组织地图的最好的事情之一是能够在码本元素上运行另一个模型(在相同数据集上训练)的预测,然后在地图上为每个项目绘制预测值/类的能力。
To do so, we could write a codebook_to_df function inside our SomLearner:
为此,我们可以在SomLearner编写一个codebook_to_df函数:
Now we need a model to use for prediction. Let’s use this Kaggle submission of House Prices regression with a Fast.ai Tabular learner as a starter:
现在我们需要一个用于预测的模型。 让我们使用Fast.ai Tabular学习者作为入门者的Kaggle房价回归报告 :
在SOM代码本上运行回归 (Running regression on SOM codebook)
Now that we have a trained regressor, let’s generate the DataFrame of the SOM codebook and use it as a test set:
现在我们有了训练有素的回归器,让我们生成SOM码本的DataFrame并将其用作测试集:
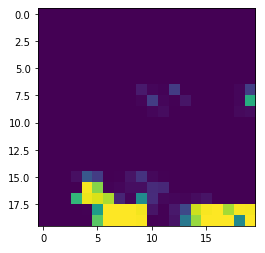
Now we can use plt.imshow() on predictions to get a visualization of house price distribution over the SOM 😊
现在我们可以对预测使用plt.imshow()以获得SOM上房价分布的可视化😊
This is cool, right? In the next article we will complete our SOM toolkit by adding a whole lot of visualization and interpretation utilities, basing our API on Fast.ai ClassificationInterpretaion class.
太酷了吧? 在接下来的文章中,我们将通过增加一大堆的可视化和解释事业,立足我们的API上Fast.ai完成我们的SOM工具箱ClassificationInterpretaion类。
Note: the library code for UnsupervisedDataBunch has been rewritten by using Fast.ai TabularDataBunch with additional transforms. This article builds the DataBunch from scratch, and it was left untouched for easier understanding.
注意: UnsupervisedDataBunch的库代码已通过使用Fast.ai TabularDataBunch和其他转换重写。 本文是从头开始构建DataBunch的,为了便于理解,它保持不变。
fast.ai


 被折叠的 条评论
为什么被折叠?
被折叠的 条评论
为什么被折叠?
 到【灌水乐园】发言


