


 本文介绍了将音频数据用于深度学习的7个学习步骤,并提供了4个简单的音频标注步骤,帮助初学者理解如何准备音频数据以供深度学习模型使用。
深度学习学习7步骤
In order to train Deep Learning models, preparing and curating datasets is usually a very important step. In this story, I show how you can use Audacity a “free, open-source, cross-platform audio software” to label your data.
为了训练深度学习模型,准备和整理数据集通常是非常重要的一步。 在这个故事中,我将向您展示如何使用Audacity这个“免费,开源,跨平台的音频软件”来标记数据。
表中的内容 (Table of content)
- Spectrogram Representation 频谱图表示
- Creating Labels 创建标签
- Exporting Labels 导出标签
- Loading Data on Python 在Python上加载数据
1.频谱图表示 (1. Spectrogram Representation)
The first step, right after installing Audacity and importing an audio file, is to change to spectrogram representation as shown in the image below.
在安装Audacity并导入音频文件之后,第一步就是更改为频谱图表示形式 ,如下图所示。

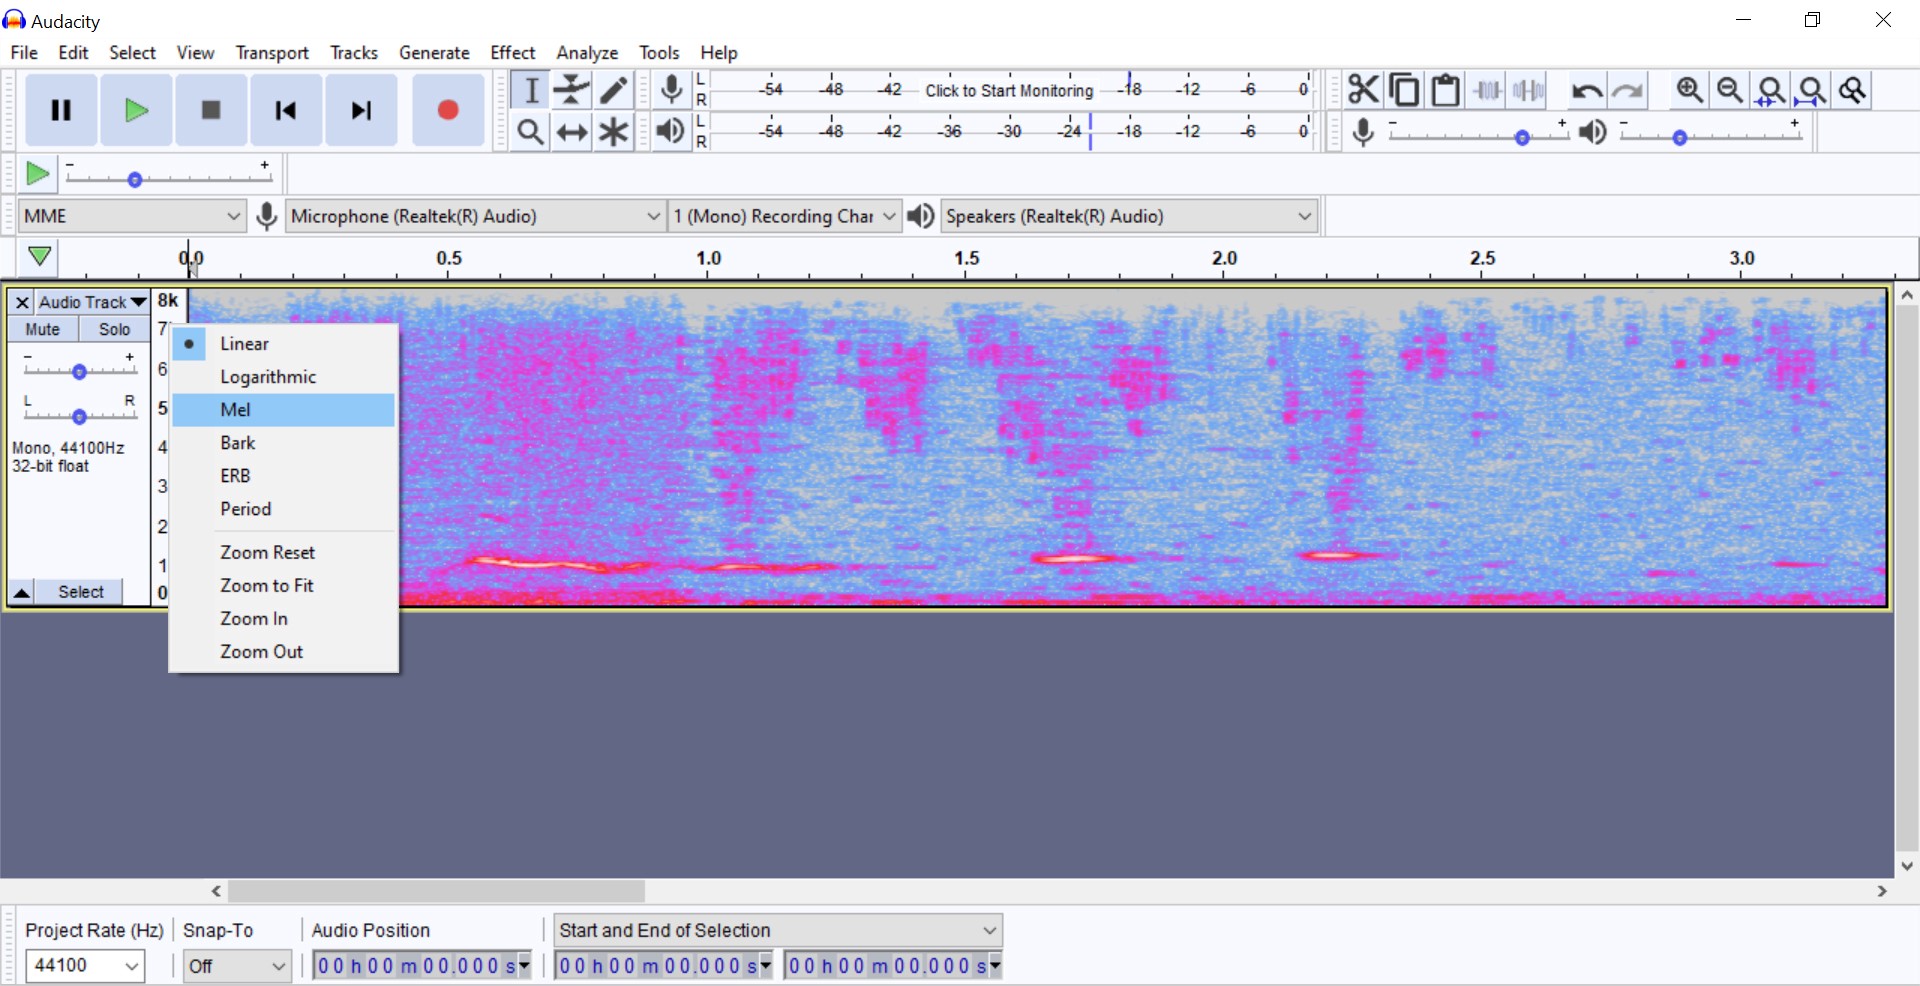
You can then adjust the spectrogram settings in the same menu and the scale of visualization by right-clicking on the scale. In the example below, I’m selecting “Mel” option for the scale. You can read more about the meaning of Mel Spectrograms in this story by Dalya Gartzman.
然后,您可以在同一菜单中调整频谱图设置,并通过右键单击刻度来调整可视化的刻度。 在下面的示例中,我为秤选择“ Mel”选项。 您可以在Dalya Gartzman的 故事中了解有关梅尔谱图的含义的更多信息。
2.创建标签 (2. Creating Labels)
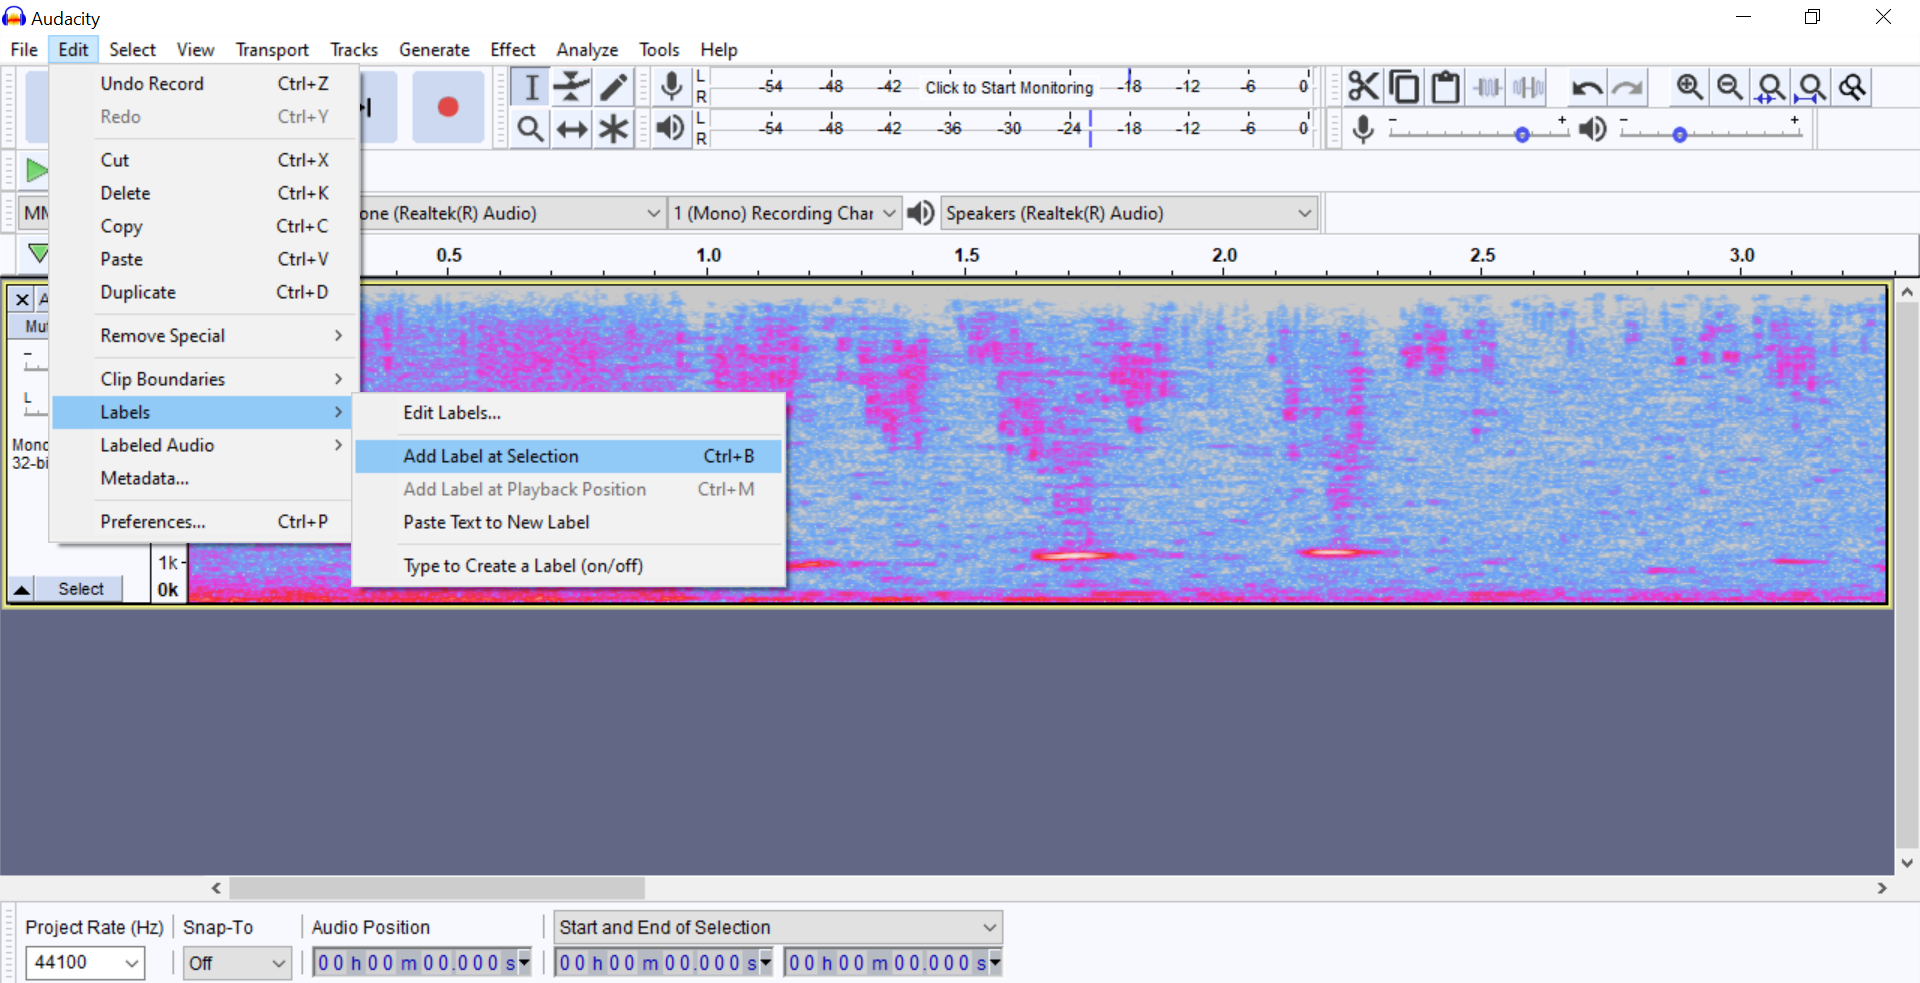
To create the labels first go Edit > Labels > Add Label at Selection and check the keyboard shortcut (Ctrl+B in Windows) so that you don’t need to go back to the menu every time.
要创建标签,请首先进入“ 编辑”>“标签”>“在选择时添加标签”,然后检查键盘快捷键(在Windows中为Ctrl + B),这样就无需每次都返回菜单。
Now that you know the keyboard shortcut select a region in the spectrogram that you want to label (click and drag) and then use the shortcut to ‘Add Label at Selection’. A label track will appear and you can type the name for your label. You can repeat this process to add as many labels as needed!
现在您已经知道键盘快捷键,在频谱图中选择要标记的区域(单击并拖动),然后使用该快捷方式“在选择时添加标签”。 标签轨道将出现,您可以键入标签的名称。 您可以重复此过程以根据需要添加尽可能多的标签!
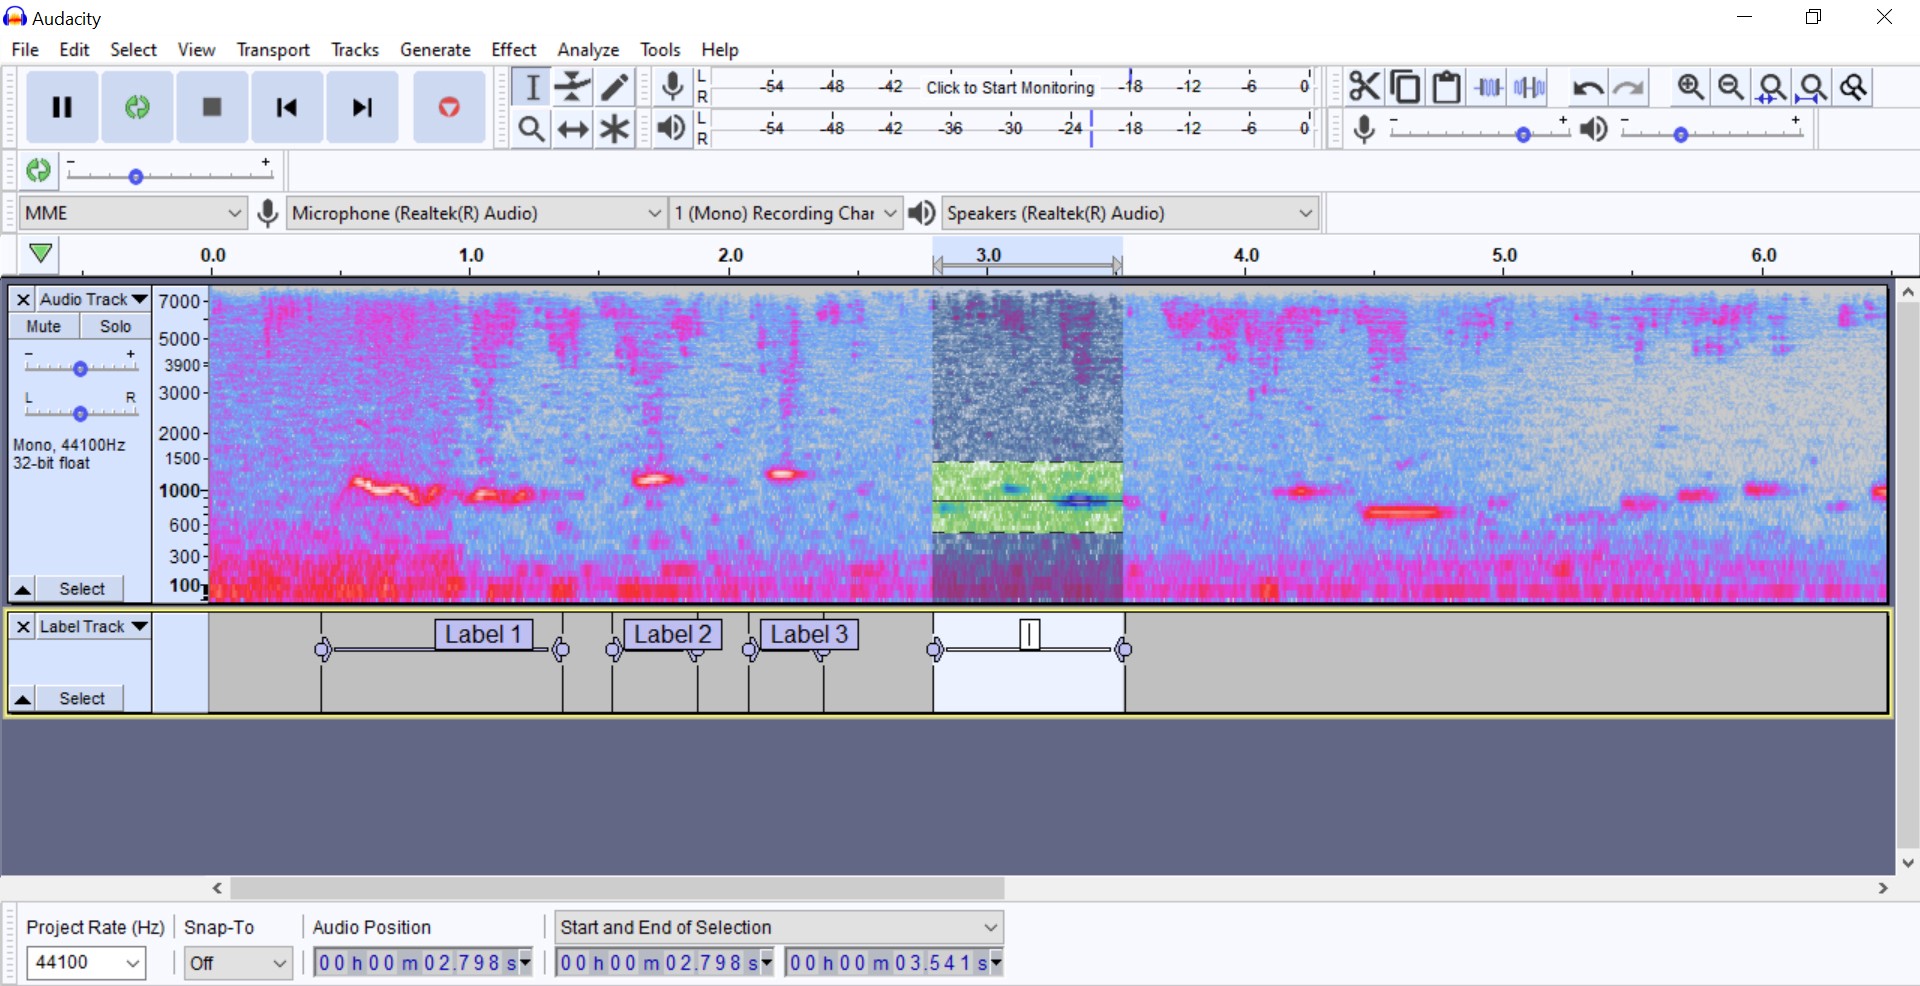
Note: It helps to play the clip as you are labelling. You can use the ‘space bar’ to play and pause.
注意:在贴标签时播放片段会有所帮助。 您可以使用“空格键”播放和暂停。
3.导出标签 (3. Exporting Labels)
To export the labels, go to File > Export > Export Labels.
要导出标签,请转到文件>导出>导出标签。
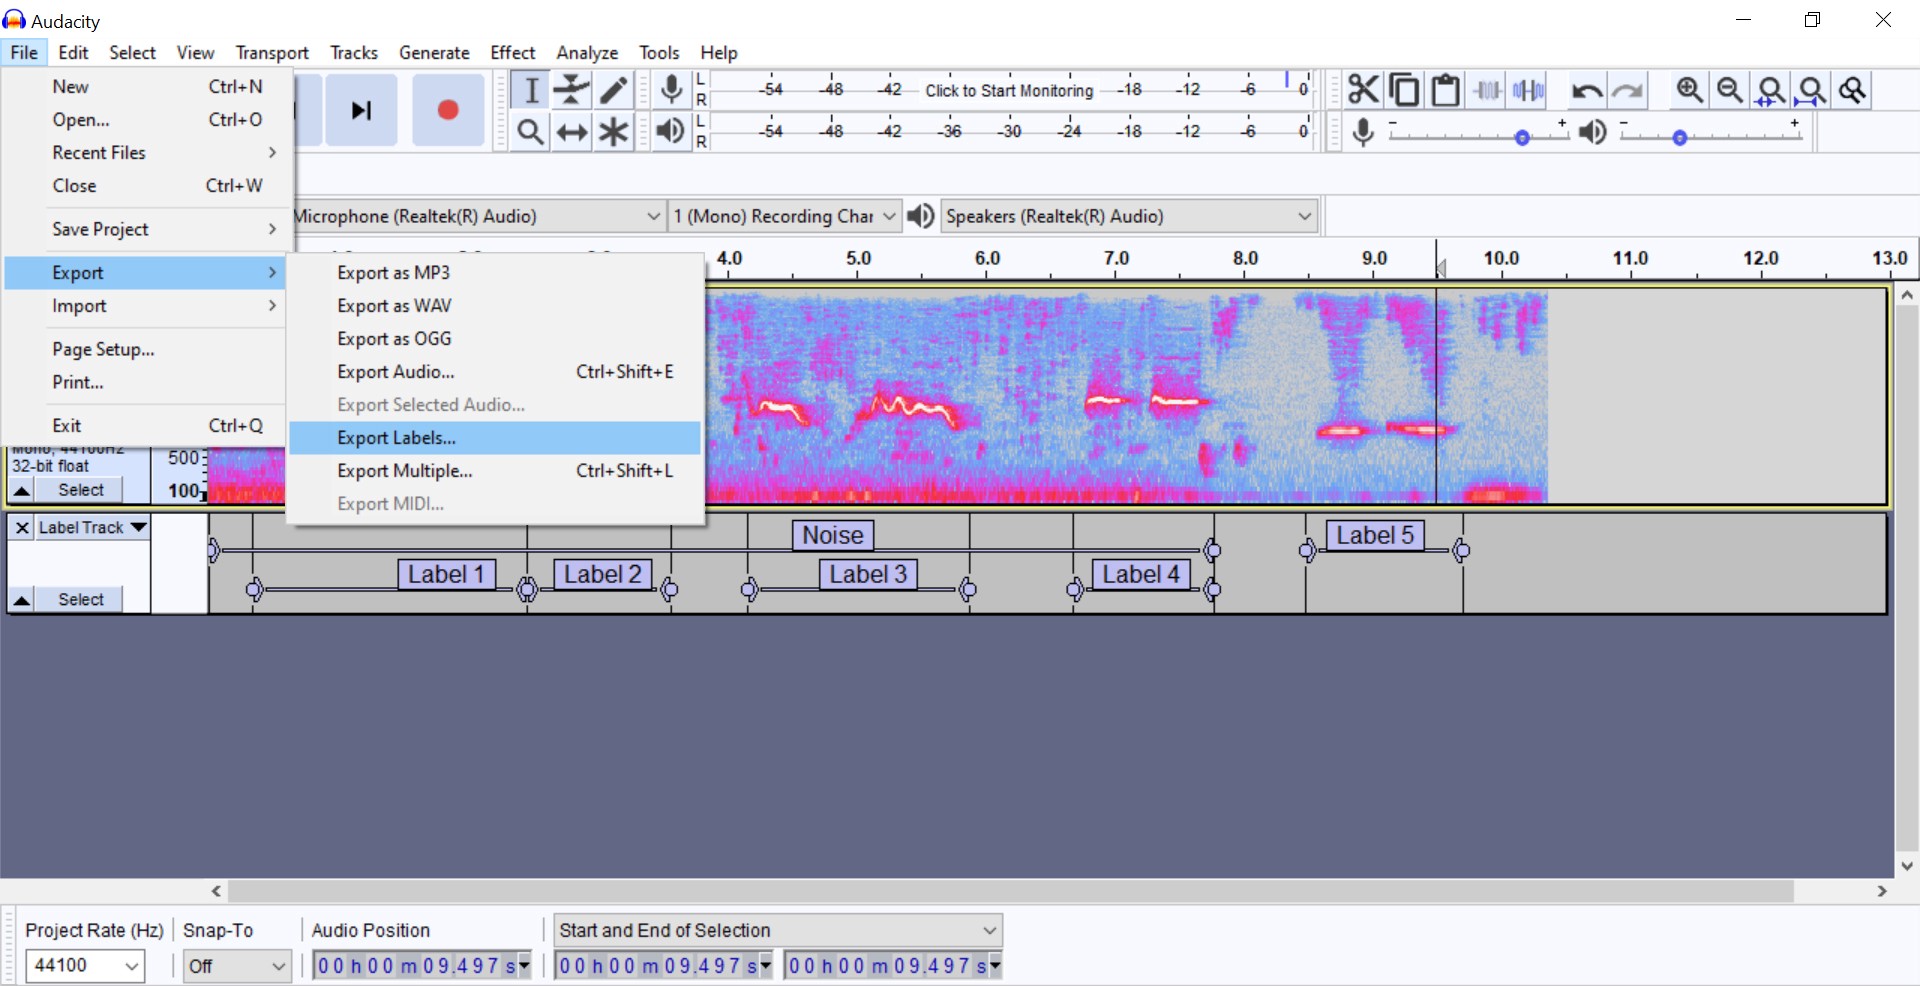
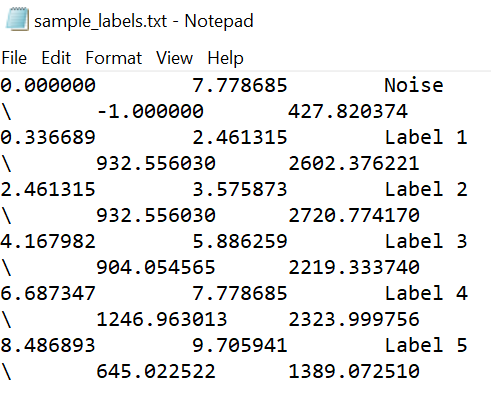
The result is a text file with each label indicating the start and end time, name of the label, and minimum and maximum frequency. A value of -1 in the frequency indicates lower than the minimum or higher than the maximum displayed.
结果是一个文本文件,每个标签指示开始和结束时间,标签名称以及最小和最大频率。 频率值-1表示低于显示的最小值或高于显示的最大值。
4.在Python上加载数据 (4. Loading Data on Python)
After repeating the steps above for all audio files you are ready to load the data in Python! I prepared the following code to read and display a spectrogram with the respective labels. The code is also available as a Kaggle kernel.
对所有音频文件重复上述步骤之后,您就可以在Python中加载数据了! 我准备了以下代码,以读取和显示带有相应标签的频谱图。 该代码也可以作为Kaggle内核使用 。
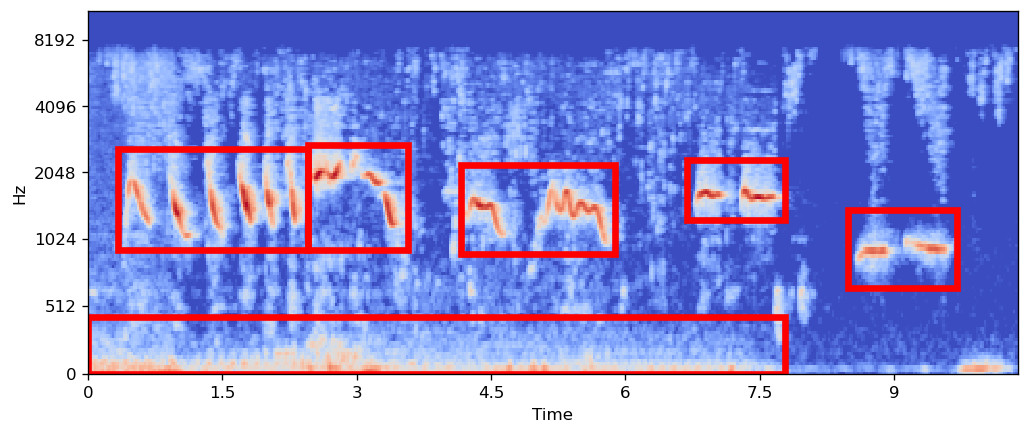
The result is the following image of the Mel Spectrogram with the red bounding boxes corresponding to the labels in the ‘labels dataframe’ (code above).
结果是梅尔频谱图的以下图像,其中红色边框与“标签数据框”(上面的代码)中的标签相对应。
结束语 (Final remarks)
I hope you find this story useful! Please consider joining my private mailing list in this link so that you won’t miss any of my following stories! You can read more about my Data Science journey in the following two stories!
我希望您觉得这个故事有用! 请考虑通过此链接加入我的私人邮件列表 这样您就不会错过我的以下任何故事! 您可以通过以下两个故事阅读有关我的数据科学之旅的更多信息!
Thanks for reading! Have a great day!
谢谢阅读! 祝你有美好的一天!
翻译自: https://towardsdatascience.com/how-to-label-audio-for-deep-learning-in-4-simple-steps-6a2c33b343e6
深度学习学习7步骤


 被折叠的 条评论
为什么被折叠?
被折叠的 条评论
为什么被折叠?
 到【灌水乐园】发言


