


学习xdebug的trace用法,现将遇到的问题写在下面,希望高手指教,谢谢.
环境xdebug +sublime +chrome浏览器+debug helper
php.ini中的配置:
[xdebug]
zend_extension ="D:/wamp64/bin/php/php7.0.10/zend_ext/php_xdebug-2.4.1-7.0-vc14-x86_64.dll"
xdebug.remote_handler = dbgp
xdebug.remote_host = localhost
xdebug.remote_mode = req
xdebug.remote_port = 9000
xdebug.idekey=PHPSTORM
;远程调试
xdebug.remote_enable=ON
xdebug.remote_autostart=on
;开启自动跟踪
xdebug.auto_trace = On ;开启自动跟踪
xdebug.trace_output_dir="E:\xdebug\trace"
xdebug.trace_enable_trigger_value="XDEBUG_TRACE"
xdebug.collect_params = 4
xdebug.collect_includes = On
xdebug.collect_return = On
xdebug.show_mem_delta = On
;把执行情况的分析文件写入到指定目录中
xdebug.profiler_enable=on
xdebug.profiler_output_dir="E:\xdebug\profiler"
被测试的php代码switch.php:
function test($data,$func='strip_tags'){
xdebug_start_trace();
if(empty($data)){
return $data;
}
//需要对方法进行约束
switch($func){
case 'strip_tags':
$func="strip_tags";
break;
case 'intval':
$func="intval";
break;
case 'htmlspecials':
$func="htmlspecials";
break;
default:
die;
}
return $func($data);
xdebug_stop_trace();
}
echo test("<sript>alert('abc');xxxx</script>");
xdebug helper设置:
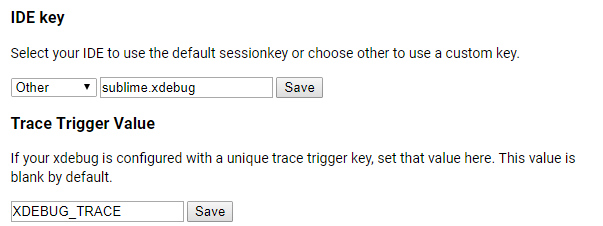
访问地址:
http://localhost/NutCloud/demo/php_basic/test/switch.php?XDEBUG_TRACE
为啥我的E:xdebugtrace目录下没有任何文件产生,我哪个环节出了问题?


 1250
1250


 被折叠的 条评论
为什么被折叠?
被折叠的 条评论
为什么被折叠?
 到【灌水乐园】发言


