本文实例讲述了Chart.js功能与使用方法。分享给大家供大家参考,具体如下:
官方文档
在react中的使用
开始使用
npm install chart.js --save
在相应的页面中引入 chartjs
import Chart from "chart.js"
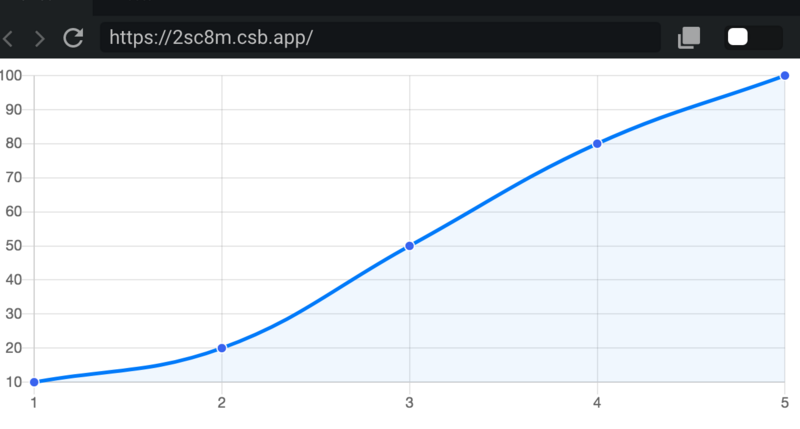
先写一个小的demo
import React from "react";
import ReactDOM from "react-dom";
import Chart from "chart.js";
class App extends React.Component {
constructor(props) {
super(props);
this.state = {};
}
componentDidMount() {
this.renderCanvas()
}
// 作图
renderCanvas = () => {
const myChartRef = this.chartRef.getContext("2d");
new Chart(myChartRef, {
type: "line",
data: {
labels: [1,2,3,4,5],
datasets: [
{
data: [10, 20, 50, 80, 100],
backgroundColor: "rgba(71, 157, 255, 0.08)",
borderColor: "rgba(0, 119, 255, 1)",
pointBackgroundColor: "rgba(56, 96, 244, 1)",
pointBorderColor: "rgba(255, 255, 255, 1)",
pointRadius: 4
}
]
},
options: {
responsive: true,
legend: {
display: false
},
maintainAspectRatio: false
}
});
};
render() {
return (
(this.chartRef = ref)} />
);
}
}
const rootElement = document.getElementById("root");
ReactDOM.render(, rootElement);

动态更新的数据
import React from "react";
import ReactDOM from "react-dom";
import Chart from "chart.js";
let currentChart;
class App extends React.Component {
constructor(props) {
super(props);
this.state = {
data: [30, 60, 90, 120, 100]
};
}
componentDidMount() {
this.renderCanvas();
this.renderCurrent();
}
// 作图
renderCanvas = () => {
const myChartRef = this.chartRef.getContext("2d");
new Chart(myChartRef, {
type: "line",
data: {
labels: [1, 2, 3, 4, 5],
datasets: [
{
data: [10, 20, 50, 80, 100],
backgroundColor: "rgba(71, 157, 255, 0.08)",
borderColor: "rgba(0, 119, 255, 1)",
pointBackgroundColor: "rgba(56, 96, 244, 1)",
pointBorderColor: "rgba(255, 255, 255, 1)",
pointRadius: 4
}
]
},
options: {
responsive: true,
legend: {
display: false
},
maintainAspectRatio: false
}
});
};
renderCurrent = () => {
const { data } = this.state;
const currentCharttemp = this.currentChart.getContext("2d");
if (typeof currentChart !== "undefined") {
currentChart.destroy();
}
currentChart = new Chart(currentCharttemp, {
type: "line",
data: {
labels: [1, 2, 3, 4, 5],
datasets: [
{
data: data,
backgroundColor: "rgba(71, 157, 255, 0.08)",
borderColor: "rgba(0, 119, 255, 1)",
pointBackgroundColor: "rgba(56, 96, 244, 1)",
pointBorderColor: "rgba(255, 255, 255, 1)",
pointRadius: 4
}
]
},
options: {
responsive: true,
legend: {
display: false
},
maintainAspectRatio: false
}
});
};
render() {
return (
(this.chartRef = ref)} />
onClick={()=>
this.setState({ data: [200, 500, 20, 50, 100] }, this.renderCurrent)
}
>
更新数据
(this.currentChart = ref)} />
);
}
}
感兴趣的朋友可以使用在线HTML/CSS/JavaScript代码运行工具:http://tools.jb51.net/code/HtmlJsRun测试上述代码运行效果。
希望本文所述对大家JavaScript程序设计有所帮助。


 被折叠的 条评论
为什么被折叠?


